
I. Introduction
In this paper, we examine how ESG-related uncertainty has impacted energy demand and the energy mix in Canada. We hypothesise that ESG uncertainty promotes the energy transition by reallocating demand toward renewables rather than simply reducing aggregate consumption. The proposed relationship between ESG uncertainty and energy intensity is motivated by Bloom (2009)’s uncertainty-driven real options theory. Under this framework, heightened ambiguity regarding the stringency and timing of environmental regulations creates a “wait-and-see” effect for carbon-intensive investments, while simultaneously incentivising a shift toward renewables perceived as more resilient to future regulatory and transition risks.
This hypothesis test is important because, as climate commitments and sustainable finance regulations evolve, the resulting uncertainty can influence energy systems through two competing channels: a demand-reduction channel, which delays consumption and investment, and a reallocation channel, which alters relative incentives toward cleaner sources. Distinguishing these paths is critical for policymakers to understand whether “uncertainty” acts as a contractionary shock or an accelerant for compositional change, thereby determining whether the transition requires demand-side interventions or supply-side structural reforms such as grid modernisation.
We employ Canadian quarterly data covering the 2002–2024 period and find that ESG uncertainty is more consistently associated with increases in the renewable share of total energy than with uniform declines in aggregate energy use. These results pass robustness tests that address model specification by comparing our multivariate wavelet quantile regression (MWQR) estimates with those from standard wavelet quantile frameworks. Our approach captures heterogeneity across both market states and time horizons, accounting for the nonlinear and complex dependence structures identified in the data.
This study makes two contributions to the literature. The first is that we provide the first empirical evidence for Canada that explicitly separates the reduction and reallocation channels of ESG-related uncertainty, clarifying that uncertainty primarily functions as a compositional driver. The second is that we apply a multivariate scale-frequency framework that reveals how these relationships vary across different economic quantiles and time scales, offering a more nuanced perspective on energy transition dynamics than conventional mean-based or linear time-series methods.
The remainder of the paper is organised as follows. Section II reviews the related literature on uncertainty, energy demand, and renewable energy transition. Section III describes the data and methodology used in the empirical analysis. Section IV presents and discusses the empirical results, including the robustness checks and the main lessons from the findings. Section V concludes the paper.
II. Literature Review
The growing literature on uncertainty and energy dynamics shows that policy-related uncertainty significantly affects energy consumption and renewable deployment, but the underlying transmission channels remain debated. Existing studies largely document that economic policy uncertainty influences renewable energy use and investment (Akadiri & Özkan, 2026; Pata, 2024; Shafiullah et al., 2021; Yi et al., 2023), while others highlight links between climate policy uncertainty and clean energy markets (Athari & Kirikkaleli, 2025). However, this literature predominantly relies on aggregate energy measures or single-equation frameworks, making it difficult to disentangle whether observed effects reflect an overall contraction in energy demand or a shift toward cleaner sources.
Moreover, most prior approaches are based on mean-based and time-domain methods, which may obscure state-dependent and multi-horizon dynamics (Bloom, 2009). Recent advances incorporating ESG-related uncertainty (Ongan et al., 2025) have improved measurement but have not explicitly addressed this compositional distinction. This study contributes by jointly modelling total energy use and energy mix within a multivariate wavelet quantile framework, allowing a direct assessment of whether ESG uncertainty operates through demand reduction or reallocation across energy sources (Akadiri et al., 2026).
III. Data and Methodology
A. Data
This study uses Canadian quarterly data for the period 2002Q1–2024Q4. ESG uncertainty is measured using the environmental, social, and governance-based sustainability uncertainty index (ESGUI) developed by Ongan et al. (2025), while energy transition dynamics are captured by the renewable energy share in the energy mix (ENMIX) dataset from Our World in Data. Aggregate energy demand is represented by ENUSE, which is logged to stabilise variance and allow interpretation of coefficients in proportional terms. Macroeconomic conditions are controlled for using logged gross domestic product per capita (GDPPC), obtained from World Development Indicators (WDI).
ESGUI is a specialised country-level index, and its measurement properties are detailed in Ongan et al. (2025). To account for the bounded nature and potential nonlinearity of the ENMIX variable, we utilise the MWQR framework, which provides robust estimation over the conditional distribution. All series are harmonised to a quarterly frequency; when higher-frequency data are unavailable, temporal disaggregation is implemented using a quadratic-sum approach to preserve aggregate consistency while minimising measurement distortion.
B. Methodology
This study employs the Multivariate Wavelet–Quantile Regression (MWQR) approach proposed by Adebayo et al. (2025). MWQR extends the standard wavelet quantile framework by incorporating a vector of control variables thereby allowing the quantile- and scale-specific effect of on to be estimated while conditioning on additional covariates. This extension enhances identification and strengthens the robustness of distributional inference across wavelet scales. The MWQR specification is expressed as follows:
\[\begin{aligned} \phi_{\tau}\left( d_{j}\lbrack Y\rbrack \mid d_{j}\lbrack X\rbrack,d_{j}\lbrack Z\rbrack \right) &= \beta_{0,j}(\tau) + \beta_{1,j}(\tau)d_{j}\lbrack X\rbrack\\ & \quad + \beta_{2,j}(\tau) \cdot d_{j}\lbrack Z\rbrack \end{aligned}\tag{1}\]
Here, ϕτ(·) denotes the conditional τ-quantile function, while and represent the MODWT coefficients of and at scale j, respectively. The term captures the inner product between the vector of control-variable coefficients and their corresponding wavelet coefficients. Meanwhile, β1,j(τ) isolates the conditional impact of on at quantile τ and scale j.
Table 1 reports preliminary diagnostics for the ESGUI, GDPPC, ENMIX, and ENUSE. Panel A shows that the series are fairly stable over the period 2002Q1–2024Q4, as indicated by small standard deviations, with mild departures from normality: ESGUI, GDPPC, and ENMIX are slightly left-skewed, while ENUSE is close to symmetric. Kurtosis values are mostly below 3, indicating platykurtic distributions, except for ESGUI, which is near normal. Panel B indicates mixed integration properties: ESGUI is stationary in levels under both the augmented Dickey–Fuller (ADF) and Phillips–Perron (PP) tests, significant at the 1% level, whereas GDPPC, ENMIX, and ENUSE are not consistently stationary in levels but become stationary after first differencing; that is, they behave like I(1) variables. These results motivate the use of a framework that can accommodate nonstandard distributional features and mixed persistence. Importantly, they also justify careful modelling of dynamics rather than reliance on simple mean-based linear specifications.
Building on Table 1, which establishes the basic distributional features and shows that the variables exhibit mixed persistence, with ESGUI stationary in levels and GDPPC, ENMIX, and ENUSE largely I(1), Table 2 shifts the focus from linear time-series properties to whether the series also display nonlinear dependence. This is an important consideration when motivating the use of a wavelet–quantile framework.
Table 2 presents the Brock–Dechert–Scheinkman (BDS) test results for ESGUI, GDPPC, ENMIX, and ENUSE across embedding dimensions 2–6. All reported BDS statistics are statistically significant at the 1% level across all dimensions (p < 0.01), implying rejection of the null hypothesis that each series is independently and identically distributed. In practice, this suggests departures from simple linear or stochastic dependence. The persistence of statistical significance as the embedding dimension increases provides robust evidence of nonlinear structure or complex dependence in each variable, reinforcing the appropriateness of methods designed to capture nonlinearity and heterogeneous relationships across the distribution, such as multiscale wavelet and quantile-based regression, rather than relying solely on conventional linear models focused on average effects.
IV. Empirical Results
A. MWQR results
Figure 1 presents the MWQR estimates across quantiles and wavelet scales. To strengthen the economic interpretation, the discussion emphasises the magnitude, directional consistency, and persistence of the coefficients rather than relying solely on the frequency of statistical significance.
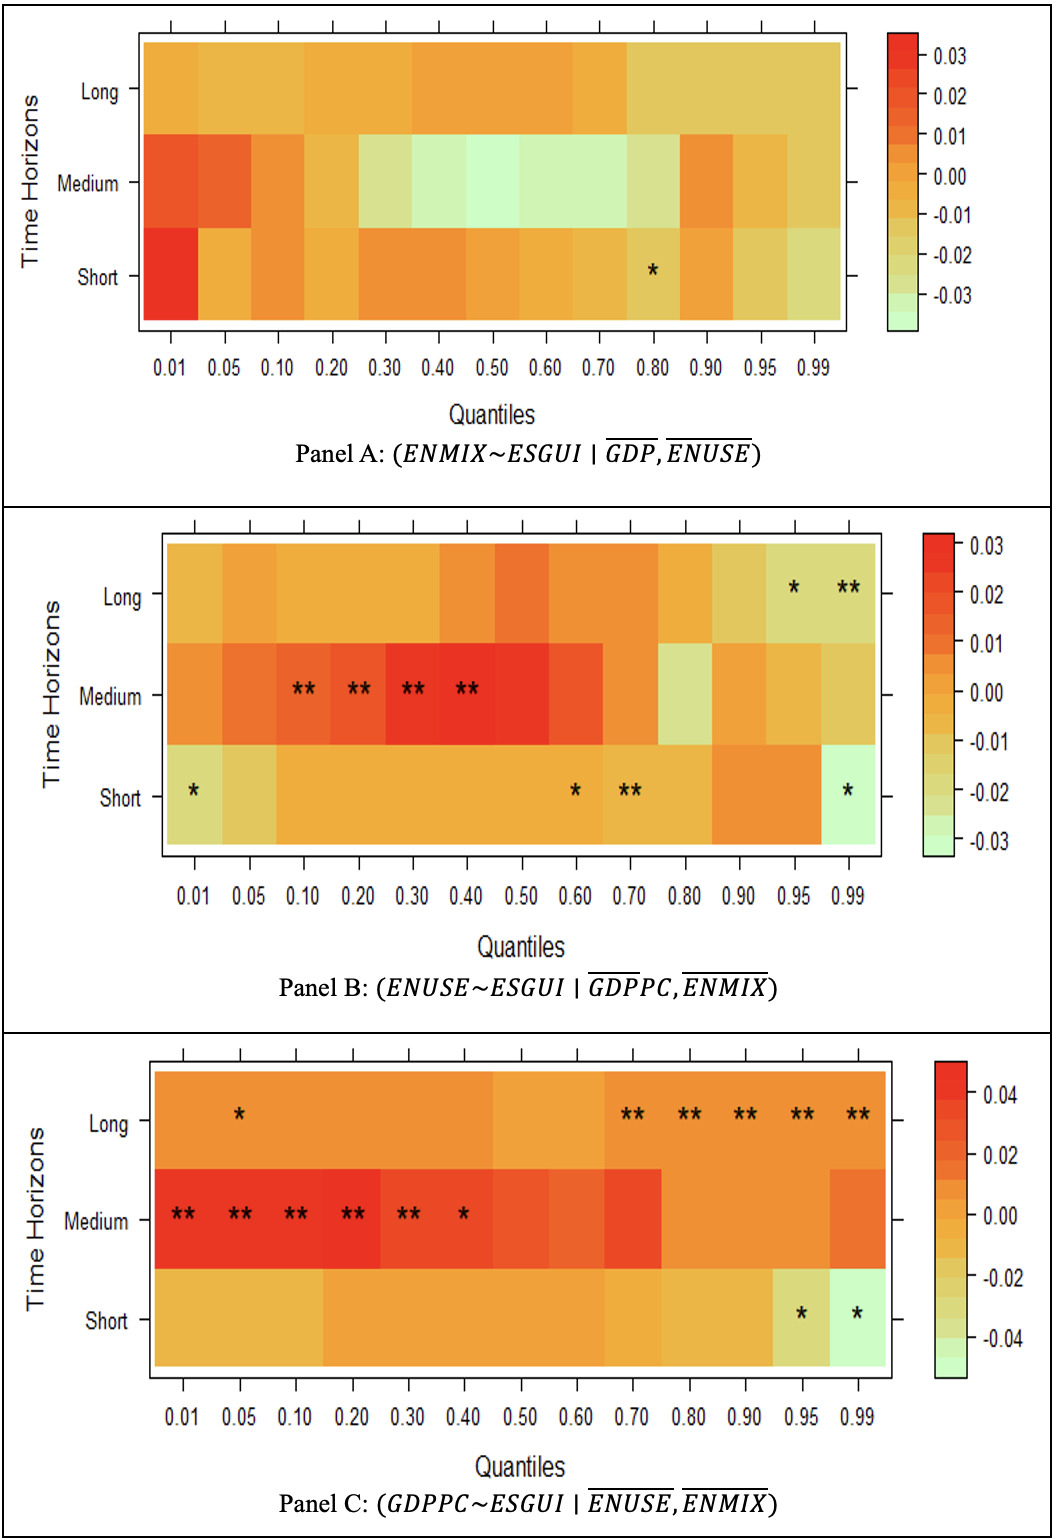
Panel A reports the results for ENMIX, representing the reallocation channel. ESGUI displays consistently positive coefficients across a wide range of quantiles and scales, with magnitudes that are economically meaningful and stable across adjacent frequency components. This persistence indicates that increases in ESG uncertainty are systematically associated with a higher share of renewable energy. The stability of both the sign and magnitude across the distribution suggests a robust compositional adjustment rather than isolated or model-specific effects.
Panel B reports the results for ENUSE, representing the demand channel. In contrast, the ESGUI–ENUSE relationship is characterised by small, unstable coefficients that fluctuate in sign and remain close to zero across quantiles and scales. The lack of persistence and low economic magnitude indicate that total energy demand does not exhibit a consistent or meaningful response to ESG uncertainty. This weak and irregular pattern suggests that any demand-reduction effects are limited and not economically dominant.
Panel C reports the results for GDPPC, representing the macroeconomic context. The response of GDPPC is heterogeneous and localised, with no consistent pattern in magnitude or direction across scales. Importantly, the absence of a systematic contractionary effect reinforces the view that the observed increase in the renewable share is not simply driven by reduced economic activity but instead reflects a distinct adjustment in energy composition.
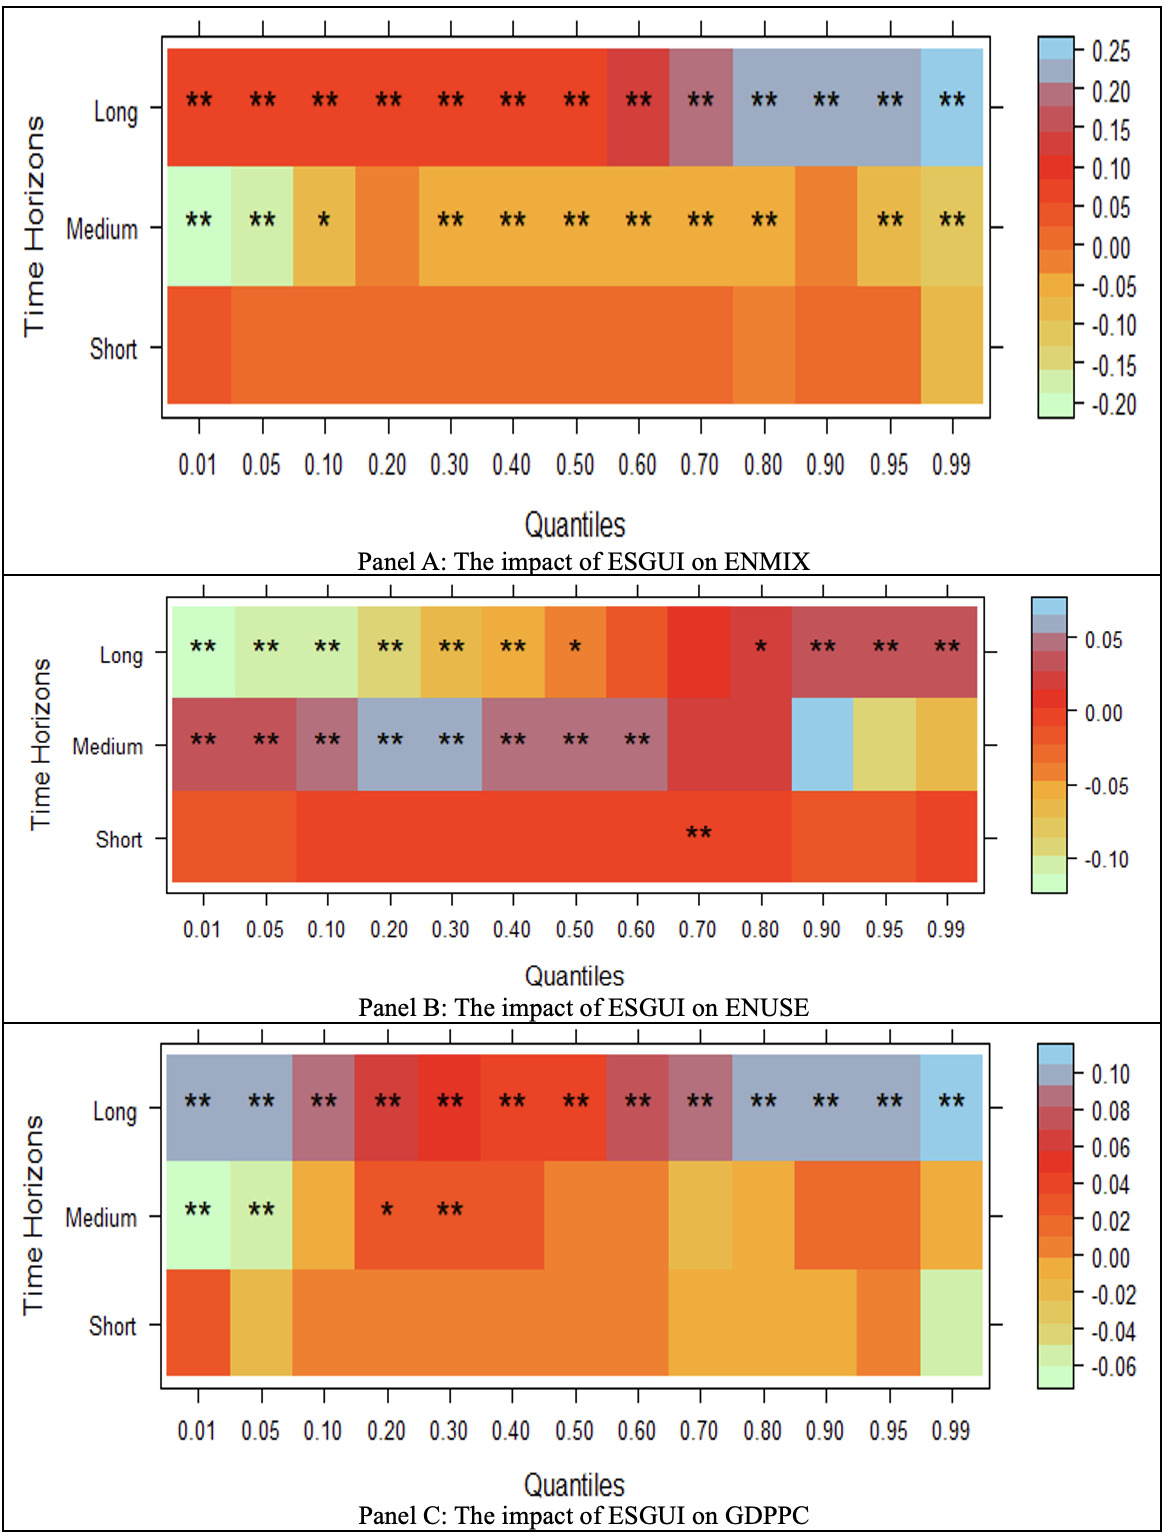
To further assess robustness, these patterns are compared with the standard wavelet quantile regression (WQR) results reported in Figure 2. The WQR results yield similar directional and magnitude-based conclusions, reinforcing that the findings are not driven by model complexity. Overall, the evidence points to a consistent and economically meaningful reallocation effect: ESG uncertainty shifts the energy mix toward renewables while exerting only limited and non-systematic influence on aggregate energy demand.
B. Robustness check
Figure 2 reports the estimates from the standard WQR model, which serves as a benchmark for comparison with the multivariate MWQR results. The comparison focuses on the direction, magnitude, and persistence of the effects rather than on statistical significance alone.
The WQR results corroborate the main finding that ESG uncertainty consistently has positive and economically meaningful effects on ENMIX, with magnitudes that remain stable across quantiles. In contrast, the effects on ENUSE are smaller in magnitude and less directionally consistent, reinforcing the absence of a systematic demand-reduction channel. Importantly, these patterns closely mirror those obtained from the MWQR framework, even though the latter incorporates additional control variables.
Where differences arise, they relate primarily to the precision and scaling of the coefficients, as expected given the more parsimonious structure of the WQR model. However, the preservation of sign consistency and relative magnitude across specifications indicates that the core results are not driven by model complexity or overfitting but instead reflect a stable empirical relationship.
The convergence of evidence across the MWQR and WQR models supports the interpretation that ESG uncertainty operates predominantly through reallocation, exerting a stronger and more persistent influence on energy composition than on aggregate energy demand (Bloom, 2009; Ongan et al., 2025).
The findings for Canada offer three critical lessons for managing energy transitions under ESG uncertainty. First, the evidence indicates that ESG uncertainty primarily functions as a reallocation mechanism rather than a demand-destruction shock. This suggests that while uncertainty may not curb total energy consumption, it effectively alters the relative attractiveness of energy sources, tilting the energy mix toward renewables as a hedge against transition risks.
Second, the scale-dependent nature of these effects implies that transition policies must be synchronised across different time horizons. Short-term uncertainty can create demand rigidities, whereas long-run structural shifts require more predictable policy regimes. Policymakers should therefore reduce transition uncertainty by improving the clarity and sequencing of climate mandates, including stable carbon-pricing trajectories and transparent ESG disclosure frameworks.
Finally, because the reallocative channel is more robust than the reduction channel, supply-side measures such as grid modernisation, permitting reforms, and clean investment tax credits are essential. These instruments can translate the uncertainty-driven shift in preferences into deployable capacity. Relying on uncertainty alone to drive decarbonisation is insufficient; it must be complemented by structural reforms that lower barriers to entry for cleaner energy technologies.
V. Conclusion
This study demonstrates that ESG-related uncertainty in Canada during 2002–2024 functions primarily as a reallocation mechanism rather than as a demand-destruction shock. Using MWQR, we find that uncertainty is more consistently associated with an increase in the share of renewable energy than with a uniform contraction in total energy use. These effects are notably heterogeneous across horizons and market states, suggesting that uncertainty incentivises agents to hedge against transition risks by shifting the energy bundle toward cleaner sources.
Policymakers in Canada should focus on improving the credibility and clarity of ESG standards to reduce the uncertainty premium and lower information frictions. Since total energy demand remains relatively rigid in the short run, supply-side measures such as grid expansion and clean investment credits are essential to translating these uncertainty-driven shifts into deployable renewable energy capacity.