

I. Introduction
Combating climate change and environmental problems has been pursued by enhancing the energy transition to clean sources (Ulussever et al., 2023). Accordingly, the negative effects of fossil fuel-based energy on the environment can be reduced as more clean energy is incorporated into the total energy mix. In addition to environmental concerns, the recent energy crisis also highlights the importance of energy transition, as increasing geopolitical tensions have imposed high risks on energy supply and prices. The ESR of countries has increased under this high-risk geopolitical environment. For this reason, both total ESR and ESR sub-types can be affected by such conditions. Thus, achieving energy transition has become critical.
Consistent with developments in environment and energy-related fields, the literature on ETI and ESR has been evolving. Some studies have focused on ETI. For example, Zhang et al. (2023) examine the USA and conclude that geopolitical risk negatively and insignificantly affects ETI. Kartal et al. (2024) study Nordic countries and determine the time- and frequency-based varying effect of ETI on decarbonization across countries. Lamnatou et al. (2024) highlight the role of renewable energy sources in the energy transition for France. Other studies have addressed ESR. For instance, Doğan et al. (2023) consider newly industrialized countries and state that ESR increases emissions. Iyke (2024) examines 25 countries and finds that climate change increases ESR. Moreover, some studies have considered both ETI and ESR simultaneously. Aslam et al. (2024) examine BRI countries and determine that ETI has a declining effect on ESR where renewable resources are used. Kartal et al. (2024) analyze the USA and state that ETI is not effective in easing ESR across time lags. Although the literature on ESR and ETI is growing, it remains limited. Some studies on the USA examine the effect of ETI on ESR (e.g., Kartal, Taşkın, et al., 2024); however, these studies have not considered ESR sub-types or addressed the incremental effect, which refers to the changing impact of independent variables (ESR sub-types) on the dependent variable (ETI) across percentiles. Hence, there is a gap in the literature: the incremental effect has not been considered, and ESR sub-types have not been used for the USA case. This study aims to fill this gap and differentiate itself from existing studies.
Because ensuring energy transition is critical, especially for larger economies due to their high energy consumption, empirical examination of such countries is appropriate, and this analysis can serve as a guide for other countries. Therefore, the USA is an ideal case for empirical analysis because it is the largest economy, uses high levels of energy, and faces environmental challenges (WB, 2024). Additionally, the USA has the most up-to-date data for both ETI and ESR (UNCTAD, 2024; USC, 2024), which enables researchers to conduct analyses using recent data.
Considering the literature gap, this study focuses on the USA in examining the incremental effect of ESR sub-types on ETI. To do this, the study uses ETI as a proxy for energy transition, as developed by UNCTAD (2024), considers ESR sub-types for a disaggregated analysis, and applies a Kernel regularized least squares (KRLS) approach. Thus, this study seeks to answer the following research questions: (i) How do ESR sub-types marginally affect ETI? (ii) Do the effects of ESR sub-types on ETI differ between average marginal effect (AME) and pointwise marginal effect (PME)?
This study offers three key contributions. First, it is a pioneering study for the USA that examines the effect of ESR sub-types on ETI. Although there are various studies on ETI, none have investigated ETI in the USA by considering ESR sub-types. Second, the study investigates the incremental effect of ESR sub-types on ETI, distinguishing it from prior research. Third, unlike other studies, this study employs a KRLS approach to uncover AME and PME.
The reminder of the paper is structured as follows. The methodology is presented in Section II, empirical outcomes in Section III, and the conclusion in Section IV.
II. Methodology
A. Data
Figure 1 presents the progress of ETI and ESR sub-types. ETI has exhibited a horizontal trend over the years, indicating an unsuccessful energy transition policy. In contrast, ESR has shown a time-varying structure. Total ESR increased until 2011 and then decreased after that point. A similar pattern is observed in ESR sub-types, except that reliability ESR experienced an increase between 2014 and 2017.
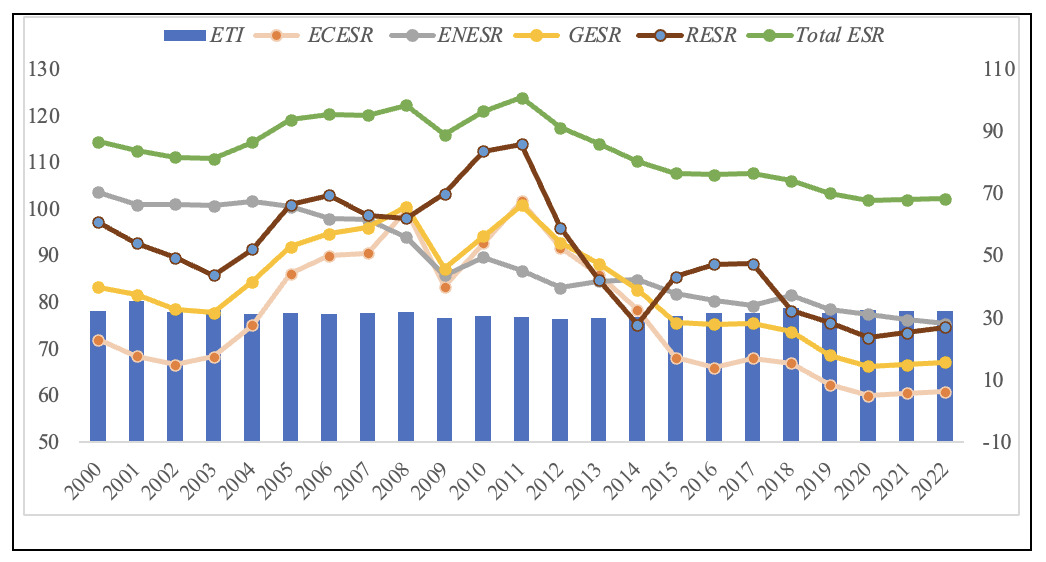
This study reveals the marginal effect of ESR sub-types on ETI. Therefore, the USA is examined because it offers extensive data, including data on ESR sub-types. In this context, the study uses ETI as a proxy for energy transition and considers ESR sub-types, consistent with the evolving literature. Additionally, the study analyzes data from 2000 to 2022, which represents the full range of available data. Data for ETI is sourced from UNCTAD (2024), while data for ESR sub-types is obtained from USC (2024). A summary of variable details are provided in Table A in the appendix.
B. Empirical Process
The study applies a five-steps process for empirical analysis. Firstly, descriptive statistics are analyzed. Secondly, correlations are examined. Thirdly, the nonlinearities are examined using the Broock, Scheinkman, Dechert, and LeBaron (BDS) test (Broock et al., 1996). Lastly, the KRLS approach (Hainmueller & Hazlett, 2014) is performed to investigate AME and PME of ESR sub-types on ETI, respectively. The study uses Equation (1) to uncover the effects:
ETIit= a0+ a1ECESRit+ a2ENESRit+ a3GESRit+ a4RESRit+ εit
where ETI, ECESR, ENESR, GESR, and RESR denote energy transition index, economic ESR, environmental ESR, geopolitical ESR, and reliability ESR, respectively.
III. Empirical Outcomes
A. Preliminary statistics
ETI has a mean value of 77.76, ranging from 76.4 to 80.3. ESR sub-types have relative volatilities between 60.02 and 75.49. Among all sub-types, RESR has the highest mean and maximum values, followed by ENESR, GESR, and ECESR, in that order. Moreover, ECESR exhibits the highest volatility, followed by RESR, GESR, ENESR, and ETI, respectively. Furthermore, ETI has a non-normal distribution, whereas the ESR sub-types have normal distributions.
ETI exhibits medium- and low-level correlations with the ESR sub-types. Specifically, ETI has a medium-level negative correlation (-0.51) with ECESR. Similarly, there are medium-level negative correlations between ETI and both GESR (-0.40) and RESR (-0.30). On the other hand, there is a positive and low-level correlation between ETI and ENESR.
All variables are non-stationary at the level; however, all variables become stationary at first differences.
Table B in the appendix demonstrates the nonlinearity test outcomes. ETI displays a mixed condition across the dimensions. Similarly, both GESR and RESR have mixed conditions. However, both ECESR and ENESR exhibit a completely nonlinear structure.
B. AME Outcomes
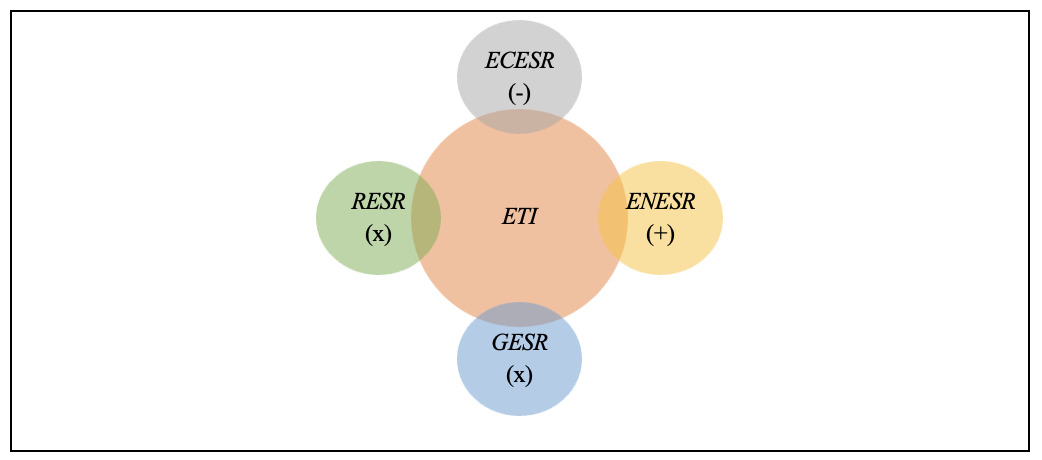
Table 1 shows the AME outcomes of ESR sub-types on ETI. ECESR has a statistically significant negative effect on ETI (p-value: 0.0020). Conversely, ENESR has a statistically significant positive effect on ETI (p-value: 0.0030). In contrast, both GESR (p-value: 0.2290) and RESR (p-value: 0.6920) have statistically insignificant effects on ETI. These outcomes suggest that increasing economic ESR reduces ETI, while increasing environmental ESR raises ETI. Therefore, U.S. policymakers can rely on ENESR to support improvements in ETI.
C. PME Outcomes
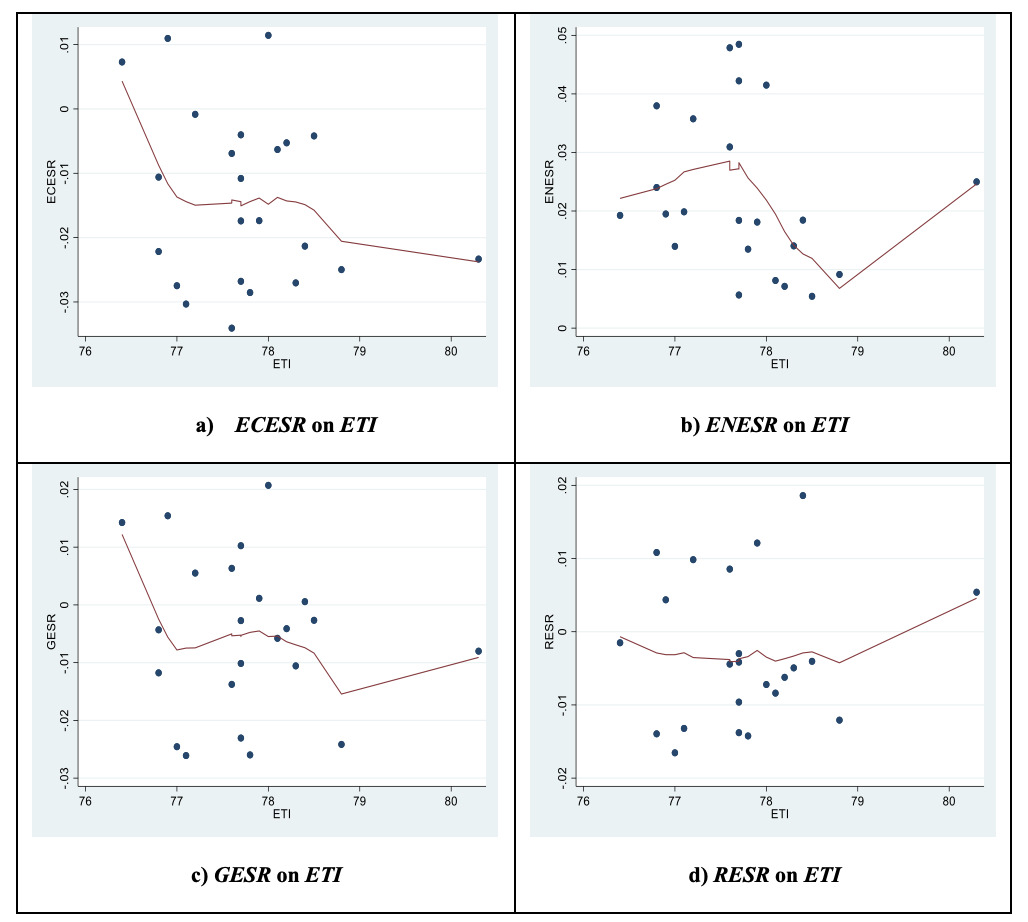
Figure 2 demonstrates the PME of ESR sub-types on ETI.

In Figure 2a, ECESR has a positive marginal effect on ETI at low levels, specifically when ETI is below 77. However, if this threshold is exceeded, ECESR has a completely negative marginal effect on ETI, and this negative effect becomes much stronger as ETI increases.
In Figure 2b, ENESR has a consistently positive marginal effect on ETI across all levels. Notably, the increasing marginal effect is much stronger when ETI is between 76 and 77.5. Once this threshold is surpassed, particularly between 77.5 and 80, the increasing effect of ENESR on ETI becomes much weaker. If ETI exceeds 80, the increasing effect of ENESR becomes stronger again.
In Figure 2c, GESR has a positive marginal effect on ETI at low ETI levels, up to approximately 77. However, GESR exhibits a completely negative marginal effect on ETI at higher levels. This negative effect intensifies when ETI is between 77 and 79, while the effect becomes slightly weaker when ETI exceeds 79.
In Figure 2d, RESR has a negative marginal effect on ETI at low ETI levels, specifically between 76 and 79.5. However, RESR has a positive marginal effect on ETI at higher levels, with the effect becoming much stronger when ETI exceeds 79.
Finally, Figure 3 provides a summary of these outcomes.
D. Policy Implications
Considering the results, U.S. policymakers should view rising environmental ESR as an opportunity to implement measures that expedite the energy transition. In this context, policymakers should continue supporting the shift from fossil fuels to renewable sources by promoting public awareness campaigns and providing financial subsidies to both companies and consumers. Additionally, enacting stricter policies (such as emissions limits, reduction targets, and emission trading systems) and pursuing long-term benefits from clean energy in response to environmental disasters (e.g., hurricanes) can further stimulate the energy transition by leveraging environmental ESR.
Furthermore, U.S. policymakers should aim to reduce economic ESR due to its negative impact on the energy transition. To address this, they should focus on decreasing investment volatility, maintaining stable energy prices to avoid adverse public reactions, securing supply chains and critical minerals through long-term purchasing agreements, and stabilizing policies to minimize policy instability. They should also recognize that ESR sub-types exhibit varying PME, which is crucial for formulating effective energy transition policies. Assuming that incremental increases will yield similar effects could lead to misguided policy decisions.
The findings suggest that both ESR and its sub-types should be considered in formulating the U.S. energy transition policy. Moreover, average and marginal incremental effects of ESR sub-types should be taken into account. This approach will help the U.S. develop a more robust energy transition policy. The outcomes are largely consistent with the current literature (e.g., Kartal, Taşkın, et al., 2024), while providing a unique perspective by considering ESR sub-types and their incremental effects.
IV. Conclusion
This study focuses on the USA, utilizes the most up-to-date data, and employs a KRLS approach. Accordingly, the study uncovers both the average marginal effect (AME) and the percentile marginal effect (PME) of ESR sub-types on ETI in addressing the research questions. In summary, it reveals both average and percentile-based variations in the marginal effects of ESR on ET.
While the study aims to provide a comprehensive analysis, it has some limitations. Since the study focuses on the USA, future research could examine other developed countries as well as developing countries with varying levels of ESR and ETI. Comparative studies between fossil-dependent and renewables-led states could also be considered. Additionally, as this study primarily addresses ESR sub-types, future research might explore other recent issues such as geopolitical risk, climate, and trade policy uncertainty. Furthermore, new studies could apply other novel econometric methods as well.
Acknowledgement
The second author would like to thank Prince Sultan University for their support.