I. Introduction
In this paper, we investigate the impact of tariff escalations between the US and China on their energy market volatility. Recently, the US and China have imposed a series of successive reciprocal tariffs. These reciprocal tariff impositions have influenced international markets, particularly energy markets, due to their high sensitivity to global macroeconomic shocks.
Existing literature shows that tariffs on energy-intensive goods can reduce energy demand, whereas retaliatory measures targeting energy commodities themselves may directly distort trade flows (Akadiri & Olasehinde-Williams, 2025). Moreover, financial markets often respond to tariff announcements with heightened uncertainty, amplifying volatility in the energy futures and derivatives markets (Jiao et al., 2024; Yang et al., 2024).
Prior research (Küçükçolak et al., 2024; Lu & Zhou, 2025) on event studies has documented that political and economic shocks often trigger sharp but short-lived shifts in energy prices and volatility. Event studies have also examined trade policy impacts on financial markets (Caporin et al., 2025; Jiao et al., 2024; Yang et al., 2024). While a growing literature has examined trade policy uncertainty effects on financial markets and some commodity sectors (Caporin et al., 2025; Lu & Zhou, 2025; Shang et al., 2025; Yang et al., 2024), fewer studies have conducted systematic bilateral comparisons of energy market responses to specific tariff events or documented the temporal evolution of anticipatory behavior during prolonged trade conflicts.
This study makes two important contributions. First, it shows that Chinese energy markets exhibit stronger anticipatory reactions and larger volatility shocks than US markets in response to tariff announcements, highlighting how trade conflicts affect markets asymmetrically. Second, it quantifies pre-event market reactions, revealing that anticipation of trade policy grew more sophisticated over time—most notably during the April 2025 “Peak Escalation,” when Chinese markets experienced extreme pre-event volatility of -6.12% three days before the announcement.
The remainder of this paper is organized as follows. Section II introduces the data and the event study method. The results are discussed in Section III. Section IV concludes the paper with the policy implications.
II. Data and method
A. Data
This study used daily data on the S&P 500 Energy Index and the CSI 300 Energy Index, collected from DataStream. The S&P 500 Energy Index tracks the performance of energy companies listed in the S&P 500, including major oil, gas, and renewable energy firms in the United States. The CSI 300 Energy Index focuses specifically on companies operating in China’s energy sector, including oil, gas, and power generation firms. These indices provide a comprehensive measure of investor sentiment and market expectations regarding the energy sectors in both countries, which are particularly sensitive to trade policy changes given the energy-intensive nature of manufacturing and the strategic importance of energy security in US-China relations.
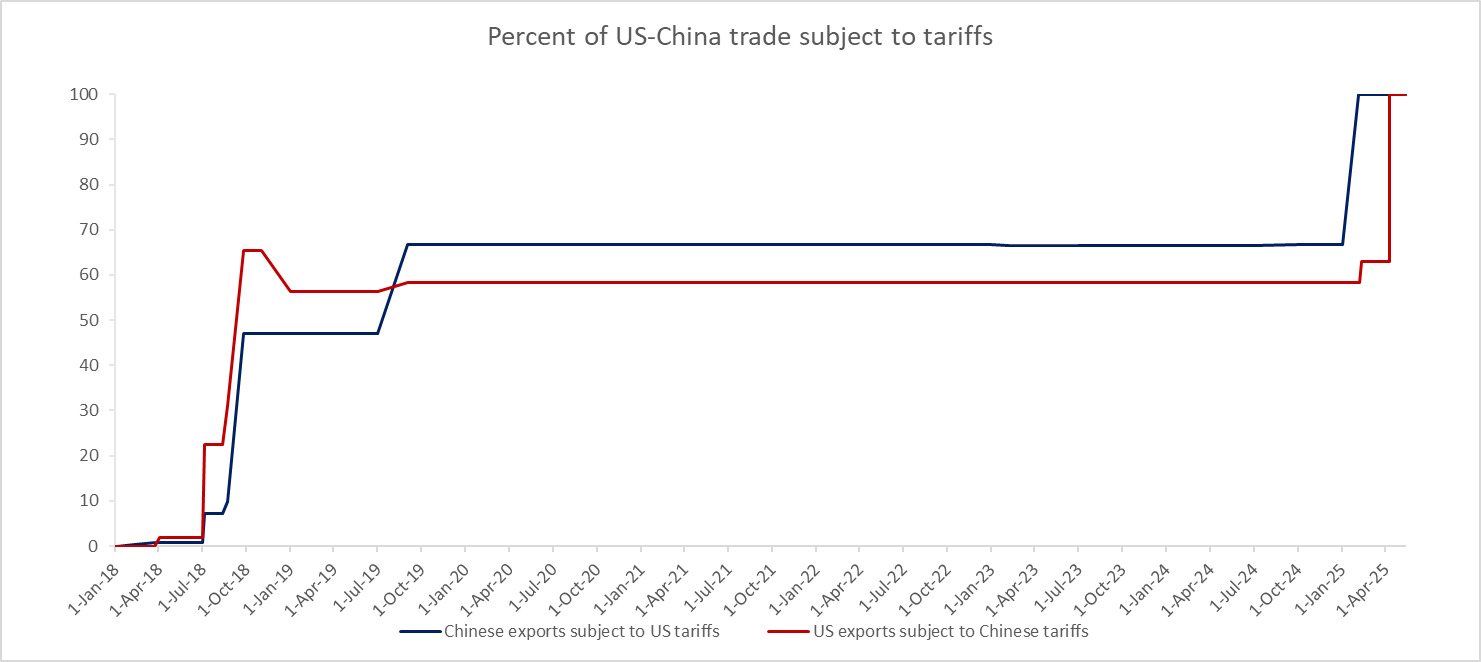
As illustrated in Figure 1, tariff rates increased substantially from pre-conflict levels, with both countries implementing retaliatory measures throughout the conflict period. These tariffs had far-reaching implications beyond directly affected industries, impacting energy demand forecasts, commodity prices, and investment decisions in the energy sector.
In this study, four important event announcements were examined to assess the impact of the US–China tariff escalation on the US and Chinese energy markets. These events represent critical turning points in the trade conflict, generating significant market reactions and shifting investor expectations about future economic conditions and energy demand in both economies.

The selected tariff events central to this study’s analysis unfolded as follows. On September 1, 2019, the United States implemented a 15% tariff on $112 billion worth of Chinese goods, to which China responded with retaliatory tariffs on $75 billion of U.S. goods. Later, on February 4, 2025, China imposed a 15% tariff on coal and liquefied natural gas (LNG), and a 10% tariff on crude oil, agricultural machinery, and automobiles, following the Trump administration’s announcement of a 10% tariff focused on fentanyl-related products. Subsequently, on February 10, 2025, the U.S. increased its tariffs to 20%, prompting China to introduce broader tariffs on agricultural products on March 10. The escalation peaked on April 10, 2025, when the U.S. raised tariffs to 145%, while China imposed tariffs of 125%, marking an intense phase in the trade conflict.
Events were selected based on their bilateral nature, impact on both US and Chinese trade, significant economic magnitude, and direct or indirect relevance to the energy sector. Additionally, the announcement dates were chosen for their specificity and minimal overlap with other confounding events. The event dates were sourced from the USTR website (https://ustr.gov/about-us/policy-offices/press-office/-ustr-archives).
B. Methodology
To examine the effects of the US-China tariff escalation on energy market volatility, this study used the event study method proposed by Fama et al. (1969). MacKinlay (1997) suggested that this approach is appropriate for daily data spanning 120 days prior to the event for activity analysis. Therefore, this study used an estimation window of [–120, –30]. This window provides 90 trading days of data for robust parameter estimation while maintaining a 30-day buffer to prevent contamination from anticipatory trading effects that commonly precede trade policy announcements in forward-looking energy markets.
A short event window is often employed to mitigate the impact of irrelevant information on stock prices (Küçükçolak et al., 2024). As energy markets are among the most liquid and informationally efficient global markets, with continuous 24-hour trading across multiple exchanges, the [–5, +5] window captures the rapid price discovery process while allowing for initial overreactions and subsequent corrections that typically occur within this timeframe. Therefore, an event window spanning the range of [–5, +5] was used in this study.
The purpose of an event study is to calculate the abnormal volatility (AV) and cumulative abnormal volatility (CAV) on the days preceding and following an event date. Energy stock and market returns are calculated using the following formulas:
for i-th energy stock’s return
for market returns
where represents the daily closing price.
This study uses squared returns as a measure of volatility because (1) they allow for a clear separation between the estimation window [−120, −30] and the event window [−5, +5] without contamination, whereas GARCH models require continuous data, and (2) they provide a standardized metric for comparing the U.S. - China energy markets, unlike market-specific GARCH models.
Step 1: Volatility of each stock (i), each market return (m), and each day t:
V(i,t)=r2(i,t)
V(m,t)=r2(m,t)
Step 2: Expected volatility:
E(V(i,t))=ˆαi+ˆβi×V(i,t)
where and are obtained from the OLS model using the estimation window of [-120, -30].
Step 3: Abnormal volatility (AV) calculation:
For each stock i and each day t
AV(i,t)=V(i,t)−E(V(i,t))
Average abnormal volatility, with equal weights for i stocks
AAVt, weight=1NN∑i=1(wi×AVit)
Step 4: Cumulative abnormal volatility (CAV) calculation:
CAVt=N∑t=1AAV
A cross-sectional t-test was used to examine whether the mean cumulative abnormal volatility (CAV) across all constituent stocks in each energy index is significantly different from zero during the event window. The test statistic formula is
t=CAV(σCAV/√N)
III. Empirical results
Table 1 shows abnormal volatility in the US and Chinese markets during the events. Event one in September 2019 demonstrates classic market uncertainty, where traders initially might have interpreted the 15% tariff rate as manageable before recognizing the implications for global energy demand, resulting in -2.34% abnormal volatility. Event two marked a qualitative shift, with immediate negative reactions indicating that by February 2025, markets had developed more sophisticated frameworks for rapidly assessing trade policy implications.
Event four in April 2025 stands out as the most severe market disruption, with its distinctive pre-event movement reaching a low of -4.21% three days prior to the announcement. This anticipatory decline suggests either information leakage or that markets had become sufficiently attuned to political developments to predict major escalations, representing a fundamental change in how energy markets process trade policy risk. The sustained negative sentiment throughout the event window, closing at -2.94%, indicates that markets viewed this escalation as crossing a threshold with lasting implications. The progression from reactive to anticipatory market behavior across these four events illustrates how trade policy uncertainty evolved from an episodic concern to a systematic risk factor in energy markets.
Chinese energy markets consistently showed more pronounced reactions to trade tensions, revealing the asymmetric impact of bilateral trade conflicts on domestic energy markets. The magnitude differential is striking across all events: Chinese markets ended 43% lower during the event one tariffs (-3.34% vs -2.34%), reached devastating lows of -4.23% during the event two tariffs compared to -2.71% in US markets, and showed extreme pre-event volatility of -6.12% during peak escalation. This pattern reflects China’s greater structural vulnerability to trade disruptions, given its export-dependent economy and manufacturing base, where energy demand is more directly tied to industrial production that trade wars threaten to disrupt.
During event three, Chinese energy markets reacted negatively (-3.89%) to their own government’s retaliatory measures, showing that escalation damages economic prospects regardless of which side initiates it. This counterintuitive response suggests Chinese investors understood that retaliation would entrench uncertainty rather than resolve disputes. The heightened anticipatory effects indicate either superior information processing about impending US policy changes or greater sensitivity to political signals that precede formal announcements. These patterns collectively illustrate how domestic markets bear disproportionate adjustment costs during international trade conflicts, as local investors cannot easily diversify away from country-specific policy risks.
Table 2 presents whether the cumulative abnormal volatility of the US and Chinese energy markets is significantly different from zero, as determined by t-statistics. While the initial List 4A tariffs event shows a modest pre-event move of -0.42% at the overall event effect is statistically significant (t-stat = -2.41, p = 0.042), indicating that the cumulative [-5, +5] window captures meaningful abnormal volatility beyond random market noise. In the US, volatility increased sharply around major tariff events, with significant effects during the February 2025 tariffs and the peak escalation in April 2025. The statistically significant negative means of abnormal volatility in these windows show that oil prices became markedly more unstable relative to normal periods, reflecting heightened uncertainty over global trade and energy demand. Even retaliation by China in February 2025, though somewhat anticipated, led to elevated volatility, underlining that US oil markets remained sensitive to every stage of the tariff war.
To the contrary, each tariff escalation produced larger negative abnormal volatility in Chinese energy markets than in the US. This indicates that China’s energy markets were more vulnerable to trade disruptions. Event four demonstrates the strongest statistical significance (p = 0.003 for USA, p = 0.001 for China), supporting the interpretation of the -18.95% and -33.93% final CAV values as economically meaningful rather than statistical noise. These findings suggest that while US markets reacted strongly, Chinese markets bore the heaviest burden, consistent with their deeper integration into global supply chains and reliance on energy imports. Overall, the results demonstrate the destabilizing nature of tariffs on oil markets and their asymmetric impact on the Chinese market. All events show significance at a minimum 10% level, with events two and four reaching 1% significance. The high p-values of the Shapiro-Wilk tests suggest no significant departure from normality in the data used for the analysis.
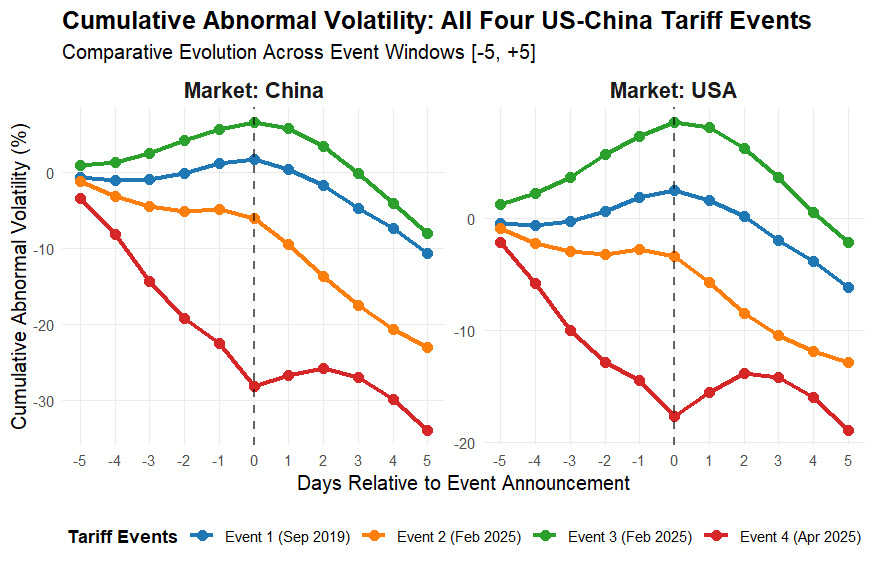
Figure 2 reveals that trade tensions escalated dramatically from modest 2019 effects to severe 2025 impacts (-34% China, -19% USA). Chinese energy markets consistently suffered roughly double the volatility of US markets, and both markets developed strong anticipatory behavior by 2025, declining significantly before official announcements.

IV. Conclusion
This study examines the impact of the US–China tariff escalation on energy market volatility using an event study framework. The results reveal that tariff announcements significantly increased cumulative abnormal volatility in both markets, with Chinese energy markets experiencing stronger anticipatory reactions, larger shocks, and more persistent instability. The findings demonstrate an asymmetric effect, reflecting China’s higher vulnerability due to its export-dependent economy and reliance on energy-intensive manufacturing.
The results have several important policy implications. For Chinese energy companies, these include implementing volatility collar strategies using WTI/Brent options and reducing US energy import dependence below 15% within 24 months. For US policymakers, we recommend 48-hour advance industry notification protocols and clear energy sector exemption criteria, directly addressing the 3–5-day anticipatory market reactions documented in this study.