
I. Introduction
The extensive use of fossil fuels has contributed to environmental degradation. To mitigate the adverse effects of climate risk, a global transition to green energy sources is essential. However, the interconnectedness of energy markets remains complex. The relationship between clean and dirty energy markets is influenced by various external factors, with climate risks emerging as a key determinant of the structure and interdependence of energy financial markets (Cifuentes-Faura et al., 2024; Lorente et al., 2023). The climate finance literature emphasizes the importance of distinguishing between physical and transition risks due to their differing impacts on financial markets (Bua et al., 2024; Engle et al., 2020; Faccini et al., 2023; Giglio et al., 2021). According to the Task Force on Climate-related Financial Disclosures, physical climate risk arises from acute extreme weather events, whereas transition risk stems from the shift toward a low-carbon economy, driven by regulatory, technological, and market changes, or evolving public preferences (Breitenstein et al., 2022; TCFD, 2017). We can therefore distinguish the different impacts of these components on the returns of major energy markets, as well as examine their interrelationships, offering more precise and detailed strategic insights for policymakers and stakeholders involved in climate risk management. However, the asymmetric impact of climate risks on spillovers among energy markets has rarely been addressed in existing literature. Understanding this relationship can help market participants optimize risk management and investment decisions, supports market stability and supply chain resilience, and enables policymakers to design and implement effective response and mitigation strategies.
This paper investigates the spillover effects of climate risk components on clean and dirty energy markets using a TVP-VAR-based connectedness approach. The main contribution lies in providing a more comprehensive understanding of the effects of physical and transition risks across different energy markets. We propose a novel framework to uncover the asymmetric impacts of climate risk components on energy markets, distinguishing between external and internal spillover effects among clean and dirty energy sectors. In addition, we incorporate both the physical risk index (PRI) and transition risk index (TRI). The relationship between climate change and the energy system has attracted considerable attention in recent years. This study offers insights that can assist policymakers and investors in making more informed decisions regarding risk management, portfolio diversification, and climate adaptation.
The remainder of this paper is structured as follows: Section II describes the data and outlines the methodology; Section III presents and discusses the results; and Section IV concludes the paper.
II. Data and Methodology
A. Data
Five representative markets from both the clean and dirty energy sectors, along with the climate risk index, decomposed into two sub-indices, namely PRI and TRI are selected for analysis. Table 1 provides a detailed description of the variables, which were collected from the DataStream and the economic policy uncertainty website, covering the period from January 2, 2014, to December 28, 2023[1]. The daily return for market at time is calculated as follows:
Ri,t=lnPi,tPi,t−1 ×100
where is the price of market at time
B. Methodology
We assess the interconnections between climate risk components and energy indices using the TVP-VAR-based connectedness approach of Antonakakis et al. (2020), employing a lag length of one (selected via BIC), a 10-day forecast horizon, and a 100-day rolling window. This method is effective with smaller sample sizes. The total connectedness index is defined as follows:
TCI (H)=∑Ni,j=1,i≠j˜∅ij,t(H)∑Ni,j=1˜∅i,j(H)×100
Additionally, the directional connectedness measures are derived from two aspects: and as illustrated below:
DCTO→i,(H)=∑Nj=1,i≠j˜∅i,j(H)∑Ni,j=1,i≠j˜∅i,j(H)×100
where represents the time-varying impulse response of all other markets to shocks originating from market
DCFROM←,i(H)=∑Nj=1,i≠j˜∅i,j(H)∑Ni,j=1,i≠j˜∅i,j(H)×100
where represents the time-varying impulse response of markets to shocks originating from all other market The Net Directional Connectedness from market to all other markets is defined as:
NETij=DCTO→i,(H)− DCFROM←,i(H)
III. Empirical Findings
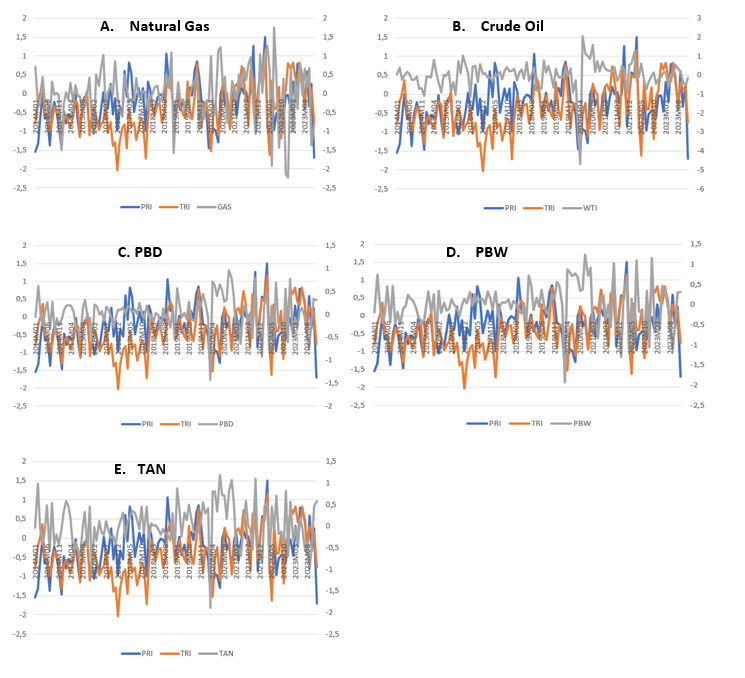
Figure 1 illustrates the evolution of returns for both clean (PBD, PBW, TAN) and dirty (Natural Gas, Crude Oil) energy indices, alongside climate risk components (PRI and TRI). Both PRI and TRI exhibit frequent fluctuations, reflecting persistent climate-related uncertainties. Gas and WTI exhibit higher volatility compared to clean energy indices. While clean energy returns tend to be more stable, they still respond to changes in climate risks, particularly TRI. The visual patterns suggest a clear link between shifts in climate risk and energy market performance, with dirty energy appearing more sensitive to these risks. This highlights the interconnectedness between climate risk and the dynamics of both clean and dirty energy sectors.
.png)
Table 2 presents descriptive statistics for the climate risk components and dirty and clean energy indices. All indices exhibit negative average returns, except for PBD and TAN. The highest return variability is observed for WTI, followed by GAS, TAN, and PBW.
Table 3 presents the connectedness between the climate risk components and energy indices, reporting a system-wide connectedness of 34.56%. The main contributors to spillovers across financial variables are the clean energy market ETFs (PBW 66.16%; PBD 62.51%; and TAN 59.88%). These results indicate that clean energy markets act as the main transmitters of shocks, while the GAS index is a net recipient, contributing on average approximately 3.98%. This finding highlights the significant role of clean energy markets in driving market risk. The average net total directional spillover indicates that PBW, TAN, and PBD are the main net transmitters of spillovers at 6.72%, 4.11%, and 2.45%, respectively, suggesting that these assets are key drivers of the market. In contrast, TRI, PRI, GAS, and WTI are identified as net recipients. The strong connectedness among PBW, TAN, and PBD suggests a high degree of co-movement and potential interdependence within the clean energy sector. This finding aligns with Ozkan et al. (2024), who show that clean energy market ETFs are net transmitters of shocks. GAS, as a net recipient of shocks, exhibits lower contagion risk, highlighting its potential for effective diversification within energy portfolios. Consistent with Belkhir et al. (2025), WTI and GAS primarily receive shocks, display higher volatility, and therefore require careful consideration in portfolio management.
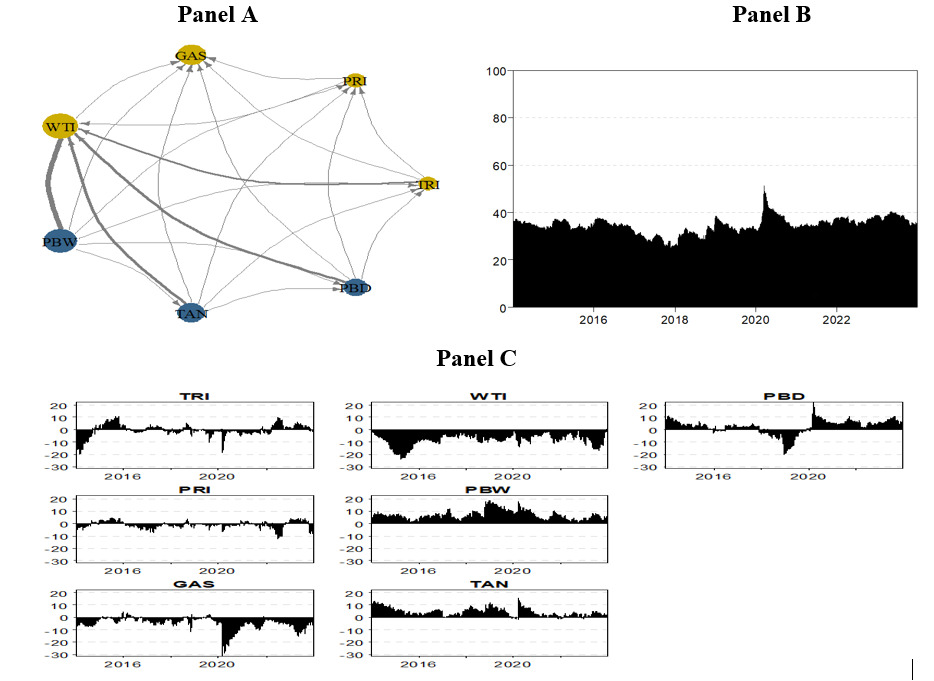
We confirm the findings from the static connectedness analysis through the network connectedness presented in Figure 2 (Panel A). The colors of the nodes indicate the nature of their connectedness, with blue representing net transmitters of shocks and yellow representing net recipients. Specifically, GAS, WTI, PRI, and TRI act as net recipients of shocks, while the remaining variables function as net transmitters. The size of the nodes further emphasizes the prominent roles of PBW and TAN in shock transmission, whereas GAS and WTI demonstrate a strong capacity for shock absorption.
__total_connectedness_index_(panel_b)__and_total_ne.png)
Figure 2 (Panel B) illustrates the system-wide connectedness between the climate risk components and clean and dirty energy markets. The dynamic connectedness indicates that spillovers are sensitive to crisis periods and exhibit time-varying behavior, with significant spikes corresponding periods of economic stress. In particular, the spike in the graph marks the onset of the COVID-19 pandemic, which resulted in higher connectedness among the energy markets. Consistent with the findings of Lin & Su (2021), our results show that the COVID-19 pandemic has intensified the connectedness among energy markets. In addition, Figure 2 (Panel C) depicts the total net connectedness of the climate risk components and energy markets, reaffirming the findings reported in Table 3. As shown in Figure 2 (Panel C), PBW and TAN are the net contributors of spillovers among the markets. This result highlights the role of clean energy market ETFs in driving market risk (Yousfi & Bouzgarrou, 2024). In contrast, GAS and WTI are the net receivers of spillovers, meaning they predominantly absorb shocks from other indices rather than transmit them (Salem & Jeribi, 2025). Notably, PRI and TRI show a fluctuating pattern, alternating between being net receivers and net transmitters. This observation aligns with Aharon et al. (2025), who assert that the influence of climate change policy uncertainty has weakened and it has even become a net recipient of shocks. This shifting behavior for PRI and TRI suggests a dynamic role in the network, potentially responding to market fluctuations and external shocks differently from other indices. In summary, both the static and time-varying connectedness analyses underscore the significance of interlinkages between climate risk components and energy sectors. These findings are consistent with Salisu et al. (2023), who demonstrated that climate risk plays a significant role in shaping the dynamics of crude oil and natural gas markets. However, the net connectedness analysis indicates a weak contribution from WTI and GAS within the connectedness network. This suggests that these assets may serve as alternative investments and effective tools for portfolio diversification to mitigate losses across sectors. Additionally, green energy sectors emerge as net shock transmitters, consistent with previous studies (Lin & Zhang, 2025; Naifar, 2025).
IV. Conclusion
This study examines the connectedness between climate risk components (physical and transition), dirty energy (Crude Oil, Natural Gas), and clean energy ETFs (PBW, PBD, TAN) from 2014 to 2023 using a time-varying parameter vector autoregression (TVP-VAR) model. The results indicate that connectedness between energy indices and climate risk intensifies during the COVID-19 pandemic. Clean energy ETFs (PBW, PBD, TAN) act as net transmitters of spillovers, whereas GAS and WTI are net recipients, highlighting their potential for portfolio diversification. Both the PRI and TRI are net receivers of shocks, suggesting that climate risk is primarily driven by developments in the energy sector, such as price volatility or policy changes. These findings suggest that clean energy can serve as an effective alternative investment. For policymakers, promoting clean energy adoption supports sustainability and market stability. Future research could consider a broader range of green assets to assess diversification, hedge ratios, and hedging effectiveness.
Acknowledgements
The authors acknowledge the editor and reviewers for their comments.
This period is determined by the availability of climate risk data.