
I. Introduction
The rivalry between the United States and China has become one of the most influential forces shaping the contemporary global economy. Following China’s economic reforms in 1978, rapid growth in trade and manufacturing enabled the country to surpass Germany in 2009 and Japan in 2010, making it the world’s second-largest economy (Park, 2020). This ascent strengthened China’s role in global economic trends, particularly after the 2008 Global Financial Crisis. Over time, what began as cooperation gradually shifted toward competition and tension. A turning point arrived in 2018, when the US, under President Donald Trump, imposed a 25% tariff on $34 billion in Chinese goods to reduce its trade deficit. China responded immediately with retaliatory tariffs on US agricultural and industrial exports (Kim, 2019). These actions disrupted global value chains, weakened manufacturing activity, and strained international trade relations, illustrating how political friction can undermine the economic gains of globalization and heighten market uncertainty (Tam, 2018). From a theoretical perspective, political conflict and trade frictions can distort market expectations, reduce cooperation, and amplify uncertainty, with effects that extend beyond bilateral trade flows (Zeng et al., 2022[1]).
Given that China and the US are the world’s largest oil consumers—and that the US is also a major producer—their tense relationship can translate quickly into volatility in the global crude oil market. The trade war curtailed China’s manufacturing activity and oil demand, thereby intensifying oversupply conditions. Through this demand channel, the imbalance increased oil price fluctuations, providing a clear mechanism through which trade-related geopolitical tensions affect energy market volatility (Caporin et al., 2025; Chen et al., 2016).
Our research contributes to the existing literature in two ways. While previous studies have primarily examined the effects of oil shocks, financial crises, or climate-related risks on energy markets (see Bakas & Triantafyllou, 2020; Salisu & Isah, 2017), our study extends this body of work by focusing on US-China trade tensions (UCT) as a persistent and distinct source of geopolitical uncertainty affecting both futures and spot crude oil prices. Second, we introduce an out-of-sample forecasting framework to assess the robustness and practical value of UCT beyond the estimation sample. This approach strengthens the empirical credibility of the results and enhances their relevance for policymakers, traders, and investors by improving forecasts of oil price volatility. Finally, we evaluate forecast gains in an economic sense by providing new evidence on the benefits of incorporating US-China trade tensions into oil market investment decisions.
The remainder of the paper is organized as follows. Section II discusses the data and methodology, followed by a discussion of the results in Section III. The final section provides concluding remarks.
II. Data and Methodology
This paper explores the relationship between UCT and two crude oil prices: Brent and West Texas Intermediate (WTI). We use realized volatility for spot and futures oil prices.[2] The US-China Tension Index, developed by Rogers et al. (2024), serves as our primary measure of trade tensions.[3] It assesses tensions by measuring the frequency of relevant mentions in major US newspapers, focusing on contentious issues and tension-related language.[4]
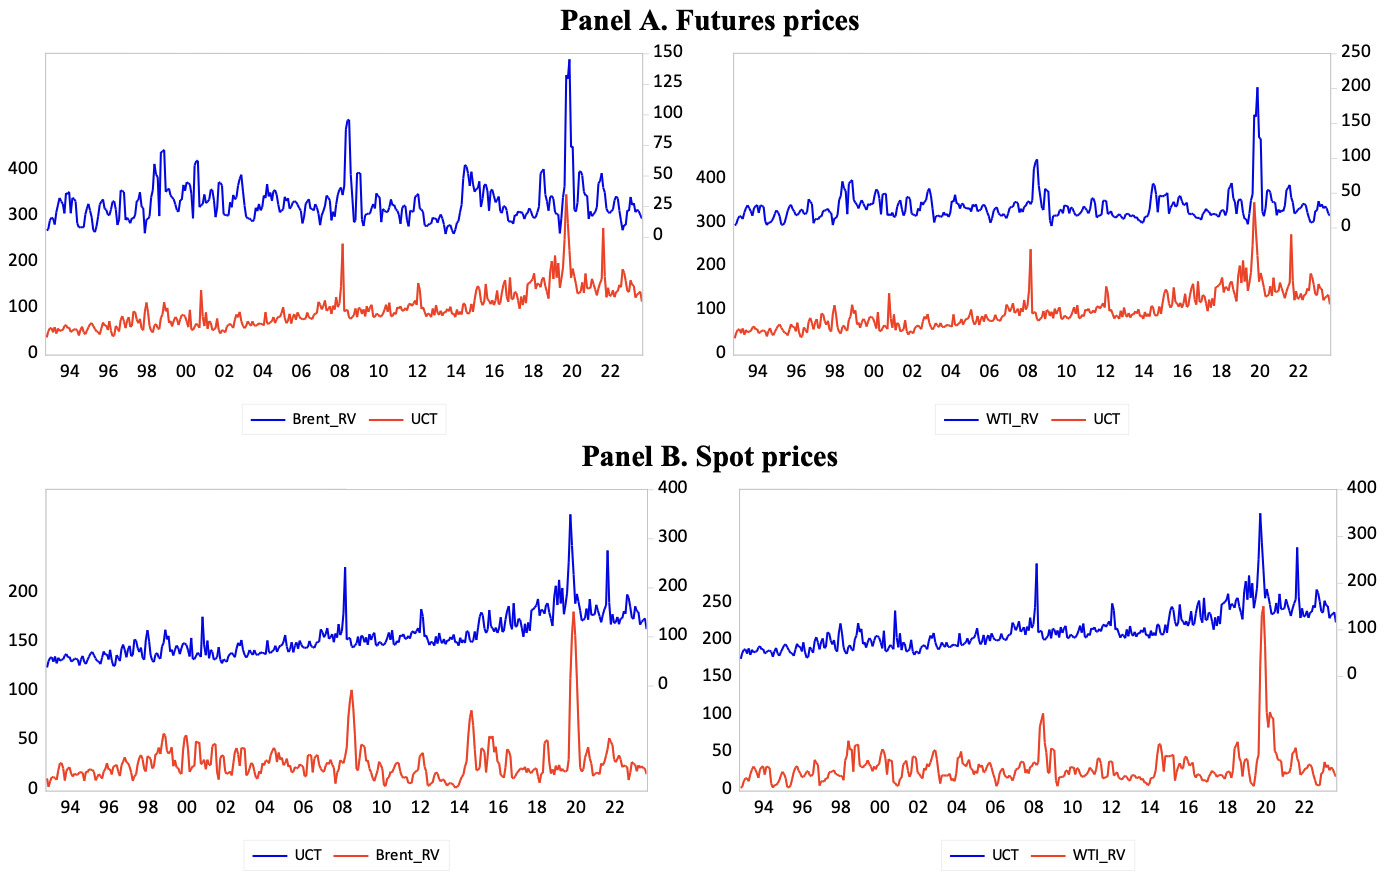
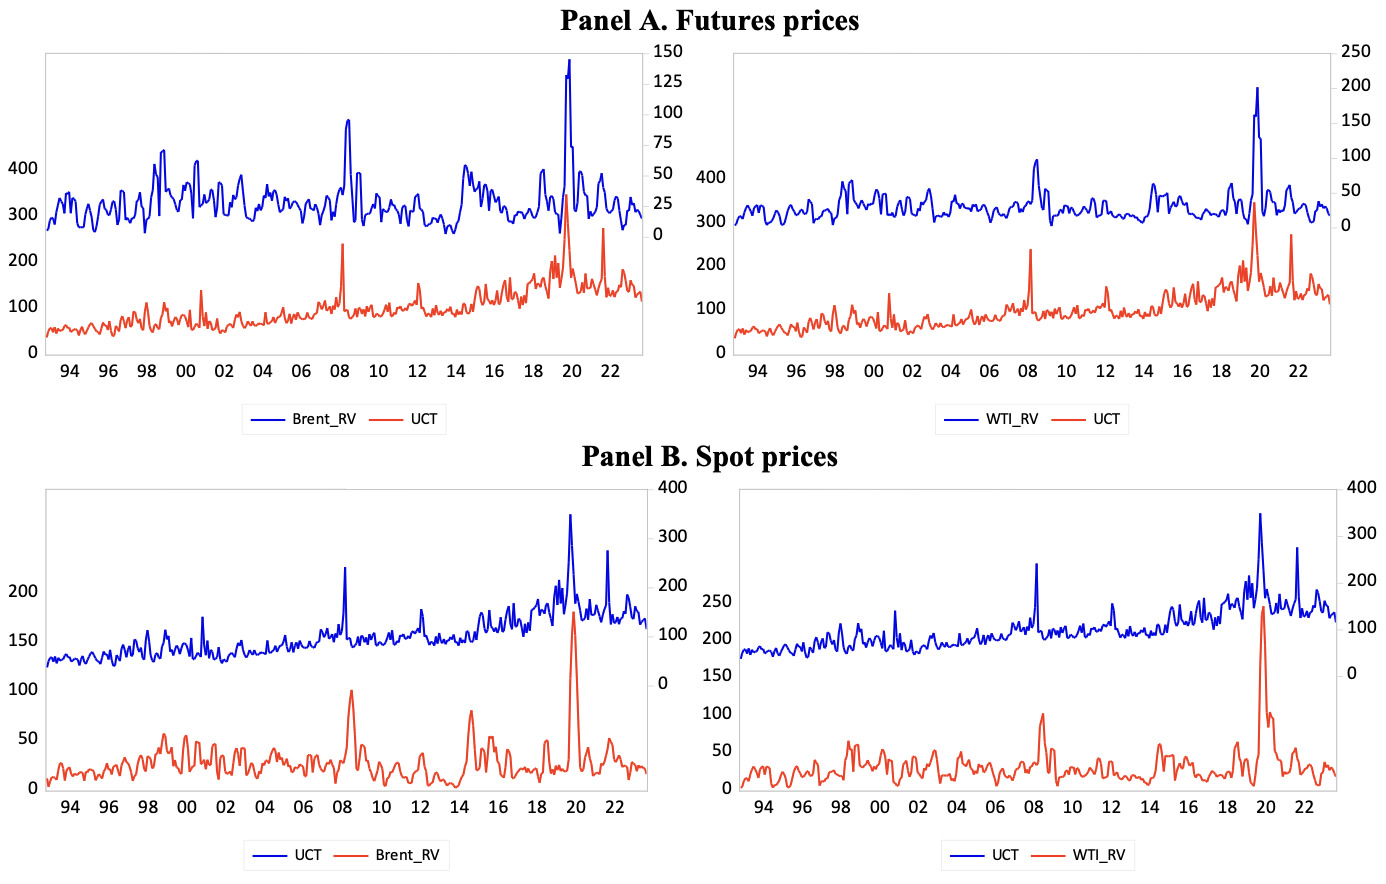
Figure 1 illustrates the relationship between crude oil volatility (Brent and WTI) and US-China tensions. The data show that volatility in both benchmarks co-moves with shifts in US-China relations, particularly after 2018. This pattern suggests that rising tensions heighten uncertainty in oil markets, underscoring their sensitivity to political events that can affect energy consumption and investment.
The growing intensity of trade tensions between the United States and China has raised concerns about their implications for global energy stability. Such developments can reshape oil market dynamics, influencing not only price levels but also volatility patterns that drive investor sentiment and risk perceptions. Motivated by these considerations, this study empirically assesses the predictive effects of trade and geopolitical uncertainty on crude oil realized volatility.
To further extend the analysis, we adopt the predictive volatility framework of Westerlund and Narayan (2015, 2012). Consistent with evidence that uncertainty is transmitted through volatility channels, the model is expressed as:
Volt=α+ρVolt−1+β1UCTRt−1+β2ΔUCTt+δ1GPRt−1+δ2ΔGPRt+μt
Here, represents realized volatility for Brent or WTI crude oil prices at time measures the lagged effect of the US-China tension on oil market volatility, while is used to correct the predictor’s inherent endogeneity bias. The key parameter of interest is which indicates whether the uncertainty variable predicts future volatility. To control broader sources of uncertainty, we also incorporate global geopolitical risk (GPR). GPR captures geopolitical shocks—such as the Russia-Ukraine war and tensions in the Middle East—that can influence global crude oil price dynamics. Importantly, UCT and GPR capture different dimensions of uncertainty. As shown in Panel A in Table 1, the correlation between the two measures is very low, indicating that multicollinearity is not a concern in our analysis.
Our empirical design combines in-sample and out-of-sample analyses. In-sample estimation assesses whether lagged trade uncertainty significantly predicts volatility within the estimation window. We then turn to an out-of-sample evaluation, which examines forecasting performance relative to a benchmark Random Walk model. Forecast accuracy is measured using the Root Mean Squared Error (RMSE), and the Clark and West (2007) test is used to determine whether the uncertainty-based models significantly outperform the benchmark.
To ensure robustness, we split the dataset into 80% for in-sample analysis and 20% for out-of-sample evaluation. Forecasts are generated over 3-, 6-, and 12-month horizons.[5] A lower RMSE relative to the benchmark, together with a positive and statistically significant Clark and West statistic, indicates superior predictive performance and confirms the economic relevance of US-China trade tensions in shaping oil market behaviour.
III. Main Finding
Table 1 shows that realized volatility is highly persistent for both Brent and WTI, which is typical of energy markets. Lagged volatility is significant across all specifications, with WTI exhibiting slightly greater persistence, likely reflecting stronger domestic influences.
Both Brent and WTI respond positively to US-China trade tensions (UCT), but their responses differ across spot and futures markets. For Brent, the spot market is more volatile than the futures market, whereas for WTI the futures market exhibits greater volatility than the spot market. Taken together, these results suggest that trade tensions may depress WTI demand and trading activity, reducing spot-market volatility, while Brent is more exposed to global trade disruptions that translate into higher volatility.
Both oil benchmarks also respond significantly to global geopolitical risk (GPR), with Brent showing a stronger response. This is consistent with the global nature of oil markets. Brent is more affected by GPR because it prices about two-thirds of the world’s oil, whereas WTI primarily serves as the US pricing benchmark.
Out-of-sample results further confirm the value of the UCT-based model. Relative RMSE and Clark and West (2007) statistics indicate that specifications incorporating UCT outperform the Random Walk benchmark. Overall, including UCT improves forecast accuracy by capturing trade-related uncertainty that directly affects oil demand and pricing behaviour. This forecast improvement is particularly relevant for investment and policy decisions that depend on reliable measures of market risk.
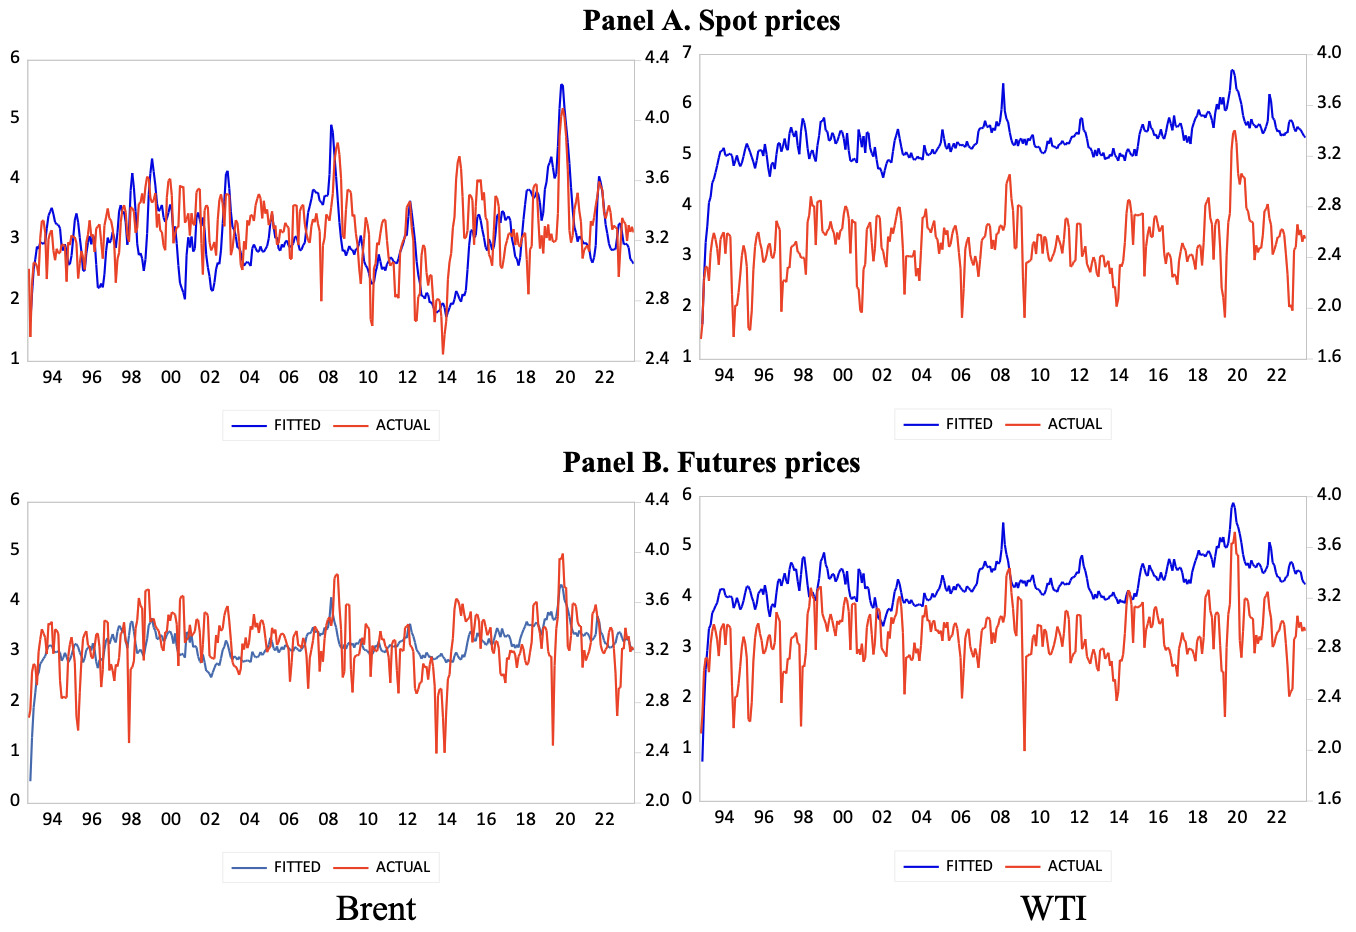
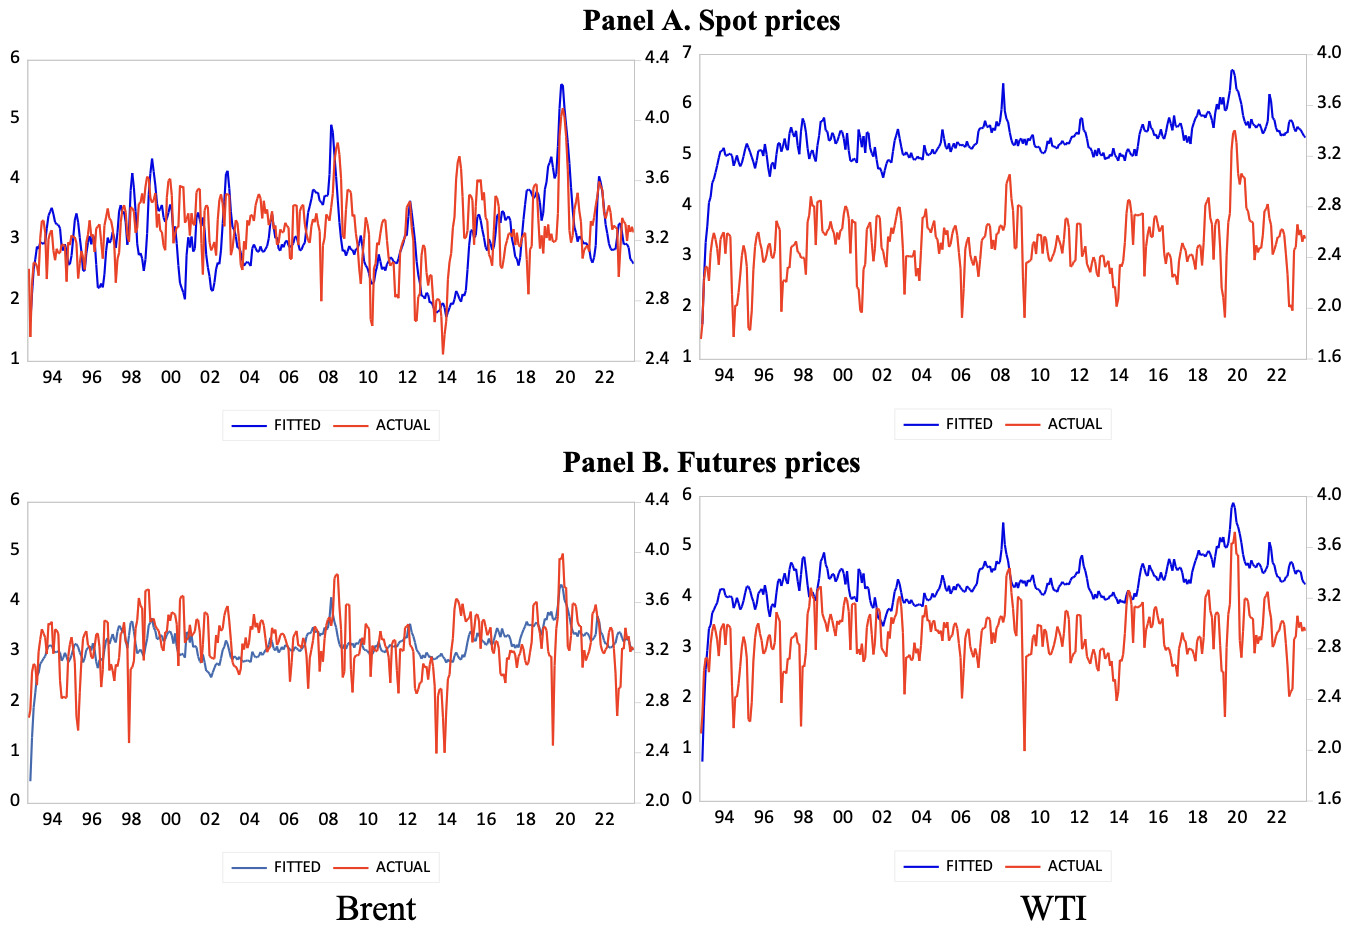
We conduct a supplementary analysis to assess the economic significance of the out-of-sample forecasts, beyond statistical performance. The exercise proceeds in two steps. First, we compute Sharpe ratios for Brent and WTI in both spot and futures markets under the UCT-based and benchmark models. The Sharpe ratio is obtained as where denotes the expected oil returns derived from the predictive models; is the risk-free asset and is the variance of oil returns. The computed Sharpe ratios are reported in the appendix (see Table A). A higher Sharpe ratio indicates better excess returns per unit of risk, providing greater economic value for investors.[6] Second, we compute the utility gains reported in Table 2 as the difference between the Sharpe ratio from the UCT-based model and that from the Random Walk benchmark. A positive value indicates that incorporating trade tensions increases utility, whereas a negative value implies the benchmark performs better.
The positive utility values across the oil price proxies indicate that the UCT-based models outperform the benchmark in both spot and futures markets. Moreover, adding geopolitical risk (GPR) further increases utility gains, especially in the spot market. This underscores the role of geopolitical uncertainty in explaining oil price dynamics. The improvements are more pronounced for WTI than for Brent, highlighting WTI’s greater sensitivity to US-centered risks.
IV. Conclusion
Our study examines the interplay between US-China trade tensions and crude oil market volatility across spot and futures markets. We find that trade-related uncertainty (UCT) heightens volatility, with WTI being more sensitive than Brent, consistent with its stronger linkage to the US market. To account for broader sources of global uncertainty, we also include the geopolitical risk index (GPR) as a control variable. While both spot and futures markets respond to UCT, the two benchmarks exhibit distinct dynamics: Brent shows higher spot-market volatility, whereas WTI displays stronger volatility in futures markets, reflecting differences in market structure and exposure to trade-related shocks. Moreover, our out-of-sample results indicate that incorporating UCT improves Sharpe ratios and enhances investor utility for WTI, leading to better risk-adjusted portfolio performance. Overall, these findings suggest that investors and policymakers should monitor UCT as an early-warning signal for potential market stress and use it to inform interventions aimed at stabilising energy markets. Despite these contributions, the paper relies on a single measure of US-China tension and focuses on two major oil benchmarks (Brent and WTI). Future research could address these limitations by considering alternative or composite measures of trade tensions, adding other oil benchmarks, and examining spillovers across broader energy and financial markets.