
I. Introduction
Financial technology (FinTech) has emerged as a transformative force influencing the consumption dynamics of both fossil fuel-based and renewable energy sources. It has significantly contributed to the advancement of green energy by fostering the development of innovative digital solutions, facilitating easier access to financing for environmentally responsible enterprises, and accelerating the global shift towards non-fossil energy alternatives (Croutzet & Dabbous, 2021). However, the high energy demands of FinTech applications raise concerns regarding the adverse effects of digital waste and the rising usage of fossil-based energy, regardless of its contribution to economic progress (de Vries, 2018; Tao et al., 2022), thereby impacting both economic and environmental aspects (Rahman et al., 2024). On one hand, FinTech drives economic growth (Deng et al., 2019) by promoting financial inclusion, enhancing the efficiency of payment systems, expanding access to credit, and empowering entrepreneurship, ultimately contributing to job creation and business scalability.
This nexus between FinTech and economic advancement aligns with Schumpeter’s theory of creative destruction, which emphasises innovation-driven economic transformation (Cevik, 2024). However, the rapid proliferation of FinTech may intensify existing environmental challenges by escalating energy usage and carbon emissions, particularly through energy-intensive digital infrastructures (Ma et al., 2023). This study investigates the complex interplay between FinTech development, aggregate energy consumption, and key environmental indicators within the context of G-20 economies.
Our study contributes to the existing literature mainly in three ways. First, it employs a comprehensive approach to assessing environmental quality by incorporating three key indicators: carbon emissions (CO2), the ecological footprint (EFP), and the load capacity factor (LCF). Unlike CO2 emissions, which primarily measure atmospheric pollution, EFP provides a more holistic assessment by accounting for environmental degradation related to water and soil (Dam et al., 2024). Meanwhile, LCF offers a dual perspective by integrating both the demand and supply aspects of ecological sustainability through ecological footprint and biocapacity (Siche et al., 2010). Second, to the best of the authors’ knowledge, research is yet to be conducted considering G-20 countries—a group of nations that have a substantial influence on global energy consumption and environmental trends.
Our research focuses on G-20 nations because the G-20 is a global summit generating over 80% of the world’s GDP and represents almost 95% of investment in R&D and about 90% of all research work on artificial intelligence. Establishing a digital economy has received special attention from the G-20 countries. Finally, using Panel VAR Impulse Response Analysis, the study examines the effects of FinTech, fossil fuel energy consumption (FSFC), non-fossil fuel energy consumption (NFSFC), and economic growth on environmental sustainability, while also assessing their interrelationships. This has helped to expand the contribution of our study and provides policymakers with an in-depth analysis of broad patterns.
The remaining paper is organised as follows: Section II covers the data sources and methodology of the study; Section III focuses on the analysis of results; and Section IV presents the conclusion and policy implications.
II. Methodology and Data
A. Data
The dataset used for the present research comprises panel data and utilises a secondary data sample covering annual data from 2005 to 2022 for G-20 nations, excluding the European Union due to data unavailability. Our study considers Carbon Emissions (CO2), Ecological Footprint (EFP), and Load Capacity Factor (LCF) as the dependent variables, proxied by CO2 emissions (metric tons per capita), Ecological Footprint (Gha per person), and Biological Capacity/Ecological Footprint (Gha per person), respectively. FinTech, Fossil Fuel Energy Consumption, Non-Fossil Fuel Energy Consumption, and GDP Per Capita (constant 2015 US$) were taken as independent variables. All data relevant to the study were extracted from the World Development Indicators, Global Footprint Network, and Energy Information Administration.
We have constructed the FinTech index using four variables, namely, Automated Teller Machines per 1,00,000 adults (ATM), Fixed Broadband Subscriptions per 100 individuals (FBS), Mobile Cellular Subscriptions per 100 individuals (MCS), and Individuals using the Internet (% of the population) (Internet). After normalising the variables, the equal-weighted method was applied, followed by calculating the geometric mean of all four indices to construct the FinTech index.
FinTech Index=4√ATM∗FBS∗MCS∗Internet
Where 0 means the worst performance, and 1 refers to the best performance.
Next, FSFC and NFSFC are calculated using the following formulas:
FSFC=CCit+NGit+PCitPECit
NFSFC=PECit−(CCit+NGit+PCit)PECit
where PEC, PC, NG, and CC stand for the total primary energy consumption, petroleum consumption, natural gas consumption, and total coal consumption, respectively. Here, t represents the time, and i represents the nation. All these energy consumption variables are measured in quadrillion BTU units.
Further, we have used three different equations for each of the environmental sustainability indicators. The equations are as follows:
Model 1: CO2t−1=αtCO2β1t−1FinTechβ2t−1FSFCβ3t−1⋅NFSFCβ4t−1GDPPCβ5t−1
Model 2: EFPt−1=αtEFPβ1t−1FinTechβ2t−1FSFCβ3t−1⋅NFSFCβ4t−1GDPPCβ5t−1
Model 3: LCFt−1=αtLCFβ1t−1FinTechβ2t−1FSFCβ3t−1⋅NFSFCβ4t−1GDPPCβ5t−1
Where, and are the elasticity coefficients for the lagged dependent variable, FinTech, FSFC, NFSFC, and GDPPC, respectively.
Next, we have employed the panel vector autoregressive (PVAR) model using the generalised method of moments (GMM) approach. Following Raifu et al. (2021), the panel VAR equation is as follows:
Zit=α0+p∑j=1αjZi,t−j+μi+ei,t
i ∈ {1, 2, 3…..N}, t ∈ {1, 2, 3…..Ti}
Where, depicts the set of three dependent variables, namely, CO2, EFP, and LCF. depicts the coefficient of the vector to be estimated. represent the fixed effect error term and idiosyncratic error term, respectively. The model assumes that the summation of the fixed effect error term is zero the and shows the stability of the VAR model. It is stable when the matrix is strictly less than 1. After satisfying the stability condition, we move on to the impulse response function, which helps with analysing the variable for future horizons
III. Empirical Findings
We begin our analysis with descriptive statistics (as shown in Table 1). The rejection of the null hypothesis, which suggests a normal distribution, is reflected in the values of the Jarque-Bera statistics. Consequently, the GMM-PVAR approach was employed in our study to address data non-normality and endogeneity.
For further analysis, we relied on the Panel VAR approach. This methodology captures dynamic interdependencies in the form of simultaneous relationships and lagged effects, while also mitigating endogeneity issues.
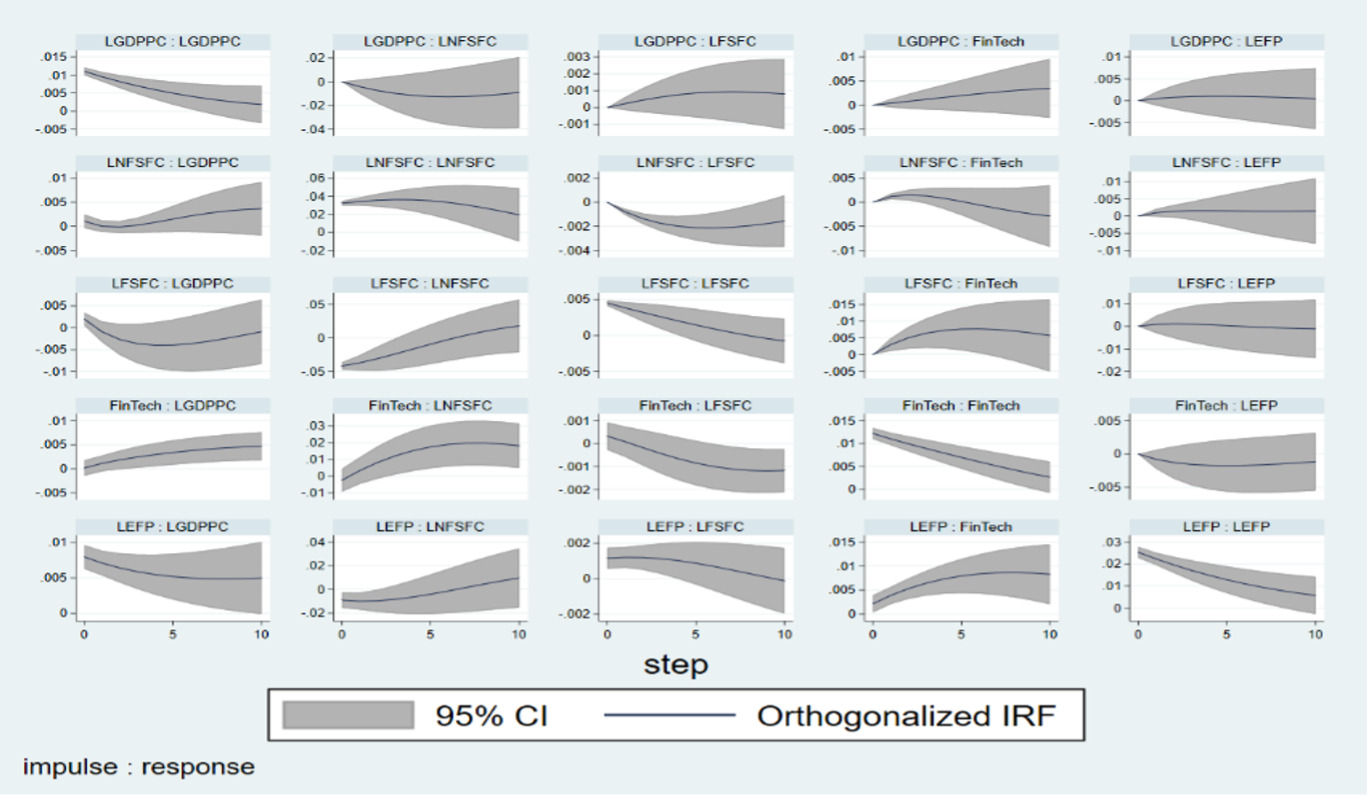
The results of impulse response functions (IRF) are shown in Figure 1. Figure 1 depicts the IRFs for model 1. The plots show that FinTech leads to a decrease in CO2, which is in line with previous findings suggesting a reduction in CO2 with the rise of FinTech (Firdousi et al., 2023). Despite being beneficial, this impact is relatively low, implying that opportunities for innovation and funding in sustainable methods remain unexplored, which could play a greater role in cutting emissions. Furthermore, the impact of FSFC on CO2 indicates a continuous increase in CO2 (Anser et al., 2020). In contrast, the use of NFSFC slightly increases CO2 during the initial phase due to the energy required to build infrastructure or temporarily switch to a mixture of energy resources (Abbasi & Abbasi, 2000); however, its impact starts to decrease and remains stable over a 10-year horizon. This is comparable to previous findings, which indicate that renewable sources only begin to reduce CO2 emissions once they account for a specific portion of the energy supply (Chiu & Chang, 2009). The impact of GDPPC on CO2 also shows a negative relationship, suggesting a rise in sustainability consciousness and strategies (Danish et al., 2019).
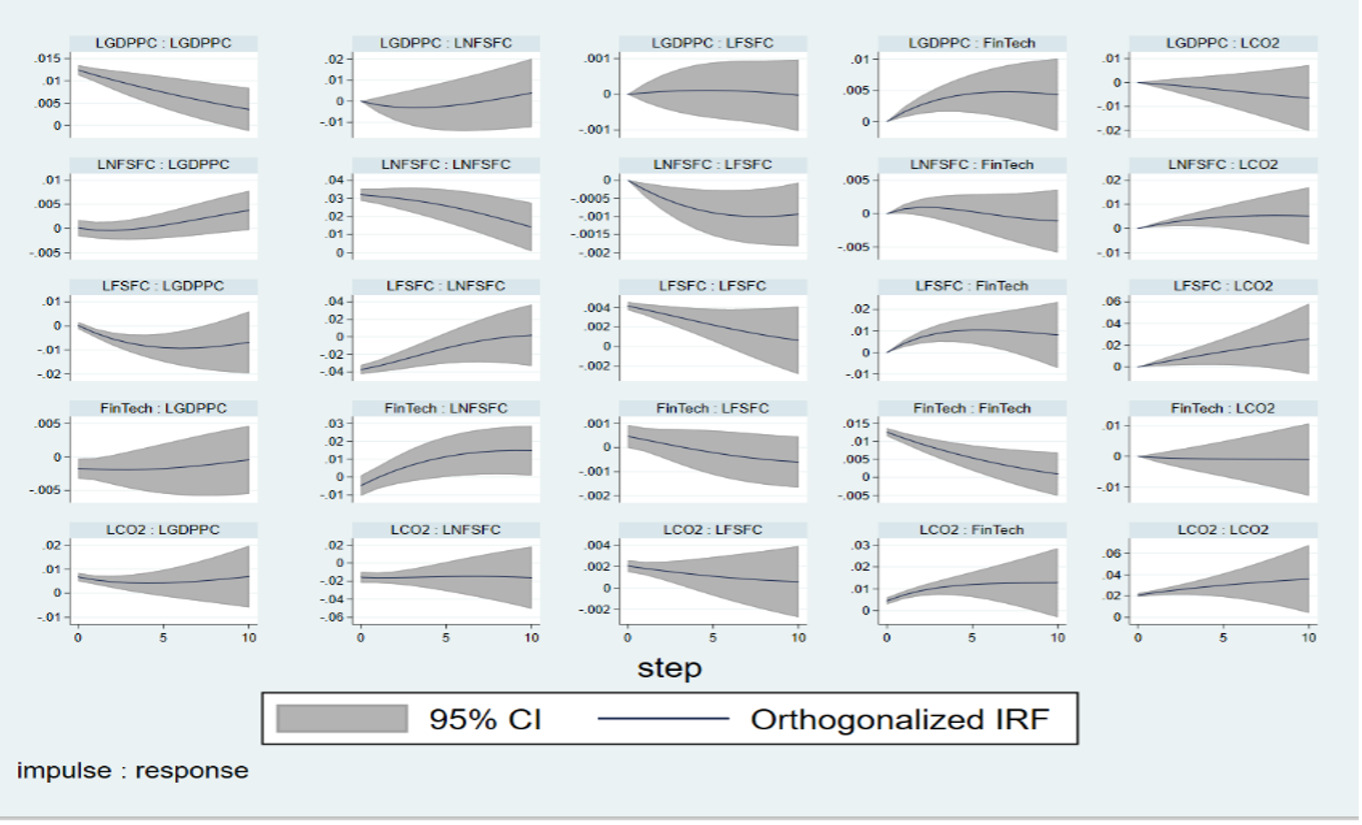
Figure 2 shows the IRFs obtained using model 2. The plots of the IRFs reflect FinTech having a positive impact on the environment. However, this decreasing impact is quite low, indicating that the overall environmental effect might be constrained by factors such as sluggish adoption rates, the scale of green technology investments, and competition from conventional financial practices that may not prioritise sustainability (Muhammad et al., 2022). Over time, FSFC results in a slight decline in EFP, owing to the industrial sector’s strong reliance on technologies derived from FSFC, which overshadows environmental improvement initiatives (Adebayo, 2022). Furthermore, NFSFC and GDPPC exhibit minimal impact on LEFP.

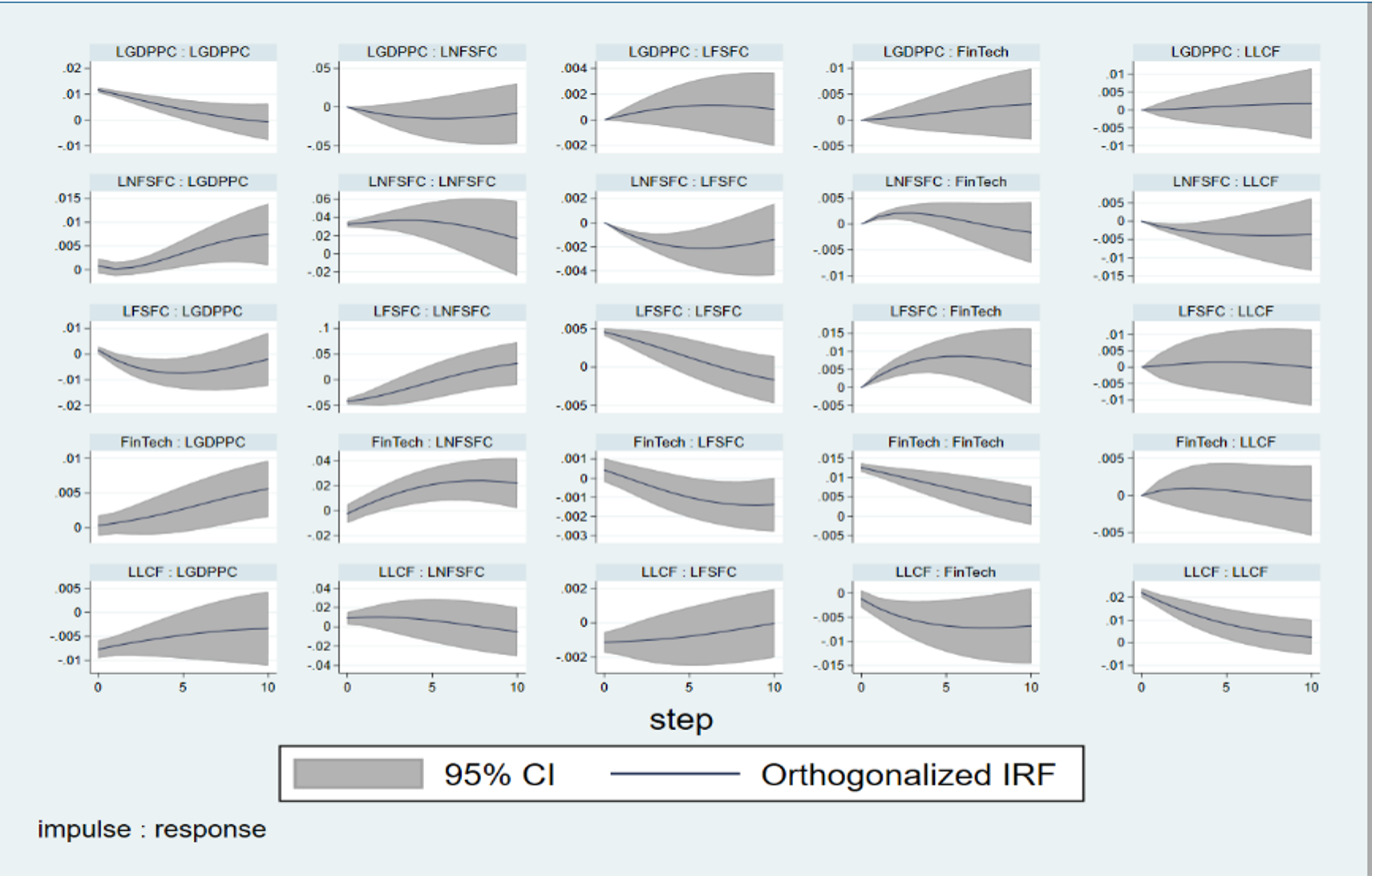
Figure 3 presents the IRFs for model 3. The IRF plots for FinTech and LCF indicate a slight increase in the initial horizons. However, this impact diminishes over a longer duration, underscoring the need for continuous innovation and adaptation in financial technologies to maintain beneficial effects on energy efficiency (Worrell et al., 2001). This suggests that, while FinTech may initially enhance LCF, its long-term viability depends on sustained efforts, possibly due to increased resource consumption. Furthermore, NFSFC exhibits a negative impact on LCF, attributable to infrastructure limitations or transitional challenges from non-renewables to renewables, such as high implementation costs. Additionally, the impact of GDPPC on LCF is positive, indicating that as the economy improves, its effect on LCF also strengthens.

The outcomes of IRFs indicate that FinTech leads to an increase in NFSFC and a decrease in FSFC. Additionally, FinTech has a positive effect on GDPPC.
IV. Conclusion
This study examines the inter-relationship between FinTech, fossil fuel, and non-fossil fuel energy consumption, and their impact on environmental sustainability. The analysis covers data from 2005 to 2022 for G-20 nations, employing the panel VAR methodology. The findings conclude that FinTech positively influences economic growth, non-fossil fuel energy consumption, and environmental sustainability, while reducing dependence on fossil fuel energy consumption. Furthermore, increased use of non-fossil fuels and economic growth contribute to a reduction in carbon emissions. Nevertheless, these factors have minimal effect on the load capacity factor and ecological footprint.
Policymakers may consider encouraging green practices and ecological goals, such as minimising carbon footprints through the use of FinTech platforms. FinTech companies can collaborate with energy suppliers to develop digital solutions for monitoring and reducing energy consumption, as well as providing customers with incentives and insights to lower their reliance on fossil fuels. To maximise load capacity and minimise energy wastage, it is beneficial to utilise FinTech-driven smart grids and support platforms that promote transparency and traceability in supply chain and energy management systems.