I. Introduction
The shift towards clean energy has become an indispensable component of global efforts to address climate change and secure a sustainable future. This transition is essential for lowering carbon footprints and counteracting the detrimental consequences of environmental degradation, while fostering resilient economic development (Raghutla & Chittedi, 2023). The clean energy industry has attracted considerable attention for its transformative potential to revolutionise energy markets and galvanise technological innovation. Wang et al. (2024) highlight that this transformation yields both ecological benefits and notable economic gains, such as investment diversification, reduced energy costs, and the growth of green economies. Concurrently, business conditions, reflected in major macroeconomic indicators, play a key role in influencing the pathway of clean energy adoption. Favourable business environments can drive investment growth in sustainable energy projects and green technologies, whereas adverse circumstances may stall progress. Constant et al. (2024) analyse the effect of sovereign risk on renewable energy stocks during the 2008 financial crisis and the 2010–2012 European debt crisis, revealing a heightened impact on the sector’s performance throughout both turbulent episodes.
On the other hand, the expansion of the clean energy sector not only propels innovation and economic resilience but also positively impacts industrial production and job markets. As demand for renewable energy technologies grows, it boosts industrial output and promotes manufacturing in key sectors. Additionally, the sector generates a wide array of job opportunities, which reduces unemployment and creates new roles across various skill levels. Rao et al. (2024) maintain that changes in energy prices can have a remarkable influence on the real economy across several routes, including balance of payments, production costs, aggregate demand and supply, inflation, and corporate investment decisions. Akan (2024) shows that renewable energy has become a key component of economic systems, significantly influencing macroeconomic conditions and mitigating the short-term impact of core macroeconomic factors on greenhouse gas emissions. Hence, understanding the dynamic interplay between the clean energy industry and business circumstances is crucial for accomplishing both environmental sustainability and economic stability, while also ensuring that policy decisions effectively address the complexities of these interdependent systems.
We investigate the dynamic relationship between US business conditions (ADS) and clean energy stock prices (ECO), utilising the quantile-on-quantile connectedness (QQC) method by Gabauer and Stenfors (2024). Unlike conventional quantile connectedness approaches that assess interactions at identical quantile levels and assume positive associations (Ando et al., 2022), QQC captures both symmetric (e.g., high–high, low–low) and inverse (e.g., low–high, high–low) quantile dependencies. This advantage enables the detection of nonlinear and asymmetric dynamics that are often overlooked by traditional linear models or marginal quantile-based methods. For example, it allows us to assess spillover effects between business conditions and clean energy stock performance when the former is at a trough, while the latter experiences a bullish phase.
II. Data and Methodology
A. Main variables
The sample spans August 2004 to December 2024, yielding 245 monthly observations. US clean energy stock performance is measured using the WilderHill Clean Energy Index (ECO), which tracks US-listed firms focused on clean energy innovation and pollution reduction. US business conditions are captured by the Aruoba-Diebold-Scotti (ADS) index, a real-time measure integrating indicators across multiple frequencies. Positive ADS values reflect above-average growth, whereas negative values indicate economic slowdowns. Its key components include the yield curve, jobless claims, real GDP, and payroll employment. ECO and ADS datasets are sourced from Yahoo Finance and the Philadelphia Fed (https://www.philadelphiafed.org/), respectively. Both series are log-transformed, with the inverse hyperbolic sine function applied to handle non-positive values.
The univariate stochastic characteristics of the variables are shown in Table 1. ADS has a log mean value of -0.138, suggesting slower growth or a potential contraction in economic activity over the investigation period. The distribution of ECO (ADS) exhibits positive (negative) skewness. ECO (ADS) appears to be platykurtic (leptokurtic) relative to the Gaussian distribution. Both time series deviate significantly from normality, as demonstrated by the Jarque-Bera test statistics. The ADF and KPSS unit root tests confirm that the log forms of ECO and ADS become stationary after first differencing.
B. Methodology
Our empirical analysis relies on the QQC framework, which provides a more granular perspective by investigating the nexus between each quantile of the ADS series vis-à-vis each quantile of the ECO counterpart. As elaborated by Gabauer and Stenfors (2024), the process begins with estimating a quantile vector autoregressive model of order p (QVAR(p)), which is described as:
xt = μ(τ)+p∑j=1βj (τ) xt−j+εt(τ)
where and are vectors of endogenous variables (ADS, ECO) with a dimension, p denotes the BIC-based appropriate lag order of the QVAR model, is a vector of quantiles selected within the range (0, 1), $\mu(\tau)\ $denotes a dimensional vector of conditional means, is a matrix of coefficient estimates, and is dimensional vector of error terms with a variance-covariance matrix, The QVAR model is converted into a quantile vector moving average (QVMA) specification to facilitate the computation of the generalized forecast error variance decomposition (GFEVD), as outlined below:
xt =μ(τ)+p∑j=1βj (τ) xt−j+εt(τ)= μ(τ)+∞∑i=0Αi(τ)εt−i(τ)
To quantify the proportion of the forecast error variance of a variable $x_{i}\ $at a future time horizon steps ahead that is caused by a shock in variable where for each the -step ahead GFEVD is calculated as follows:
∅gi←j, τ(F)=∑F−1f=0[e′i Αf(τ) H(τ) ej]2 Hii (τ) ∑F−1f=0[e′i Αf (τ) H(τ) Αf (τ)′ ei]
g SOTi←j, τ(F)=∅gi←j, τ(F) ∑kj=1∅gi←j, τ(F)
where denotes a selection vector of length where all elements are zero except for the those in the ith position, which are 1. Subsequently, with the aid of normalization, the TOothers, FROMothers, and NET metrics are defined as follows:
Sgen, TOi→∗, τ=K∑k=1, i≠jg SOTk←i, τ
Sgen, FROMi←∗, τ=K∑k=1, i≠jg SOTi←k, τ
Sgen, NETi, τ= Sgen, TOi→∗, τ− Sgen, FROMi←∗, τ
To evaluate the extent of network connectedness, the adjusted total connectedness index (TCI) is employed, and it is derived as follows:
TCIτ (F)=KK−1K∑k=1Sgen, FROMk←∗, τ≡KK−1K∑k=1Sgen, TOk←∗, τ
The TCI captures the proportion of forecast error variance in one variable attributable to shocks from the other, aggregated across all quantile combinations and both directions of transmission.
III. Empirical Evidence
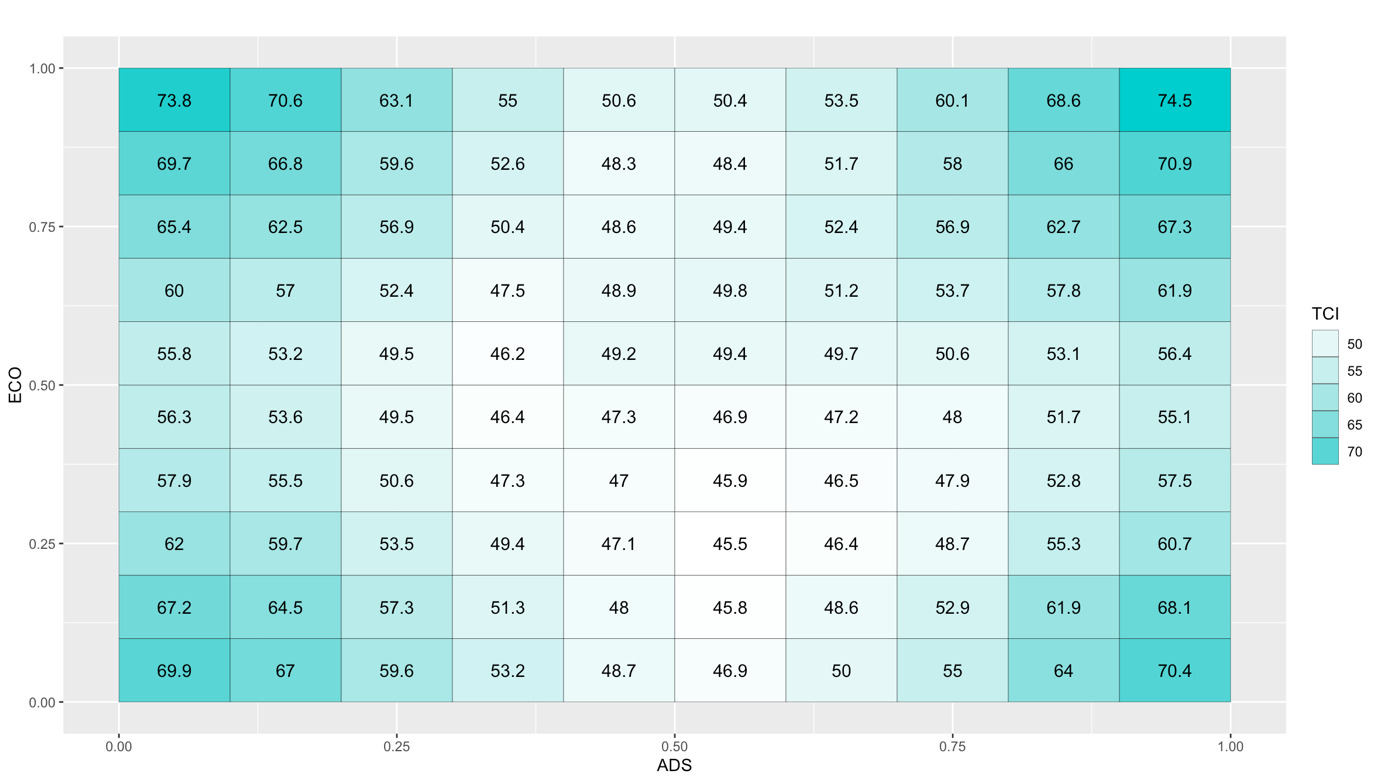
Figure 1 illustrates the TCI between ADS and ECO across the full spectrum of their quantile intersections. The central cells predominantly exhibit pale cyan shades, indicating that during periods of non-extreme ADS levels and ECO performance, spillovers between them are minimal. This reflects fragile connectedness under typical circumstances. For instance, the smallest TCI value of 45.5 is observed at the intersection of and In contrast, the TCI is more pronounced at the extreme quantiles of both ADS and ECO. This heightened connectedness is depicted by the darker cyan cells in the four corners of Figure 1, signifying stronger interdependence under extreme scenarios compared to other ones. For example, the largest TCI magnitude of 74.5 occurs at the junction of and while another substantial value of 69.9 is located at and highlighting a significant direct relationship. The former value indicates intense interactions when both ECO performance and ADS levels are exceptionally high, whereas the latter reflects considerable spillovers when both metrics are extremely low. On the other hand, substantial levels of inversely related quantile connectedness are evident along the off-diagonal line from the bottom-right to the top-left in Figure 1. These are represented by the dark cyan regions. For instance, the top-left corner while and the bottom-right corner while exhibit TCI values of 73.8 and 70.4, respectively. This evidence indicates that information transmission is significant when business conditions are weak but clean energy stocks perform well, or when clean energy markets lag despite strong economic conditions. This asymmetry in spillover dynamics confirms that the ADS-ECO nexus becomes markedly robust at extreme quantiles, underscoring the pivotal role of quantile-specific patterns in evaluating the connectedness between clean energy stock markets and real economic activity. Salisu et al. (2019) show that linking macro fundamentals to energy-stock market dynamics helps policymakers gauge economic resilience to energy shocks and their financial spillovers.

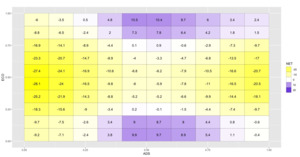
To assess the role of ADS and ECO as either net shock receivers or net shock transmitters, Figure 2 displays the net QQ total directional connectedness between them. ECO primarily functions as a net shock receiver, as indicated by the dark yellow cells at the intersections of its central quantiles with the lowest and highest quantiles of ADS. This suggests that during extreme business conditions—whether markedly adverse or favourable—clean energy markets, especially under typical conditions, are sensitive to changes in ADS and tend to absorb shocks. Conversely, ADS predominantly acts as a net shock transmitter, particularly at the extreme quantiles of ECO, as reflected in the dark violet cells along the x-axis. These dark violet regions, where ECO’s low and high quantiles intersect with the non-extreme quantiles of ADS, further demonstrate that clean energy firms are vulnerable to standard economic activity, regardless of their performance state. The pale-coloured cells at the centre of Figure 2 indicate that under ordinary circumstances for both ECO and ADS, the nexus between them is relatively weak, with minimal spillover effects. This analysis confirms that shifts in business conditions have a significant impact on clean energy markets, underscoring the sector’s pronounced sensitivity to broader economic dynamics. Van Hoang et al. (2020) document a two-way predictive relationship between renewable energy consumption and US industrial production. Steffen (2020) shows that, in addition to factors specific to renewable energy, general interest rate conditions also influence the capital costs associated with renewable energy initiatives.
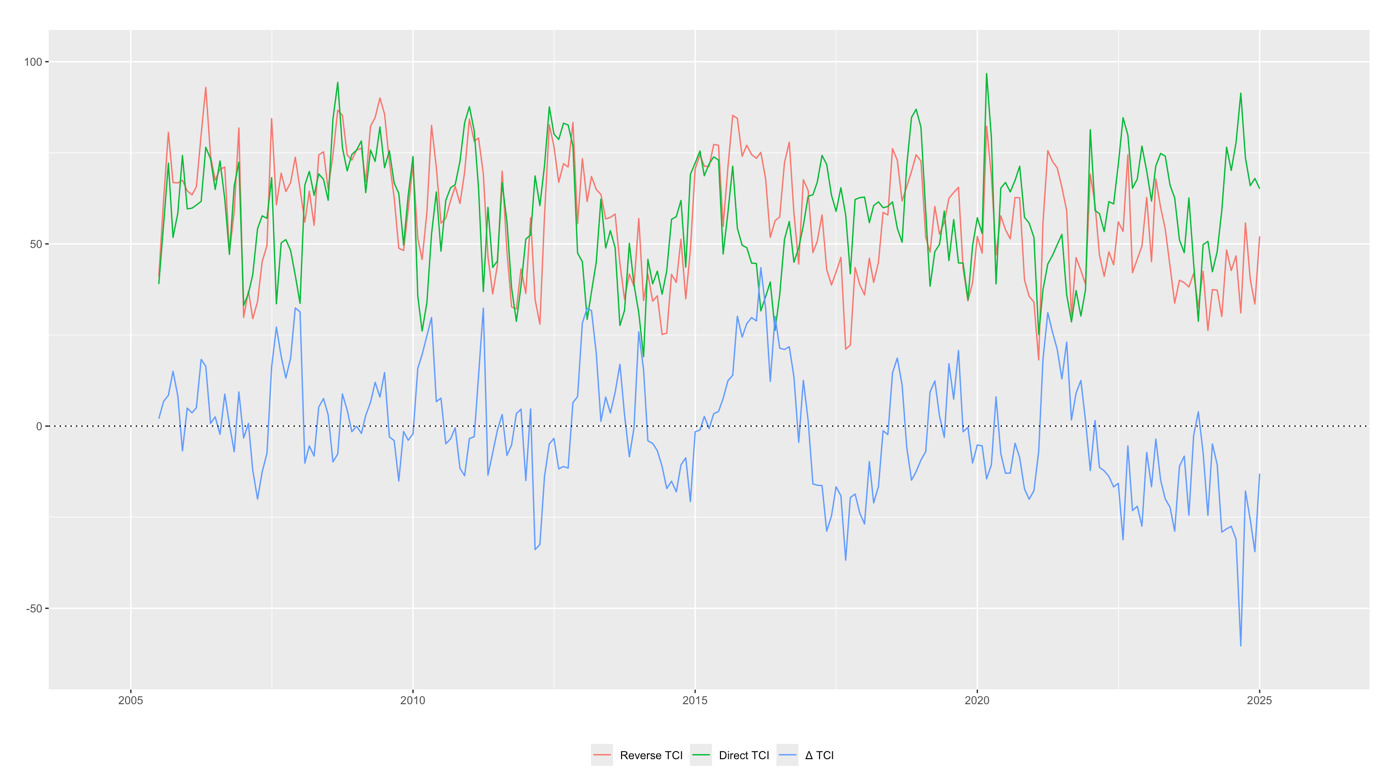
Figure 3 illustrates the average dynamic total connectedness between ADS and ECO, highlighting both direct and inverse relationships over time. Alternating phases of connectedness appear to be driven by shifts in US economic fundamentals and major global events, such as the 2007–2009 financial crisis and the COVID-19 pandemic. Divergence between ADS and ECO is evident before 2007, in the aftermath of the crisis, and during 2015–2017, as shown by the dominance of the red line. This suggests differing responses of clean energy stocks to macroeconomic shocks. In contrast, the green line dominates in 2013, 2016–2018, and especially from 2020–2024, indicating stronger alignment. This synchronisation during the COVID-19 period reflects deeper integration between clean energy markets and broader economic conditions, likely driven by coordinated fiscal and monetary policies aimed at recovery. Overall, the graph underscores how macroeconomic shocks and policy responses shape the dynamic spillovers between business activity and clean energy markets.

IV. Conclusion
This paper explores the dynamic linkages between US business conditions and clean energy stock prices using the quantile-on-quantile connectedness (QQC) approach. The results indicate minimal connectedness in normal states but substantial spillovers during extreme economic conditions, particularly when both variables are simultaneously high or low. Asymmetries arise when one variable is at an extreme and the other is not, underscoring the significance of tail events in shaping interactions between clean energy markets and macroeconomic activity. Clean energy stocks predominantly act as net receivers of shocks during extreme business conditions, while business conditions mainly serve as net transmitters, especially when clean energy prices are under pressure.
From a policy perspective, our evidence highlights the vulnerability of clean energy firms to wider economic fluctuations and the importance of adopting targeted, countercyclical fiscal and monetary interventions. Ensuring market resilience in the face of sharp economic shifts requires credible policy frameworks that mitigate systemic fragility and support the transition to clean energy. Investors should remain attentive to changes in macroeconomic fundamentals, particularly indicators of business conditions, as these can signal periods of heightened transmission risk within clean energy markets. Implementing forward-looking risk management strategies, such as tail-risk hedging or quantile-sensitive portfolio allocations, can help to reduce losses and seize opportunities when clean energy markets are impacted by extreme economic conditions. Future research should refine the QQC framework by incorporating higher-moment spillovers, as skewness and kurtosis provide valuable insights into asymmetries and tail dependencies.