


I. Introduction
“Make America Great Again” and “America First,” Trump’s defining slogans, ushered in a protectionist era after his 2016 election, marked by a trade war, mainly with China, and U.S. withdrawal from the Paris Agreement. His 2017–2020 presidency reshaped global energy expectations, heightening volatility in oil, gas, and renewables (Guliyev, 2020). After his 2024 return, Trump revived uncertainty through new trade and tariff policies. On April 2, 2025, his “Liberation Day” tariffs became a key event influencing market expectations and investor sentiment in the energy sector (Kaczmarek et al., 2025; Zheng & Lucey, 2025).
The relationship between political announcements and market dynamics can be theoretically framed within the domain of behavioral finance, particularly through attention-based asset pricing models (Barberis & Thaler, 2003; Da et al., 2011). Political statements, especially those made by influential figures such as former President Trump, tend to attract heightened investor attention and consequently shape market behavior through channels of information dissemination, uncertainty transmission, and sentiment alteration. Investor attention reflects variations in public interest concerning policy-related information that can affect investment decisions (Da et al., 2011). This attention-based mechanism is especially salient in energy markets, where elevated policy uncertainty can modify expectations regarding future supply–demand conditions and the regulatory landscape (Baker et al., 2016).
Recent literature highlights the significant effects of Trump’s election victory policies on both fossil fuel and renewable energy markets (Ahmed et al., 2025; Harrison, 2025; Mukanjari & Sterner, 2024). Additionally, Trump’s tariff policies increased trade policy uncertainty that affects financial assets, including oil prices (Bouri et al., 2025; Chen et al., 2023). Similarly, Cosma et al. (2025) investigate the linkage of the Trump election effect on green stocks.
Although prior research offers insights into Trump’s policies and trade effects on energy markets, three gaps persist. First, studies rarely analyze crude oil prices, volatility, and clean energy jointly. Second, investor attention as a transmission channel remains underexplored. Third, there has been insufficient exploration of how these relationships and their causal links change across various frequencies, time horizons, and quantiles.
This paper fills these gaps by examining the frequency-quantile dependence and quantile-causality between U.S. trade policy uncertainty (TPU), Trump-related investor attention (GSVI), and energy indicators, namely WTI oil, oil volatility, and clean energy prices by using wavelet quantile regression. Unlike previous studies, the primary objective of this research is to provide insights into the influence of Trump’s policy announcements since his return to the White House on the frequency-quantile dependence between trade policy, Trump-related investor attention, and energy market behavior.
Sections II, III, and IV present the data and methodology, the empirical findings, and the conclusion, respectively.
II. Data and Methodology
This study considers daily data on WTI crude oil prices, oil implied volatility (OVX), clean energy prices (CE), trade policy uncertainty (TPU), and investor attention related to the keyword “Donald Trump.” Specifically, we use the Google Search Volume Index (GSVI) as a proxy for investor attention. The clean energy index is the S&P Global Clean Energy Index, which measures the performance of the 30 largest companies in global clean energy–related businesses from both developed and emerging markets. The sample period spans from January 2 to June 28, 2025, covering all major public announcements made by President Donald Trump following his return to the White House. This six-month sample captures a period of intense market turbulence triggered by Trump’s key policy announcements, which caused sharp energy market reactions since his return to the presidency. Although the short span limits long-term inference, frequency analysis enables detailed short-term assessment across horizons and quantiles. However, this brevity may introduce biases from sample-specific shocks, lower statistical power, and transient events.
The energy proxies, namely WTI, OVX, and clean energy prices are sourced from https://www.investing.com, while GSVI and TPU data are extracted from the Google Trends platform and http://www.policyuncertainty.com, respectively. All variables are transformed into their daily logarithmic forms which are indicated as follows: lnWTI, lnOVX, lnCE, lnTPU, and lnGSVI. Table 1 presents the summary statistics (see Panel A). The descriptive statistics show that the mean values are positive. WTI and CE display the lowest variability, as reflected by their small variances and coefficients of variation, whereas TPU and GSVI exhibit greater volatility. Skewness values indicate that OVX, CE, and GSVI are positively skewed, while WTI and TPU show slight negative skewness. Most series (except TPU) have kurtosis values below three, implying flatter-than-normal distributions. The Jarque–Bera test rejects normality for WTI, OVX, CE, and GSVI, confirming non-normal distributions. Finally, the ARCH-LM test is significant for all variables, indicating the presence of heteroskedasticity (time-varying volatility clustering) following Trump’s announcements.
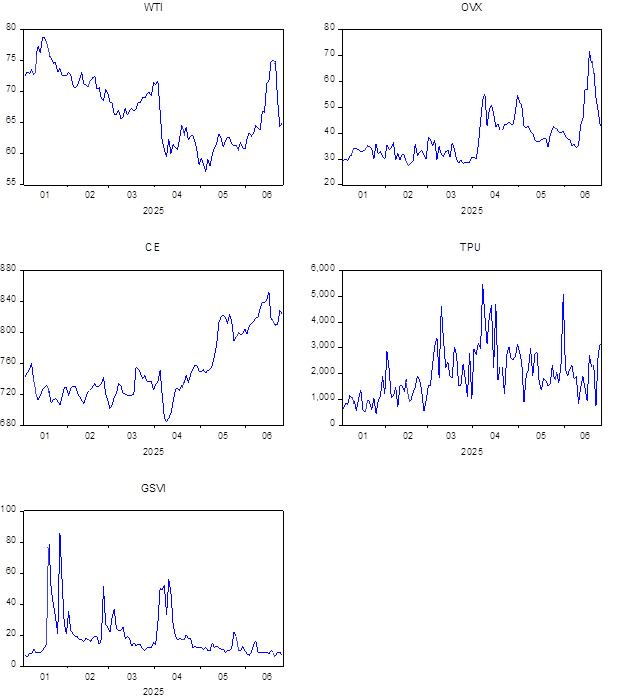
Figure 1 presents the time series plots of the variables. All variables exhibit heightened variability around key political and economic announcements following Donald Trump’s return to the White House, particularly the “Liberation Day” tariff speech on April 2, 2025, which triggered strong market reactions. These reactions demonstrate how Trump’s policy announcements can swiftly alter market sentiment, amplify uncertainty, and reshape investment dynamics across energy and clean energy markets.
To achieve the objectives of this study, we employ the recently introduced wavelet quantile regression (WQR) method proposed by Adebayo and Özkan (2024b). The WQR model is defined for a given quantile and at specific wavelet scale for dependent and independent variables as follows:
φ(θ)(fj[Y]|fj[X])=y0(θ)+y1(θ)fj[X]
Moreover, for more deep analysis, we utilize the quantile-on-quantile Granger causality (QQGC) method introduced by Adebayo and Özkan (2024a) to examine causality effect across various quantiles of variables. The QQGC can be specified as follows:
QBτ,t=δτ,θ,0+P∑i=1ϑiQBτ,t−i+P∑i=1αiQAθ,t−i+ετ,θ,t
where and Nonetheless, represents the constant term at quantile and denotes the coefficients of the lagged values of the th conditional quantile of donates the lagged values of th conditional quantile of at different time periods represents the coefficients of the lagged values of the th conditional quantile of means the lagged values of the th conditional quantile of at different time periods and shows the error term at the time quantile and
III. Results
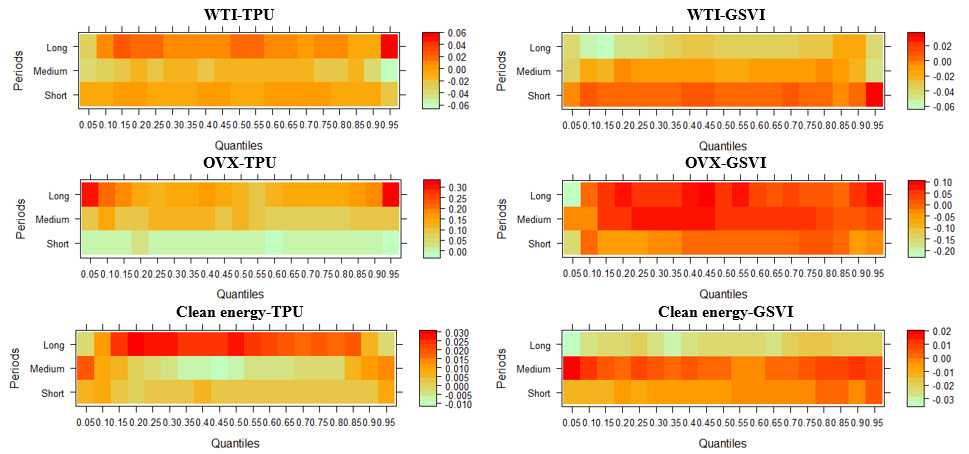
Figure 2 illustrates the frequency-quantile dependence among TPU, GSVI, WTI, OVX, and clean energy prices, revealing temporal, asymmetric, and regime-dependent dynamics. Specifically, the WTI–TPU plot demonstrates strong positive coherence at lower and upper quantiles, particularly over long horizons, indicating that crude oil prices respond sharply to trade uncertainty in extreme market conditions. A 1% rise in TPU increases WTI prices by 0.05–0.06% in these quantiles, while effects are smaller (0.02–0.03%) at medium horizons and negligible in the short term. For WTI–GSVI, dependence is positive across quantiles over short horizons, with a 1% GSVI increase raising WTI by about 0.02%, suggesting that heightened investor attention temporarily supports oil markets. However, over medium and long horizons, the relationship slightly turns negative (–0.00% to –0.06%), indicating that persistent attention may coincide with market corrections or speculative overreactions, exerting mild downward pressure on prices.
The OVX–TPU relationship shows strong positive coherence at long horizons and extreme quantiles, implying that trade uncertainty significantly amplifies oil market volatility. A 1% TPU increase raises OVX by about 0.25%. Medium-term responses are moderate (0.10%–0.15%) and limited short-term effects. OVX–GSVI is consistently positive over medium and long horizons across most quantiles, reflecting that attention shocks sustain volatility. A 1% increase in investor attention raises oil volatility by approximately 0.05–0.10%. A negative dependence occurs at short horizons and lower quantiles of medium/long-term horizons, suggesting temporary stabilization when attention rises in calm markets. A 1% rise in GSVI is associated with an approximate 0.05–0.20% decline in OVX.
For clean energy, TPU dependence is moderate, mainly at short-term quantiles and extreme medium/long-term quantiles. Across 0.15–0.85 quantiles over long horizons, a 1% TPU rise increases prices by 0.015–0.03%, implying that trade uncertainty can favor renewables as investors diversify. Central quantiles show negative dependence, with 1% TPU increases reducing prices by 0.01%, indicating that sustained uncertainty may deter green investment. CE–GSVI shows positive dependence at extreme quantiles of medium horizons, where a 1% rise in GSVI enhances CE by 0.02%, suggesting that investor focus on policy or sustainability narratives linked to Trump can boost clean energy markets. However, the effect weakens around mid-quantiles. In contrast, short/long horizons display negative dependence, where a 1% increase in GSVI corresponds to a decline in CE up to –0.03% at the 0.05–0.35 quantiles, reflecting that excessive attention may trigger brief corrections in clean energy valuations.
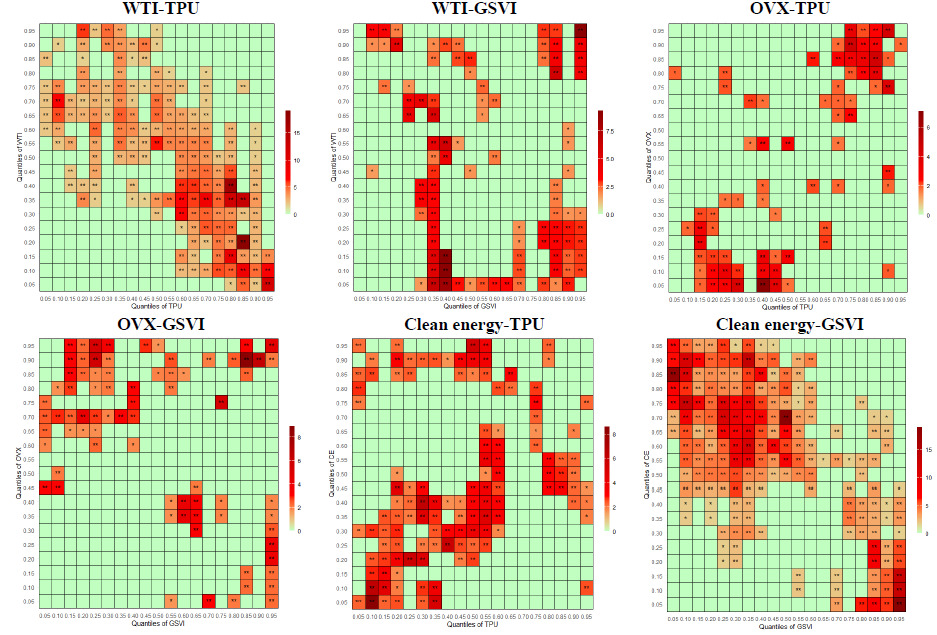
Nonetheless, for deeper analysis and greater robustness of results, we employ the quantile-on-quantile Granger causality model to detect causal effects across quantiles of variables, since wavelet quantile regression only identifies dependence between variables. The heatmaps in Figure 3 present the QQ-Granger causality results across different pairs of variables. Overall, the results show heterogeneous and asymmetric causal linkages that vary across quantiles, suggesting that the relationships are stronger during extreme market conditions (lower and upper quantiles) than in the median ranges. In particular, WTI–TPU and CE–GSVI exhibit the strongest and most consistent bidirectional causal effects across quantiles, highlighting the sensitivity of energy and clean energy markets to policy uncertainty and investor sentiment. Conversely, causality is weaker and more sporadic for OVX-related pairs.

To validate the quantile-based models, Quantile–Quantile (Q–Q) plots and the Broock–Dechert–Scheinkman (BDS) test were conducted to evaluate the reliability of the estimates and the adequacy of the models. As shown in Figure 4, all variables deviate from normality across quantiles, indicating asymmetric and heavy-tailed distributions. The BDS test results in Table 1 (see Panel B) reject the null of independent and identically distributed residuals, confirming nonlinear dependence in the data. Overall, evidence from the Q–Q and BDS tests highlights both non-normality and nonlinearity, supporting the use of quantile-based approaches in this study.

Our findings align with previous research, as Ahmed et al. (2025), Mukanjari and Sterner (2024), and Harrison (2025) document the considerable influence of Trump’s policies on both fossil fuel and renewable energy markets. Similarly, Chen et al. (2023) and Bouri et al. (2025) show that Trump’s tariff measures have intensified trade policy uncertainty, thereby affecting financial assets such as oil prices. However, our study extends this literature by revealing that energy markets exhibit asymmetric responses to trade uncertainty and investor attention indices across different time horizons during Trump’s recent announcements following his return to the presidency. Furthermore, we provide robust evidence of a causal relationship between trade uncertainty, investor attention to Trump’s announcements, and energy market dynamics across various quantile levels.
IV. Conclusion
The main results of this study indicate that oil prices, volatility, and clean energy markets are sensitive to trade uncertainty and Trump-related investor attention during political and economic announcements made by President Donald Trump since his return to the White House. This sensitivity is asymmetric and varies according to the time horizon and market regime. The findings offer several important policy implications for both policymakers and investors. Policymakers should recognize that trade policy and investor attention to political figures such as Trump generate asymmetric and time-varying effects on energy markets. Clear and consistent communication regarding trade and energy policy could help reduce market volatility and speculative behavior, particularly during periods of heightened uncertainty. For investors, the results emphasize the need to adopt dynamic risk management and portfolio diversification strategies that account for regime-dependent and quantile-specific market responses. Moreover, supporting long-term policy stability and renewable energy incentives may help mitigate the adverse effects of uncertainty on clean energy investment.