
I. Introduction
Nowadays, the energy sector accounts for roughly 75% of greenhouse gas emissions (Ma et al., 2022). International Energy Agency (2021) emphasizes that curbing these emissions is not only essential for reaching the 2050 net-zero target but also represents one of humanity’s most significant challenges. As a result, reducing energy use and improving energy intensity have consistently drawn considerable attention. Japan presents a compelling case for re-evaluating energy intensity. While the country is widely regarded as energy-efficient, recent trends reveal uneven declines in energy use - significant in industry and transport, but slower in residential and commercial sectors. These disparities, combined with ongoing urbanization and energy policy shifts following the Fukushima disaster, raise important questions about the sustainability of Japan’s energy trajectory. As the country accelerates its green and digital transitions, reassessing the long-term dynamics of energy intensity becomes critical, not only to inform domestic policy, but also to offer valuable insights for other advanced, aging East Asian economies facing similar structural and environmental challenges.
Theoretically, the factors influencing energy intensity are categorized under the Stochastic Impacts by Regression on Population, Affluence, and Technology (STIRPAT) model proposed by Dietz and Rosa (1997). Numerous researchers have devoted efforts to identifying the main factors influencing energy intensity and gaining deeper insights into its trends. While previous studies have provided valuable insights, they often rely on static models that fail to capture the evolving nature of the relationships across different time scales. Economic growth, urbanization, and financial development are commonly recognized as the primary drivers behind the reduction in energy intensity during the 1990s (Deichmann et al., 2019; Marra et al., 2024). These factors often enabled the adoption of more efficient technologies and infrastructure improvements, which in turn reduced the amount of energy required to produce goods and services. In addition, energy intensity serves as a more accurate measure of a country’s energy efficiency in production activities. Unlike total energy consumption, energy intensity accounts for how much economic value is derived from each unit of energy consumed, thus providing a clearer picture of energy productivity. As countries experienced economic expansion, they gradually transitioned from traditional, energy-intensive industries to more service-oriented and high-tech sectors that required less energy per unit of output. Simultaneously, urbanization facilitated more efficient energy use through improved infrastructure, compact living arrangements, and greater access to public transportation, which collectively reduced per capita energy consumption (Wang et al., 2020). Meanwhile, financial development played a crucial role by enabling investments in energy-efficient technologies and clean energy solutions, allowing both firms and households to adopt more sustainable production and consumption practices. However, despite extensive literature on the determinants of energy intensity, the empirical findings remain inconsistent across countries and time periods, especially for advanced economies like Japan, where the interaction between aging population, urbanization, and capital market maturity adds layers of complexity.
Therefore, this study aims to extend the discussion by addressing the above shortcomings and revisiting the time-varying impacts of economic growth (GDP), urbanization (URB), and financial development (FD) on energy intensity (ENI) in Japan from 1970 to 2022 using Wavelet tools. That means we try to answer the following questions: (1) Are GDP, URB, FD and ENI inversely or directly connected? (2) What is the lead-lag patterns between GDP, URB, FD and ENI in Japan? (3) What is the direction of causality across various frequencies? By focusing on Japan as a case study, this research not only contributes to the empirical literature on energy intensity and its drivers but also offers practical implications for energy and urban policy in other developed and rapidly urbanizing economies.
The rest of this paper is structured as follows. Section II outlines the methodology, Section III discusses the principal results, and the concluding section wraps up the discussion.
II. Methodology
To achieve the research aim, the initial model is suggested as follows: ENI denotes energy intensity (unit: kWh), which is collected from the International Energy Agency database. GDP, URB and FD are economic growth, urbanization, and financial development, respectively. We use the GDP per capita (fixed 2015 prices), urbanization rate, and domestic credit to private sector by banks (% of GDP) to present GDP, URB and FD variables, respectively. All data were taken from the World Bank. The start year is 1970, and the end year is 2022.
As mentioned in part one, the existing econometric models ignored the time-varying impact of GDP, URB and FD on ENI. Thus, they cannot provide a more intuitive understanding of the connectedness between the examined variables, signifying short-, medium-, and long-run interactions and which variables are leading or lagging at specific time-frequency domains. So, in this section, the study briefly introduces the main wavelet tools to overcome these limitations. The Wavelet of the series is defined as:
Wx(s)=∫∞−∞x(t)1√sψ∗(ts)
In Equation (1), denotes the complex conjugate and where the scale parameter s identifies whether the Wavelet can detect higher or lower series components, possible when the admissibility condition yields. Torrence and Webster (1999) suggested that the cross-wavelet transform technique of two series and can be given as:
WXYn(u,s)=WXn(u,s)WY∗n(u,s)
In Equation (2), presents the position and denotes the scale. The equation of the squared wavelet coherence can be specified as:
R2n(u,s)=|S(s−1WXYn(u,s))|2S(s−1|WX(u,s)|2)S(s−1|WY(u,s)|2)
In Equation (3), S connotes the smoothing process for time and frequency simultaneously, therefore, is in the range between zero and one. The co-movement between and series is stronger when reaches one. Similarly, the series indicators are not associated or have no causal link when approaches zero. Nevertheless, the coherence wavelet is squared; thus, it does not capture the causal association between positive or negative dependency. Torrence and Webster (1999) suggested the formula for the phase difference mechanism between x(t) and y(t) series as:
ϕXY(u,s)=tan−1(I{S(s−1WXY(u,s))}R{S(s−1WXY(u,s))})
In Equation (4), and are the imaginary and real parts of the smooth power spectrum, respectively. Arrows indicate correlation: an up-right arrow shows a positive correlation with a lead of less than 90°; a down-right arrow indicates a positive correlation with a lead of 90°-180°. An up-left arrow denotes a negative correlation with a lead of less than 90°; a down-left arrow indicates a negative correlation with a lead of 90°-180°. Arrow length reflects coherence strength. Finally, the test proposed by Olayeni (2015) will be employed to check the wavelet-based Granger causality result.
III. Empirical Results
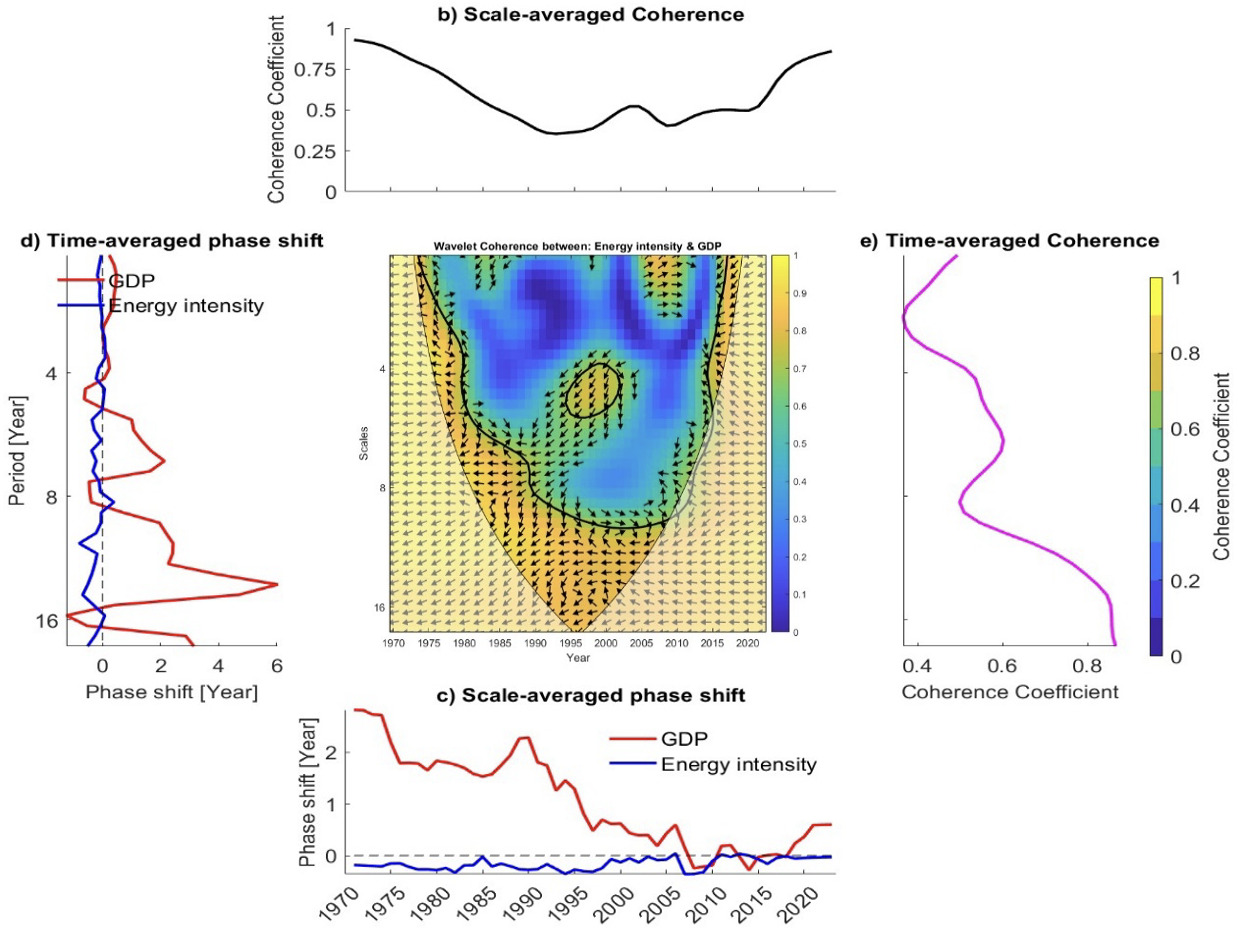
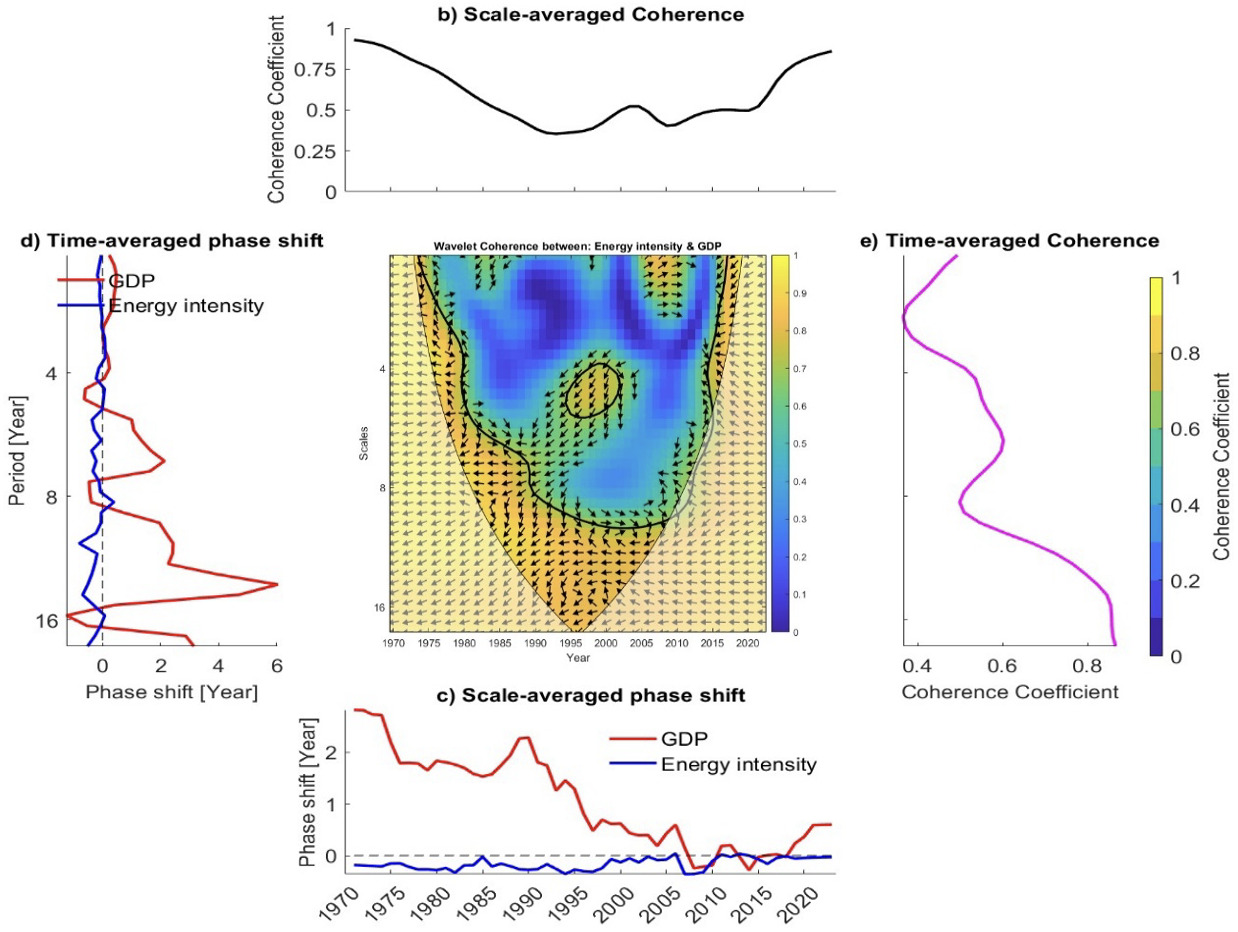
The wavelet analysis results presented in Figures 1, 2, and 3 show a stable negative correlation between GDP and ENI, with a coherence coefficient greater than 0.5, indicating significance (see Panel E of Figure 1). The XWT confirms a strong interaction at medium- and high-frequency bands (8-16 years) and a weak one at low frequencies. The scale-averaged phase shift plot reveals that GDP leads ENI by 0-2 years (see Panel C of Figure 1). Additionally, Panel D of Figure 1 shows a medium lag (4-8 years), with GDP controlling ENI. These findings suggest that GDP growth in Japan leads to reduced ENI, reflecting efforts to decrease energy consumption and waste.
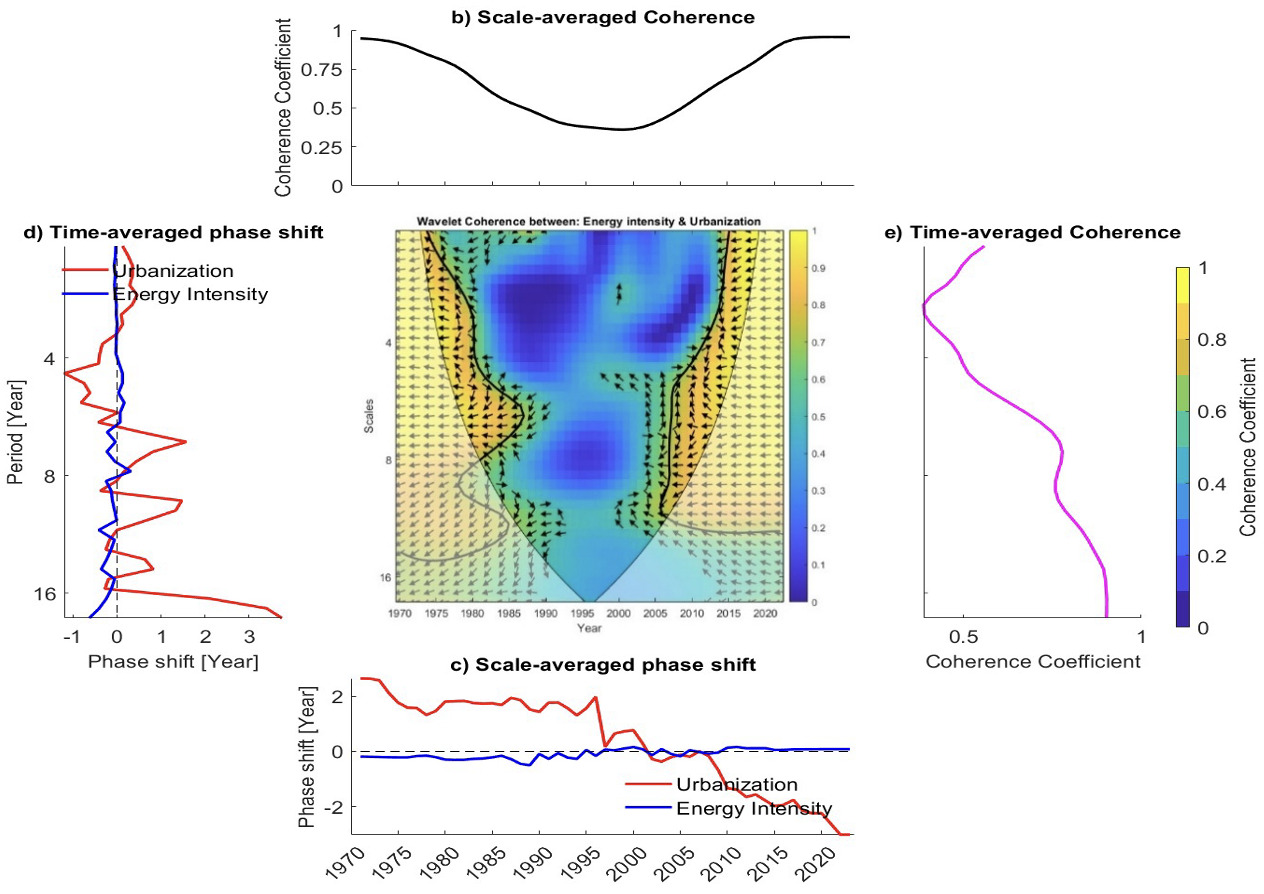
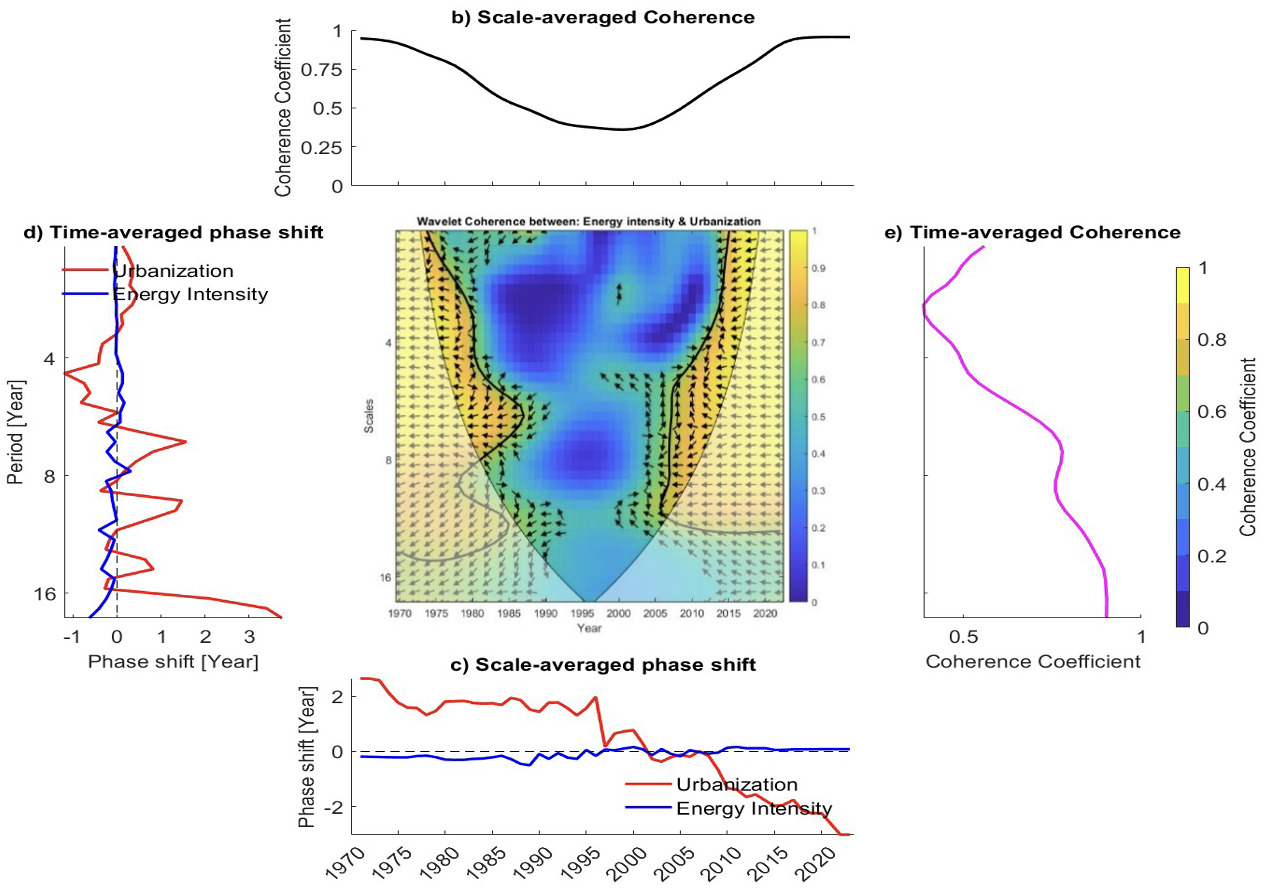
Likewise, Panel A of Figure 2 shows that the interaction between URB and ENI was erratic from 1980 to 2008, but became strongly correlated afterward, with a coherence coefficient of 0.9 during 2008-2022 (see Panel E of Figure 2). The down-left arrows indicate a negative correlation, with ENI lagging. Panel C of Figure 2 reveals minimal lag in shorter cycles (0-2 years), and from 1970-2001, URB dominated, while ENI became the leading variable from 2002 onward. Panel D of Figure 2 shows synchronized behavior between ENI and URB across all time scales. These findings suggest that a growing urban population reduces energy intensity in Japan.
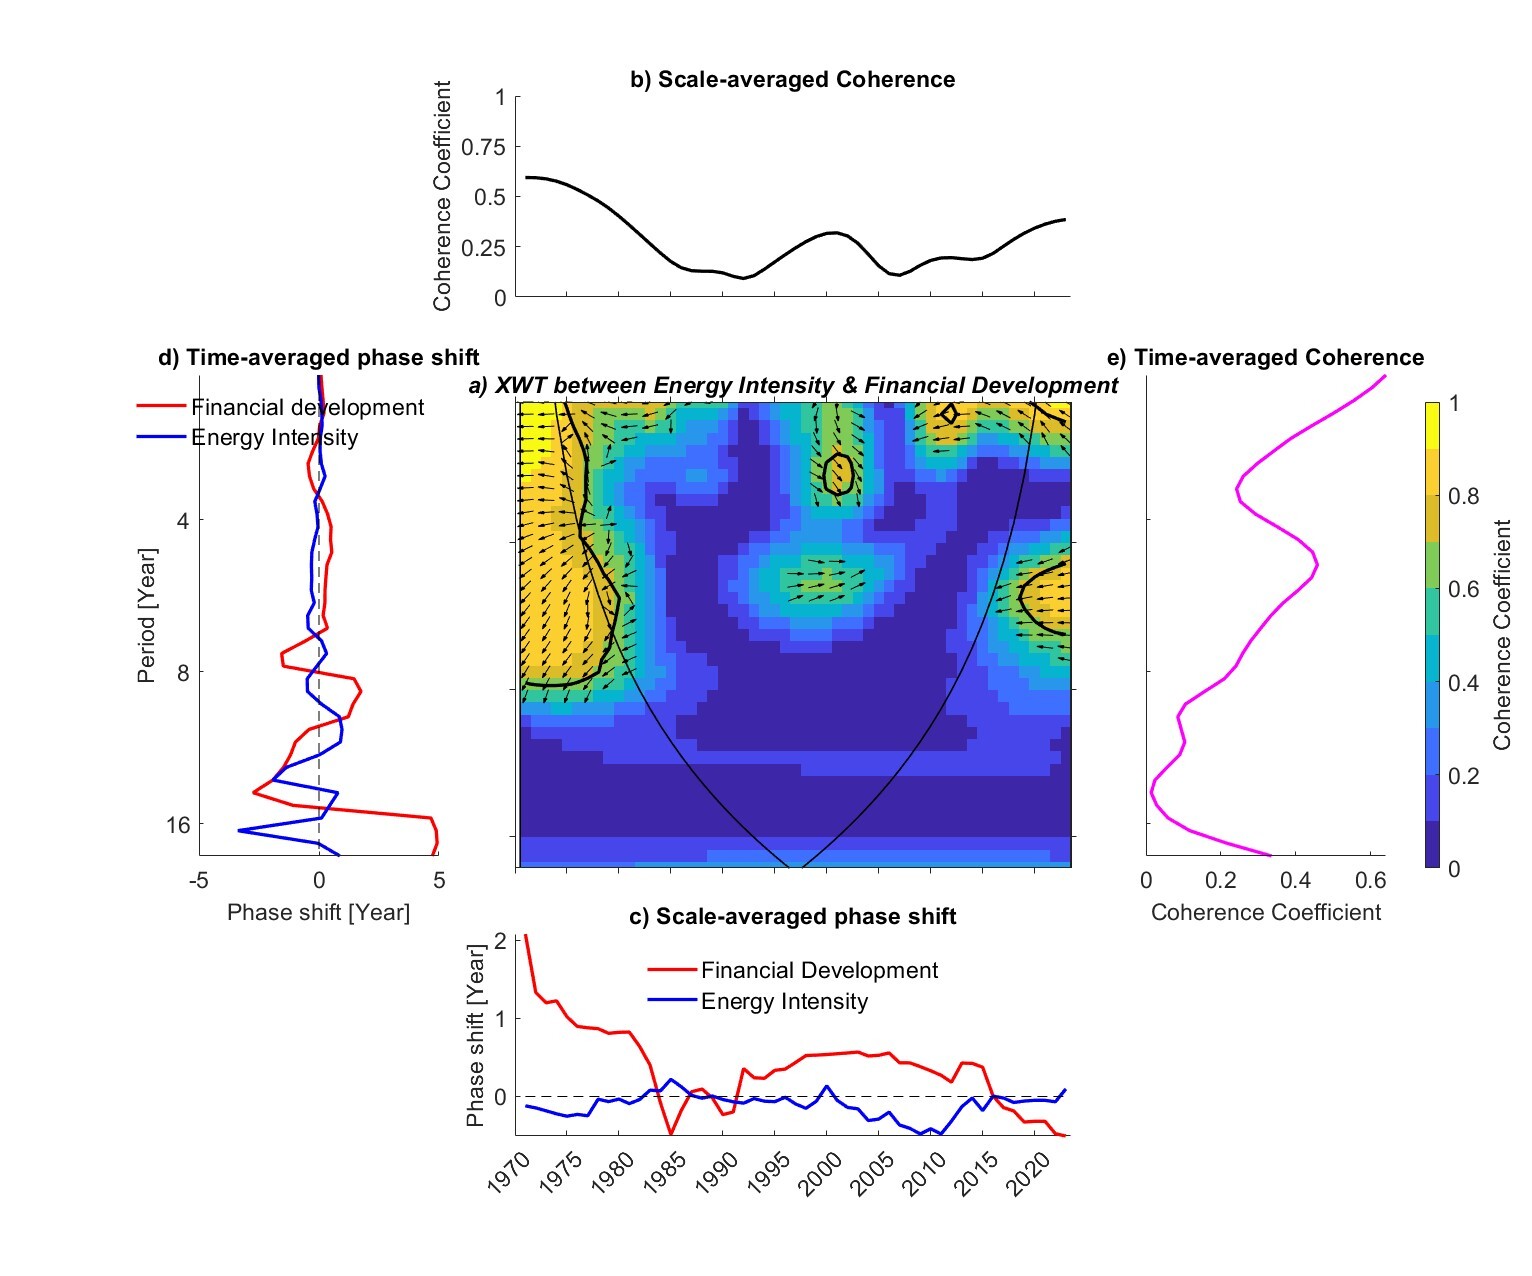
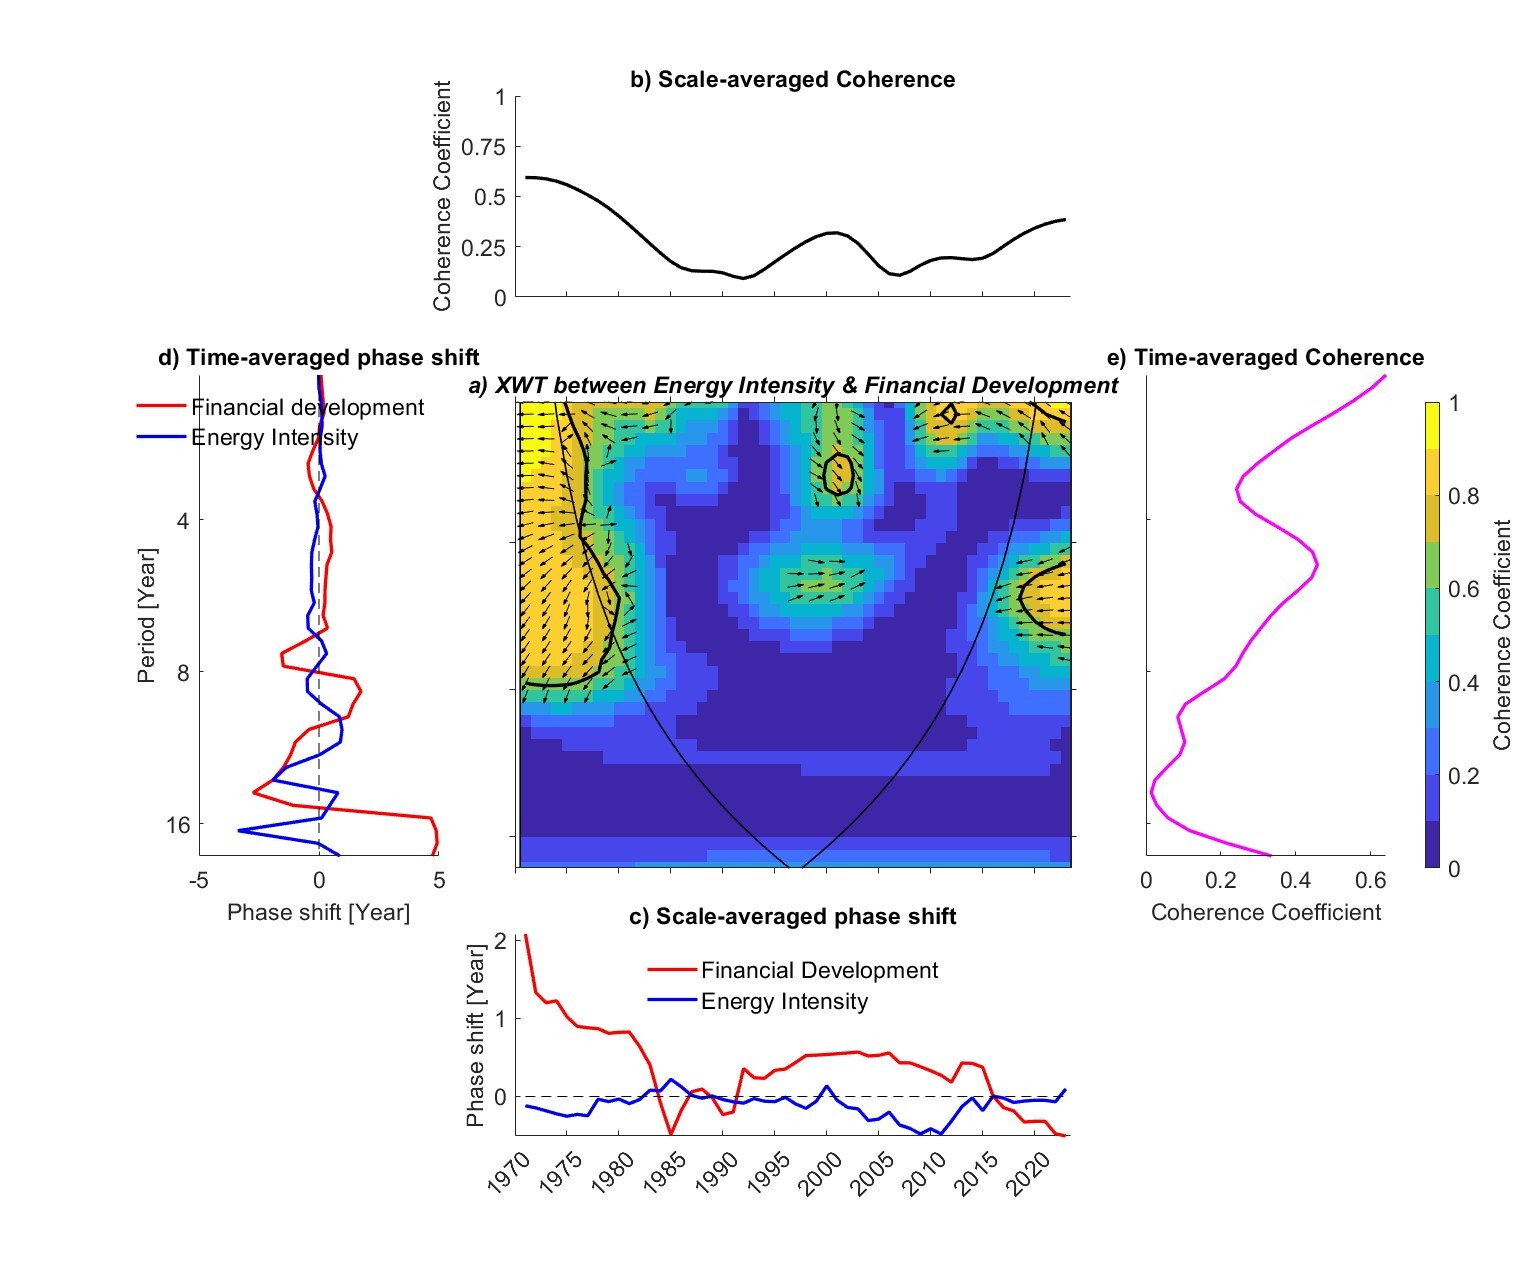
Similarly, the co-movement between ENI and FD is documented in Figure 3. Accordingly, Panel A of Figure 3 shows a light negative correlation between ENI and FD in the short run. In the long run, the relation is insignificant (coherence < 0.5) (see Panel E of Figure 3). The dynamic relationship between ENI and FD is highlighted by varying lag patterns, notably during significant periods from 1993 to 2016. Panel C of Figure 3 indicates that ENI lags behind FD in the cycle shorter than one year throughout the entire period. The co-movement of ENI and FD is confirmed in the short run (0-8 year scales), and there appears to be no significant impact in the medium to long term. Notably, the ENI exhibits a stronger correlation with GDP and URB than with FD. All the above outcomes reveal that FD has contributed less to improving energy efficiency in Japan.
In the next step, the study carried out the wavelet-based Granger causality test introduced by Olayeni (2015) to inspect the causal dependency. The findings (see Table 1) show that there is a bi-directional association between ENI and GDP at all frequencies, except at the 4-8 year scales. Likewise, there is a uni-directional causality running from ENI to URB at medium and high frequencies (> 4-year scales). Table 1 also indicates that the causal relationship between ENI and FD is significant at the low frequency (0-2 year scales).
IV. Conclusion
Using wavelet tools and wavelet-based Granger causality, this study examines the time-frequency links between Japan’s energy intensity and GDP, urbanization, and financial development. Results show a persistent inverse GDP–energy intensity relationship, strongest at 8–16-year scales, with GDP typically leading energy intensity by 0–2 years; evidence of continued decoupling driven by efficiency gains. The urbanization–energy intensity link is initially unstable but turns strongly negative and coherent after 2008.
These patterns suggest that energy-efficient urban infrastructure increasingly reinforces urban growth, consistent with Japan’s smart-city transition. By contrast, financial development is weakly and inconsistently related to energy intensity, implying that finance has played a limited role in decarbonization to date, potentially reflecting cautious investment behavior and the slow scale-up of green finance.
Policy implications: (1) Sustaining the growth–energy decoupling requires continued investment in low-carbon technologies (renewables, high-efficiency equipment, and digital optimization), supported by industrial policy and targeted incentives, especially for SMEs, to speed diffusion of energy-saving innovation. (2) Urbanization can further reduce energy intensity if guided by compact, mixed-use planning and high-quality public transport, which lowers commuting needs, curbs private vehicle reliance, and reduces fossil-fuel use and emissions. (3) Financial development should be repositioned as a driver of the green transition by expanding green finance (e.g., green banks and tax incentives) and strengthening climate-related disclosure to improve transparency and direct private capital toward low-carbon technologies and infrastructure.