
I. Introduction
Various global risk factors disrupt the global economic landscape and introduce uncertainty and volatility into financial markets. Among these, climate policy uncertainty (CPU), geopolitical risk (GPR), and crude oil (CO) market volatility stand out as critical determinants influencing the global economy (Hammed, 2025; Liu et al., 2024; Zhao & He, 2025). The World Bank Report (2024) states that CO markets remain volatile amid uncertainty arising from geopolitical tensions. These elements not only affect individual asset classes but also shape the dynamics of broader financial markets.[1] CPU’s objective of reducing greenhouse gas emissions has substantially spurred the growth of renewable energy and delivered a blow to traditional CO markets (Xiao & Liu, 2023). CPU inhibits CO market movements by raising investor awareness regarding the increase in carbon emissions and environmental degradation (Liu et al., 2024), thereby increasing investments in clean energy industries. GPR arises from political tensions, territorial disputes, power struggles, military conflicts, or diplomatic crises (Caldara & Iacoviello, 2021). Energy commodities, including benchmarks such as West Texas Intermediate (WTI), Brent, OPEC basket, and Dubai COs, hold significant sway over global markets due to their central role in international trade and the global energy supply chain. This, in turn, may create significant challenges for investors and commodity traders in managing and optimising their portfolios.
GPR and CPU significantly influence CO markets’ connectedness by introducing uncertainties in supply and demand (Liu et al., 2024; Xiao & Liu, 2023). Geopolitical tensions, wars, political instabilities, and regional disputes, particularly in major oil-producing areas, raise fears of supply disruptions. This results in higher volatility across energy assets and increases comovements between leading COs in response to external shocks. Investors play a crucial role in this process, reacting by rebalancing their portfolios, tracking haven assets, and affecting volatility spillovers and cross-market interconnectedness. On the other hand, CPU can significantly heighten the ambiguity surrounding future CO consumption and demand (Arouri et al., 2025). Uncertainty regarding emissions regulations, carbon pricing, and energy transitions profoundly affects investment decisions and CO’s long-term pricing (Su et al., 2024). Sudden shifts and high ambiguities in climate policy can prompt energy firms and CO traders to adapt their strategies, potentially strengthening CO markets’ dependencies. Moreover, the financialisation of CO is gaining momentum, with energy assets increasingly perceived as financial assets (Ren et al., 2025). Notably, geopolitical and climate-related news can instigate swift portfolio adjustments, amplifying short- to medium-term CO interlinkages.
From a theoretical standpoint, several arguments underpin the connectedness of global risk factors and oil markets. Like other assets, oil markets incorporate global risk factors such as GPR and CPU into their pricing mechanisms. According to the Capital Asset Pricing Model (CAPM, Sharpe, 1964), oil investors adjust their risk premiums, strengthening the correlations within the oil market. The second framework pertains to contagion theory (e.g., Kaminsky & Reinhart, 2000). In this context, shocks in one energy asset can permeate others, particularly during volatile market conditions characterised by rising geopolitical tensions or increasing uncertainty surrounding climate policies. Additionally, herding behaviour theory (Shiller, 2000) suggests that under extreme market conditions, participants across various regions and energy assets tend to exhibit similar responses, intensifying the synchronisation of oil-related assets and amplifying the interconnectedness of the oil market.
This study presents a novel exploration of the shock transmission between CPU, GPR, and the four leading COs. In doing so, we aim to explore the interconnectedness between the four oil benchmarks, CPU, and GPR. According to Minesso et al. (2023), the reactions of oil prices to GPR could differ when considered in a VAR multivariate framework. One contribution of this paper is to consider both multivariate VAR, quantiles, and frequency dimensions to conduct robust investigations and better assess how oil prices could react. Our investigation delves into how these risk factors affect CO market spillovers and the subsequent implications for portfolio optimisation strategies. We explore three multivariate optimisation strategies: the minimum variance portfolio (MVP), the minimum correlation portfolio (MCP), and the minimum connectedness portfolio (MCnP).
II. Data and Methodology
A. Data
We considered monthly data of four CO prices (WTI, Brent, Dubai, and OPEC) spanning from January 1987 to December 2024. Data is collected from World Bank and OPEC web sites[2]. We also considered monthly data of GPR (Caldara & Iacoviello, 2021) and CPU (Gavriilidis, 2021) indicators[3] obtained from the economic policy uncertainty website[4].
B. Methodology
B.1. The time-frequency quintile vector autoregression (TF-QVAR)
The TF QVAR methodology proposed by Chatziantoniou et al. (2022) is based on the established QVAR framework developed by Ando et al. (2022) and Diebold and Yilmaz (D-Y) (2014). Formally, the frequency response function is as follow: where represents the imaginary unit and is the frequency. The spectral density of the variable at a specific frequency is expressed as the Fourier transform of the infinite-order quantile vector moving average QVMA representation, in accordance with Wold’s theorem:
Sx(ω)=∞∑h=−∞E(xix,t−h)e−iωh=ψ(e−iωh)∑tΨ,(e+iωh)
The spectral density, represented as combines the frequency response function with the standardised generalized forecast error variance decomposition, in accordance with Equation (2):
θij(ω)=(∑τ)−1ij|∑∞h=0Ψh(e−iωh)∑(τ))ij|2∑Πh=0Ψh((e−iωh)∑(τ)Ψ(τ)(eiωh))ij
˜θij(ω)=θij(ω)∑Nk=1θij(ω)
The interconnectedness is captured by consolidating the measures, with a specific range (d=(a,b): a,b a<b, which is given by:
˜θij(d)=∫ba˜θij(ω)dω.
Frequency connectedness is calculated according to D-Y (2014), who identify spillover effects within specific frequency bands, denoted as d:
and
TCI(d)i=N−1N∑i=1TO(d)i=N−1N∑i=1FROM(d)i
Here, TO, FROM, and NET denote spillovers to other elements, spillovers received from other elements, and the net directional spillover, respectively. TCI refers to total connectedness.
B.2. Multivariate portfolios optimisations
The MVP approach aims to achieve the lowest possible volatility by distributing weights across assets based on their variances and covariances. The portfolio weights are given by:
wht=H−1tII′H−1tI
where represents the portfolio weights, is a vector of ones, and is the inverse of the conditional variance-covariance matrix at time The MCP strategy suggested by Christoffersen et al. (2014) shifts the focus from covariances to correlations. The conditional correlation matrix is defined as:
Rt=diag(Ht)−0.5Htdiag(Ht)−0.5
The portfolio weights are calculated using the inverse of the correlation matrix:
wrt=R−1tII′R−1tI
The MCoP focuses on reducing the assets interconnectedness by utilizing pair wise connectedness indices (PCI) instead of the traditional variance-covariance matrix to limit the transmission of systemic risks, making the portfolio more resilient to shocks. The portfolio weights are expressed as follows:
wrt=PCI−1tII′PCI−1tI
where is the inverse of the pairwise connectedness matrix.
The performance of the optimized portfolios is assessed using the hedge effectiveness (HE) and the Sharpe ratio (SR). Hedge effectiveness measures the percentage reduction in the variance of an unhedged position and it is expressed as follows:
HE=1−Var(yp)Var(yunhedged)
where is the variance of the portfolio returns and represents the variance of the unhedged returns. A higher HE value indicates greater risk reduction, reflecting the effectiveness of the hedging strategy. The SR evaluates the portfolio’s returns relative to its risk. It is computed as follows:
SR=ˉrp√Var(rp)
Where is the mean return of the portfolio, and is the variance of the portfolio returns. Higher SR value indicates a better risk-return trade-off.
III. Empirical Results
Descriptive statistics[5] show CPU and GPR have the highest variances, while the J-B test rejects normality for all series. The ESR test confirms all series are stationary.
A. Static quantile connectedness and spillover
Table 1 presents the static connectedness results from the TF-QVAR model. The values shown from top to bottom correspond to total, short-term, and long-term connectedness, respectively. All figures are expressed as percentages.
The total connectedness measures reveal that CO markets, GPR, and CPU are firmly integrated. The TCI indicates strong integration among CO markets, GPR, and CPU, with an overall connectedness of 76.99%. This interconnectedness decreases over time: moderate in the short run (53.54%) and weaker in the long run (23.25%). GPR and CPU show weak shock spillovers across all frequencies, becoming less pronounced from short to long term (between 8% and 9% in the short run and not exceeding 4% in the long run), indicating similar resilience among CO prices to these shocks. CO prices are slightly more resilient to GPR shocks than to CPU shocks. WTI and Dubai oils are particularly vulnerable to both GPR and CPU shocks, given their overall connectedness. Over the short term, shock transmission is weak, averaging around 5% for GPR and 6% for CPU. Brent and Dubai CO are the most exposed to GPR shocks, while WTI and Brent react similarly to CPU shocks. In the long run, OPEC and Dubai are the most impacted by GPR shocks, while OPEC and Dubai are also the most affected by CPU shocks. Overall, GPR and CPU have comparable impacts on all four CO prices. OPEC and WTI experience the highest effects from these shocks.
B. Dynamic quantile connectedness and spillover
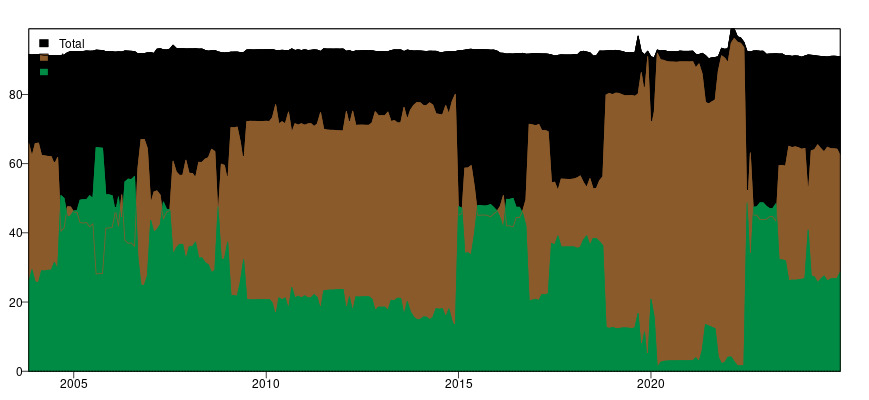
Figure 1 portrays the three dynamic connectedness for the lower quantile (q=0.05)[6] which reflects the time and frequency behaviours during the bearish market condition.
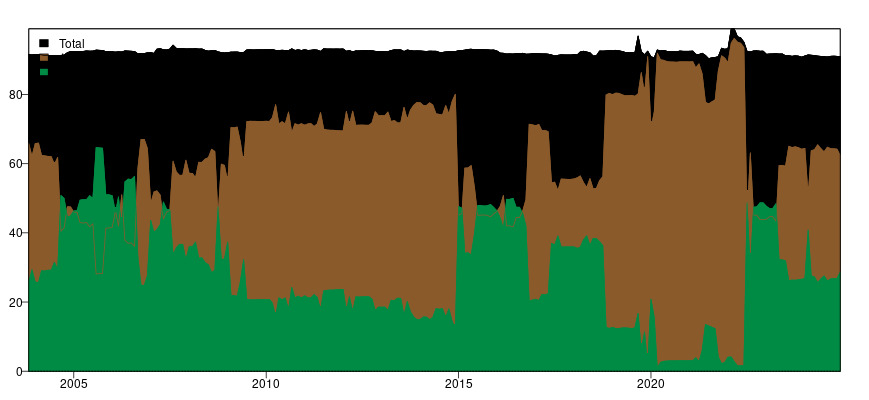
We note that the amplitudes of total connectedness are higher than those observed in the short and long run. Both short- and long-term connectedness exhibit a sequence of booms and busts throughout the entire period, indicating several short-lived, abrupt change. The continuum of peaks and troughs testifies to the persistence of the intrinsic adjustments governing oil prices. For instance, the short-run dynamics (maroon-coloured curves) show that market integration sharply increased at the end of 2019, with amplitudes surpassing 80%. This demonstrates that CO prices reacted rapidly during the COVID-19 health crisis, and this reaction persisted until the Russian-Ukraine invasion.
C. Multivariate portfolio optimization
Table 2 highlights multivariate portfolio optimisations: minimum variance (top), minimum correlation (middle), and minimum connectedness (bottom).
The average optimal weights are presented in Column 1, indicating the proportions that should be allocated to each specific CO. Hedging effectiveness is accompanied by its respective p-value. For the MVP portfolio, an allocation of 2% in OPEC oil results in a 17% reduction in overall portfolio volatility. In contrast, higher allocations to Brent (15%), WTI (45%), and Dubai (38%) yield minimal impact on total portfolio risk, as evidenced by lower hedging effectiveness values (ranging from 6% to 11%) and elevated p-values (between 0.21 and 0.53). Consequently, investing in OPEC appears more advantageous for investors compared to other COs. This observation is corroborated by the MCP and MCoP models, which demonstrate similar outcomes—specifically, allocating 1% to OPEC could reduce total risk by 11%. However, achieving comparable reductions with Dubai (40%), WTI (38%), and Brent (20%) requires substantially higher weights and does not meet the objective of minimizing correlations or spillover effects, given persistently high p-values and low hedging effectiveness. It is important to exercise caution when prioritizing OPEC over other COs, particularly for risk-averse investors during periods of market stress.
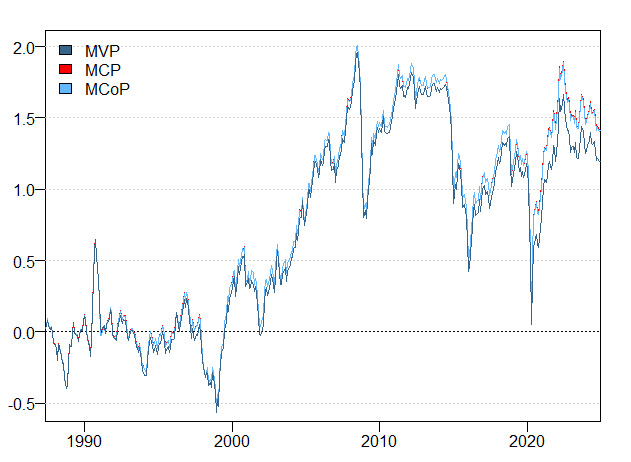
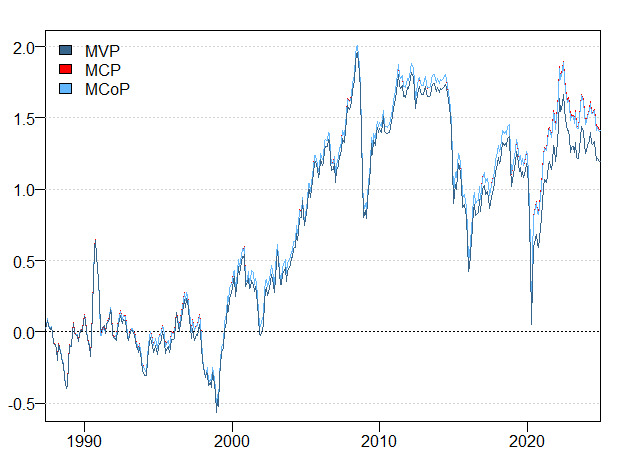
Figure 2 illustrates the dynamics of cumulative returns for the three strategies, showing that the curves follow similar patterns throughout the entire period. The cumulative returns shifted from negative to positive values around 2000, subsequently following an upward trend. However, a significant decline occurred during the 2008 global financial crisis. The cumulative returns dropped to their lowest points in early 2020, but then surged again, reaching their peak around 2022. The substantial declines triggered by these crises are clearly reflected in the negative estimates of the SR.
IV. Conclusion
This study examines the influence of two global risk factors—geopolitical risk and climate policy uncertainty—on the connectivity of crude oil (CO) markets through the application of the TF-QVAR methodology. The analysis also assesses the effectiveness of three portfolio minimization strategies. Results reveal that total connectedness within the CO market is more significant in short-term horizons, while both short- and long-term connectedness demonstrate cyclical periods of rapid change, suggesting the presence of multiple brief fluctuations. Notably, market integration among COs intensified sharply at the end of 2019, with amplitudes surpassing 80%, indicating a swift response during the COVID-19 pandemic that persisted until the onset of the Russia-Ukraine conflict. These findings facilitate the evaluation of MV, MCP, and MConP portfolio strategies, emphasizing that allocating 1% to OPEC assets within MCP and MConP frameworks accounts for 11% of overall portfolio risk. Conversely, higher asset allocations may be necessary to further mitigate CO correlation or spillovers without fully achieving the intended objective. The outcomes offer valuable guidance for commodity portfolio managers seeking to make informed decisions amid volatile market environments.
Acknowledgement
The second author would like to thank Prince Sultan University for their support.
Navigating the challenges of U.S. port security | Kpler - Jul 26, 2024. https://www.kpler.com/blog/navigating-the-challenges-of-u-s-port-security.
Gavriilidis, K. (2021). Measuring Climate Policy Uncertainty. Available at SSRN: https://ssrn.com/abstract=3847388.
For space scarcity, the descriptive statistics are not reported but are available upon request from the corresponding author.
We only reported the results of the lower quantile since it encircle the shock propagations during stress full times and also to preserve space. The results for the middle and upper quantiles are available on request.