
I. Introduction
Climate change, primarily driven by fossil fuels, contributes around 70% of annual greenhouse gas emissions and 90% of CO2 emissions (United Nations, 2022) and is being aggravated by rapid industrialization in both OECD and developing countries (Lin & Omoju, 2017). The IPCC (2022) emphasizes that the transition towards clean energy is essential to limit global warming and unlock advantages such as employment generation and enhanced energy security. This “Energy transition” – substituting fossil fuels with cleaner renewable sources like wind, solar, biofuel, hydrogen, etc. (Harichandan et al., 2022) – also influences human mobility. Hence, net migration is increasingly affected by environmental factors besides traditional socio-economic determinants (World Bank, 2018).
The interaction between energy transition and migration patterns operates through multiple pathways. Global warming driven by burning fossil fuels creates environmental pressures that can trigger migration (IPCC, 2022; IOM, 2022). Similarly, transitioning to renewable energy acts as a pull factor for migration by creating new economic opportunities and improving the standard of living (Ram et al., 2019; United Nations, 2022). Renewable energy-fed electrification also improves services, infrastructure and rural prosperity, further attracting migrants while reducing rural push factors (Bhattacharya et al., 2015; Fried & Lagakos, 2021; Melkior et al., 2018) and shaping broader migration patterns (Łukaniszyn-Domaszewska et al., 2025).
Environmental quality also affects migration decisions, as higher renewable energy consumption reduces CO2 emissions and improves livability (Koengkan et al., 2020). In climate-vulnerable regions, environmental factors are increasingly shaping migration decisions (World Bank, 2018). Nevertheless, economic factors largely drive migration, with per capita GDP positively and unemployment negatively affecting net migration (Urbański, 2022). However, the interaction between these traditional economic factors and emerging environmental determinants of migration needs further investigation.
Although scholarly attention to the interlink between renewable energy and economic development has been intensified, its impact on migration outcomes remains unexplored. This study examines how renewable energy transitions affect net migration while accounting for traditional socio-economic indicators, using the Panel Autoregressive Distributed Lag (PARDL) methodology across 61 countries from 2000-2023. The aim is to assess both short-run and long-run relationships by hypothesizing that the renewable energy transition effect on net migration is mediated by both environmental and economic factors.
The remainder of the paper is organized as follows. Section II presents the data and methodology, followed by a discussion of the main findings in Section III. The final section concludes the paper.
II. Data and Methodology
A. Data
The current study employs an annual panel dataset for 61 countries from 2000-2023, selected according to data availability. These countries include: Algeria, Argentina, Australia, Austria, Azerbaijan, Bangladesh, Belarus, Belgium, Brazil, Canada, Chile, China, Colombia, Croatia, Czechia, Denmark, Ecuador, Egypt, Estonia, Finland, France, Germany, Greece, Hungary, Iceland, India, Indonesia, Iran (Islamic Republic), Iraq, Ireland, Italy, Japan, Kazakhstan, Latvia, Lithuania, Luxembourg, Malaysia, Mexico, Morocco, Netherlands, New Zealand, North Macedonia, Norway, Pakistan, Peru, Philippines, Poland, Portugal, Romania, Slovak Republic, South Africa, Spain, Sri Lanka, Sweden, Switzerland, Thailand, Türkiye, Ukraine, United Kingdom, United States, Vietnam. The outcome variable for this study is net migration (NM), and the main explanatory variables comprise renewable energy transition indicators such as share of renewable energy consumption (SRN), renewable electricity per capita (REPC), and energy intensity (EI). Additionally, GDP per capita (GDPPC), urbanization rate (UR), unemployment rate (UE), and carbon dioxide emissions (CO2) are utilized as control variables (see Table 1). All variables are transformed into natural logarithms for analysis.
B. Model specification
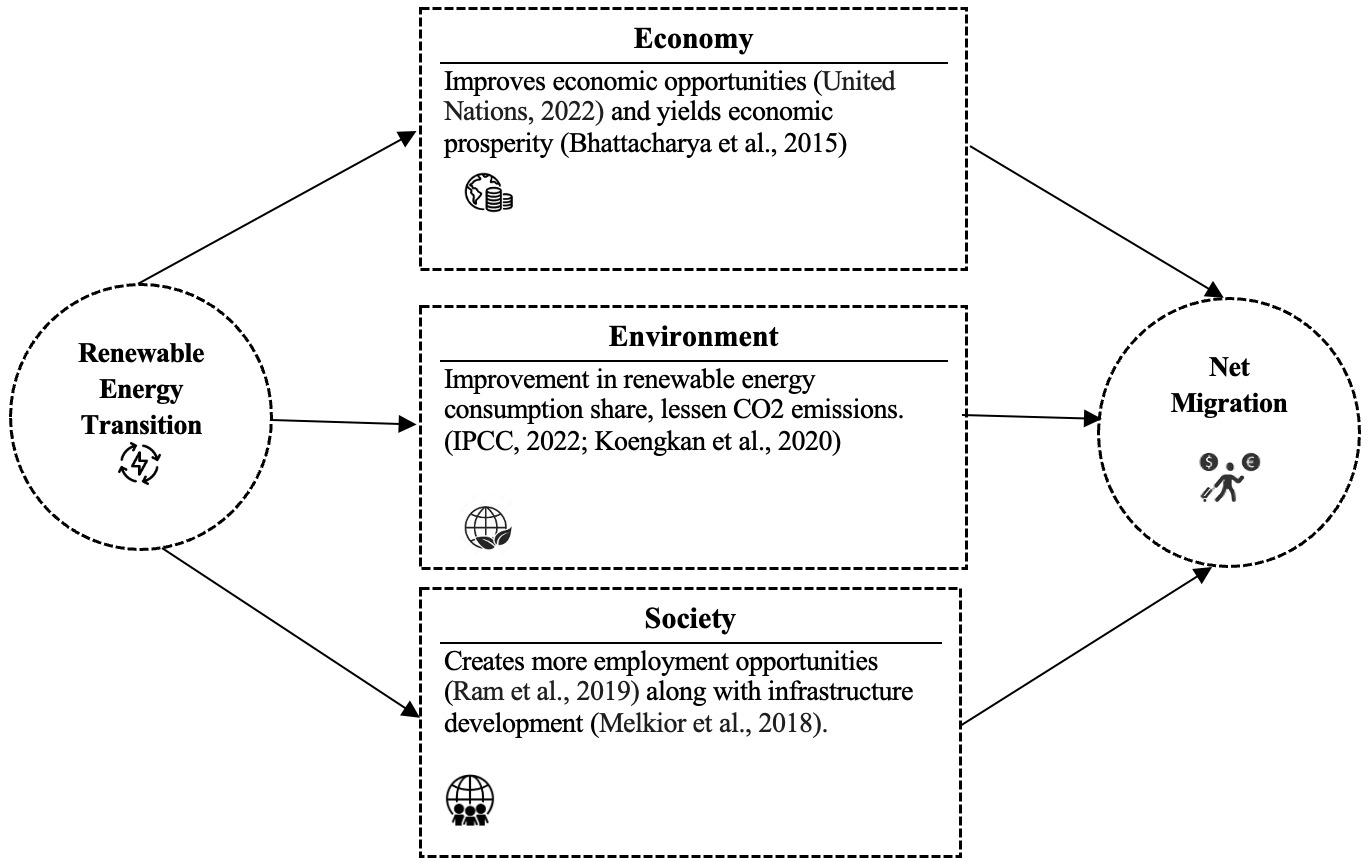
Figure 1 briefly illustrates how the transition to renewable energy influences net migration through three key pathways, namely economic, environmental, and societal—by enhancing opportunities, reducing carbon emissions, and improving infrastructure and employment outcomes. It highlights the interconnectedness of these multidimensional factors in shaping migration trends.
The study utilizes the following model to assess the connection between net migration and renewable energy transition:
lnNMit=β0+β1lnSRN+β2lnREPC+β3EI+β4lnGDPPC+β5lnUR+β6lnUE+β7lnCO2+εit
where represents time and represents the error term. For evaluating the above model, we employ the panel ARDL approach, which is not only effective in analyzing short-term fluctuations and long-term relationships among variables, but is also particularly useful when there is a mixed order of integration and potential cross-sectional dependence.
The PARDL long-run equation is specified as:
ΔNMit=α1+p∑k=1βijNMit−j+q∑k=0δijθit−j+εit
where and represent cross-sectional unit and timeframe, respectively. is the intercept term, is the autoregressive (AR) term, which captures the lagged effects of NM, is distributed lag of explanatory variables like GDPPC, etc., and are the coefficients, is the error term, is maximum lag, shows the lag of independent variables. and are the lag order.
The PARDL short-run equation is specified as:
ΔNMit=φi+p∑k=1XijΔNMit−j+q∑k=0YijΔθit−j+∅ijECTt−i+εit
where ECT signifies error correction term. is the convergence from long-run to short-run equilibrium.
Further, the study uses bias-adjusted Langrange multiplier (LM) test and the Pesaran cross-sectional dependence (CD) test, to check for the cross-sectional dependence among panels. To assess the stationarity of the variables, the cross-sectionally augmented Im-Pesaran-Shin (CIPS) unit root test is applied. We also conducted the Durbin-Wu-Hausman test, which shows that the model is free from endogeneity concerns. The model incorporated one lag per variable, selected using a general-to-specific approach based on parsimony and statistical significance, consistent with the panel ARDL framework.
III. Results
Table 2 presents the CSD & CIPS test statistics along with diagnostic tests. Cross-sectional dependence is confirmed for all variables. The CIPS test shows that lnSRN, lnREPC, lnGDPPC, lnUR, and lnUE are nonstationary at levels (i.e., I(1)), yet stationary in first differences (i.e., I(0)), confirming the presence of unit roots; while lnNM, lnEI, and lnCO2 exhibit stationarity at levels (i.e., I(0)). This mixed order of stationarity justified our model selection and also indicates the likely presence of cointegration. The poolability test result indicates heterogeneity across countries and justifies the use of a panel method that accounts for heterogeneity rather than pooled OLS. The Wooldridge test result suggests that our model does not suffer from significant serial correlation issues. The modified Wald test result validates the existence of heteroscedasticity across panels. The Hausman test confirms the fixed effects specification. Lastly, the Durbin-Wu-Hausman test result indicates no endogeneity concern.
The Panel ARDL results given in Table 3 indicate that SRN and REPC are both positively and significantly associated with higher NM, likely because cleaner and more sustainable regions attract more migrants (Łukaniszyn-Domaszewska et al., 2025). Similarly, EI also has a significant positive influence on NM, suggesting that countries with high reflecting greater industrialization and manufacturing activities as well as higher employment opportunities, are more likely to attract migrants. This is in alignment with Environmental Migration Theory and the New Economics of Labour Migration theory (Stark & Bloom, 1985). Expectedly, the UE is found to have a significant negative long-run effect, indicating that higher unemployment in a host country discourages immigration, which aligns with the push-pull theory of migration (Lee, 1966). GDPPC is found to be positively related to NM (Jennissen, 2003), albeit insignificant for the sample countries. The UR does not exhibit statistically significant effects in the long run, implying that other structural or environmental factors may play a more decisive role in influencing migration patterns.
In the short run, except for CO2 emissions, all other explanatory variables are found to be insignificant in their interaction with migration. CO2 is found to be positively related to NM, possibly suggesting that short-run economic booms might temporarily attract migrants. Furthermore, the negative error correction term is found to be significant at the 5% level, indicating a stable long-run relationship among variables.
Additionally, we’ve conducted a robustness check, employing sub-sample analysis, in which we considered 20% of countries from each income group category (high income, lower- and upper-middle income), which further confirms the direction of our main findings.
To substantiate the long-run relationships established through the PARDL framework, we employed a suite of complementary panel cointegration tests, i.e., Pedroni (2004), Kao (1999), and Westerlund (2007). As presented in Table 5, the uniform refutation of the null hypothesis indicates strong evidence for a stable long-run equilibrium among the variables. These findings enhance the credibility and robustness of the primary PARDL estimates.
IV. Conclusion
The findings confirm that the share of renewable energy, renewable electricity per capita, and energy intensity positively impact net migration. Among the socio-economic variables, GDPPC is found to positively influence NM, while factors like CO2 emissions, the unemployment rate, and the urbanization rate negatively affect migration. To address regional disparities in migration, policymakers and stakeholders should leverage energy transitions and promote sustainable development. In developing nations, subsidies and credit schemes for solar and wind facilities can help create employment opportunities, and expanding vocational training in collaboration with renewable energy firms will equip workers with installation and maintenance skills, promoting inclusive green jobs. Developed economies should improve their energy infrastructure and invest in innovation clusters to attract skilled migrants and support long-term urban growth. Carbon pricing and emissions trading can curb CO2 emissions and climate-induced displacement. More importantly, region-specific renewable investments can bridge regional disparities and alleviate migratory pressures.