I. Introduction
Angelini et al. (2025) introduce the climate concern index (CCI), which measures public perceptions of climate change using disaggregated Google search data. Their findings indicate that the macroeconomic implications of perceived climate risk extend beyond environmental preferences. Higher public climate concern is associated with declines in employment and private consumption, reflecting behavioural adjustments in spending and investment decisions. It is also linked to greater stock market volatility, underscoring its potential contribution to systemic financial risk.
The relationship between energy consumption and economic activity is commonly framed through the growth and feedback hypotheses (Payne, 2009), which emphasise their mutual interdependence. Within this context, heightened public climate concern may propagate through macroeconomic–energy linkages by shaping demand expectations, investment in carbon-intensive sectors, and regulatory outlooks. Since fossil energy demand remains closely tied to macroeconomic conditions, these behavioural adjustments can affect energy price dynamics through shifts in demand and transition-related risk premia.
Recent empirical studies emphasise the role of uncertainty measures such as climate policy uncertainty (CPU) and geopolitical risk (GPR) (e.g., Liu et al., 2025), economic policy uncertainty (EPU) (e.g., Khan et al., 2026), and ESG-related uncertainty (Qin et al., 2025) in shaping oil and natural gas price dynamics. While these factors capture institutional and geopolitical transmission mechanisms, public climate concern represents a distinct behavioural channel of shock transmission. Unlike policy or geopolitical risks, which are largely episodic and top-down, public climate concern reflects a bottom-up, socially diffused perception of climate risk. It influences consumption, investment, and regulatory expectations (Angelini et al., 2025), thereby transmitting to energy markets through behavioural adjustments (Matiiuk & Liobikienė, 2023) and changes in investor risk perceptions toward fossil-fuel-intensive assets.
Against this background, this paper examines the interdependencies between public climate concern and fossil energy price dynamics using the time-varying parameter vector autoregression (TVP-VAR) connectedness framework of Antonakakis et al. (2020). The analysis focuses on interdependencies and transmission intensities across behavioural, policy, geopolitical, and energy price variables within a unified framework. The United States (U.S.) is selected because of its central role in the global economy, the continued dominance of oil and natural gas in its energy mix, and the availability of an established measure of public climate concern (Angelini et al., 2025). Specifically, the study analyses interactions among CCI (Angelini et al., 2025), CPU (Gavriilidis, 2021), EPU (Baker et al., 2016), GPR (Caldara & Iacoviello, 2022), and WTI crude oil and Henry Hub natural gas prices (Liu et al., 2025).
This paper makes three contributions to the literature. First, it identifies public climate concern as an autonomous behavioural channel of shock transmission in U.S. fossil energy price dynamics, thereby extending research beyond policy and geopolitical sources of uncertainty. Second, it reveals asymmetric spillover effects, with natural gas prices receiving stronger transmissions from public climate concern than crude oil prices, consistent with its role as a transition fuel (Gürsan & de Gooyert, 2021). Third, it provides a unified framework for assessing interdependencies across behavioural, policy, geopolitical, and energy price variables, offering new insights into the relative transmission role of public climate concern.
The paper proceeds as follows. Section II describes the data and methodology. Section III presents the empirical results. Section IV concludes.
II. Data and Methodology
A. Data
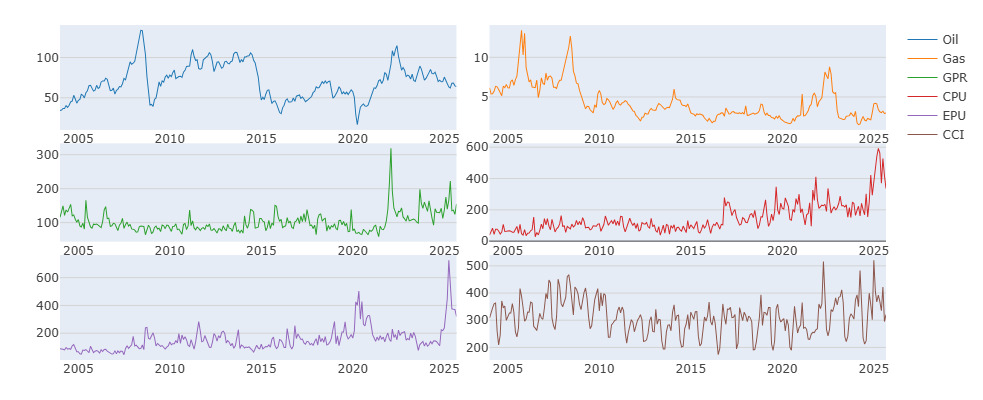
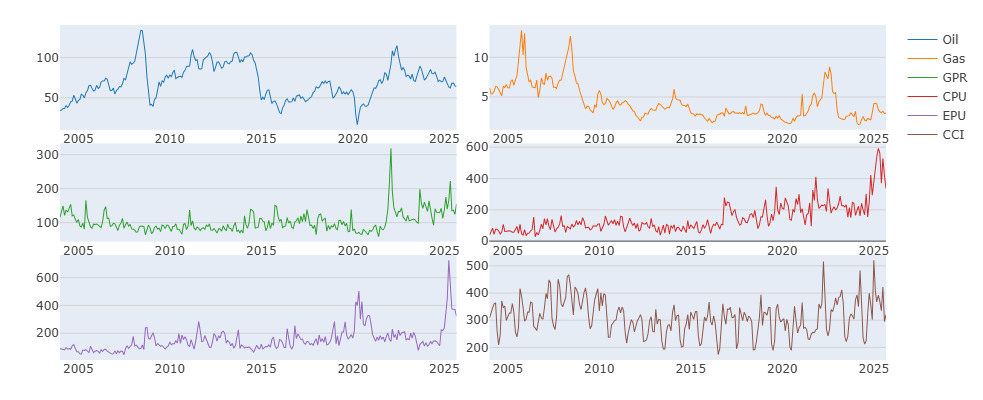
Spot prices are used as the baseline measure of fossil energy price dynamics (Liu et al., 2025), as they reflect realized market-clearing conditions and are conceptually consistent with the contemporaneous behavioural nature of the CCI. The analysis employs monthly data from January 2004 to September 2025. Oil and natural gas prices are obtained from the Federal Reserve Bank of St. Louis (FRED), while GPR, EPU, CPU, and CCI indices are sourced from the PolicyUncertainty.com database. Figure 1 illustrates the time-series evolution of the variables over the sample period.
To ensure econometric robustness, all variables are transformed into logarithmic differences. Preliminary diagnostics, reported in Table 1, indicate that oil and natural gas returns deviate significantly from normality, exhibiting skewness and excess kurtosis consistent with asymmetric, fat-tailed distributions. The Jarque–Bera statistics confirm the rejection of normality for all series. Significant Q(10) and Q2(10) statistics indicate serial correlation and conditional heteroscedasticity. The ERS unit root test confirms stationarity, supporting the suitability of the transformed series for TVP-VAR connectedness estimation.
B. Methodology
The TVP-VAR framework extends the connectedness methodology of Diebold and Yılmaz (2014) by embedding it within a time-varying parameter VAR estimated via a Kalman filter with forgetting factors, following Koop and Korobilis (2014).
The TVP-VAR (p) model is given as follows:
yt=Φ1tyt−1+Φ2tyt−2+…+Φptyt−p+ϵtϵt∼N(0,Σt)
where is an vector of endogenous variables, denotes time-varying coefficient matrices, and is the time-varying variance–covariance matrix. Using the Wold representation, the model is expressed as a TVP-VMA process, approximated over a finite horizon, The generalized forecast error variance decomposition (GFEVD), which captures the impact of shocks in variable on the forecast error variance of variable is defined as:
˜Cijt(H)=Cijt(H)∑Nk=1Cijt(H)
where represents the effect of shocks in variable on the forecast error variance of variable at horizon
These variance shares are used to construct standard connectedness measures, including total directional connectedness (TO and FROM), net total directional connectedness (NET), net pairwise directional connectedness (NPDC), and the total connectedness index (TCI), defined as follows:
TCIt(H)=N−1N∑i=1TOit(H)=N−1N∑i=1FROMit(H)
III. Empirical Findings
A. Averaged connectedness
The static connectedness results reported in Table 2 show a TCI of 10.91%, indicating that approximately 11% of the system’s forecast error variance is driven by cross-variable spillovers (Diebold & Yılmaz, 2014).
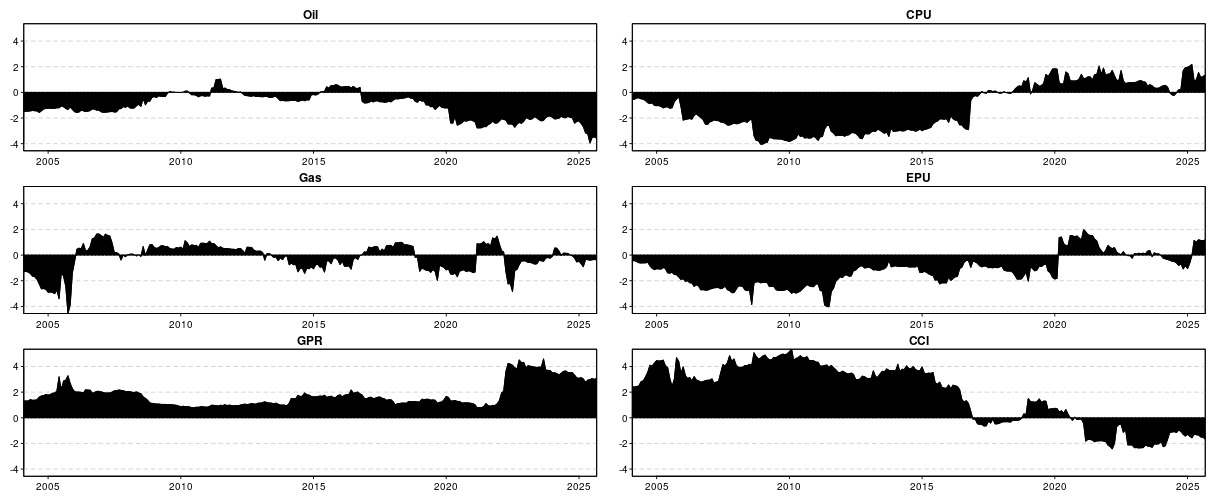
CCI exhibits a positive net spillover (NET = 1.82), positioning it alongside GPR (NET = 1.80) as one of the strongest net transmitters. Its outward spillover (TO = 10.38%) is comparable to oil and only slightly lower than gas, underscoring its substantial transmission capacity. These results suggest that public climate concern operates as a behavioural channel of shock transmission within the network, consistent with the findings of Angelini et al. (2025). Importantly, CCI’s spillovers are asymmetric across oil and gas. The transmission from CCI to gas (3.91%) is substantially stronger than to oil (0.09%), highlighting natural gas’s closer association with climate transition narratives and decarbonisation expectations (Gürsan & de Gooyert, 2021; Safari et al., 2019). Spillovers from oil and gas to CCI remain limited: oil (0.31%) and gas (1.76%) explain only a small share of its forecast error variance, suggesting that public climate concern is not primarily driven by contemporaneous energy price movements. Instead, CCI receives stronger spillovers from geopolitical risk (5.02%), while linkages with CPU (0.52%) and EPU (0.94%) remain weak. This is further supported by CCI’s relatively low FROM spillover (8.56%), compared with oil (11.21%), gas (11.40%), CPU (12.57%), and EPU (14.87%). Although conceptually related, CCI and CPU exhibit distinct connectedness profiles, indicating that public climate concern operates independently of policy-driven climate uncertainty. Accordingly, public climate concern functions as an autonomous behavioural channel of shock transmission within the system.
Oil emerges as a net receiver of shocks (NET = −1.04), indicating that it absorbs more spillovers from the system than it transmits. Its forecast error variance is driven primarily by EPU (4.10%), with smaller contributions from GPR (0.67%) and CPU (0.43%), while spillovers from CCI (0.09%) remain minimal. These findings reinforce the importance of macroeconomic policy in shaping oil price dynamics (Gu et al., 2021). Consistent with the growth and feedback hypotheses, the close link between oil demand and economic activity implies that policy-driven shocks transmit directly to oil prices.
EPU emerges as the dominant spillover transmitter (TO = 13.72%) and the largest absorber of shocks (FROM = 14.87%), underscoring its central role in the network, despite being a marginal net receiver (NET = −1.15).
B. Dynamic connectedness
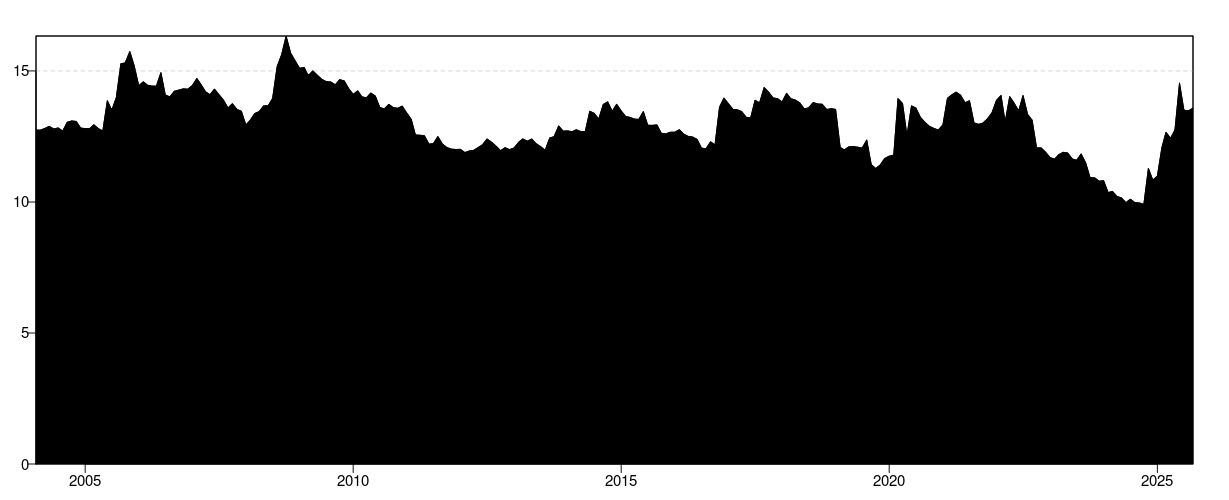
Figure 2 illustrates pronounced time variation in connectedness. Periods such as the Global Financial Crisis, the COVID-19 pandemic, and the Russia–Ukraine conflict coincide with intensified spillovers, while relatively stable macroeconomic conditions are associated with lower interconnectedness. The renewed increase in the TCI in 2025 aligns with heightened geopolitical tensions and climate-transition uncertainty during Donald Trump’s second presidential term (Deberdt et al., 2025), suggesting that elevated transition-related uncertainty may have amplified system-wide interdependencies.
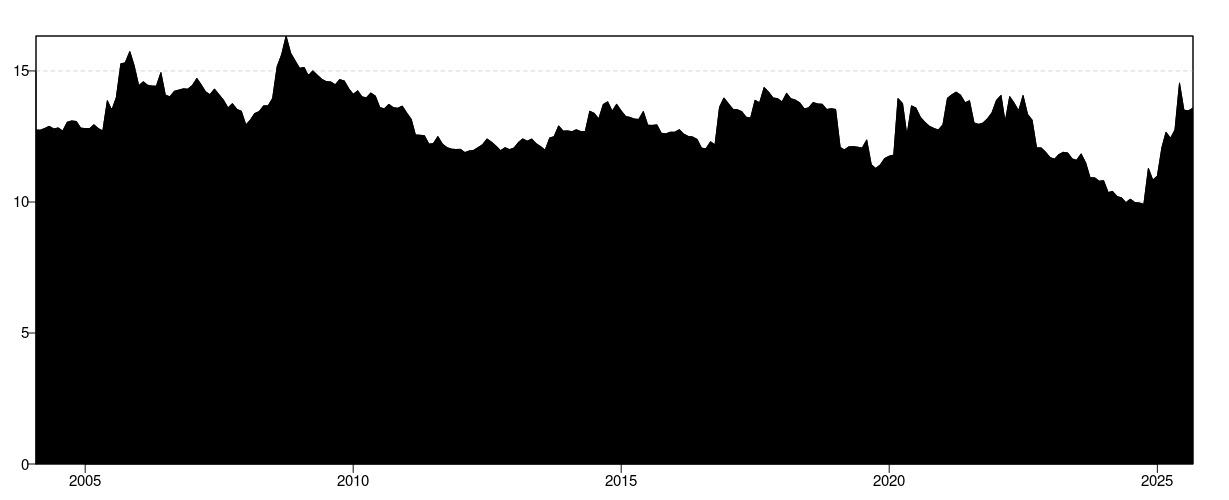
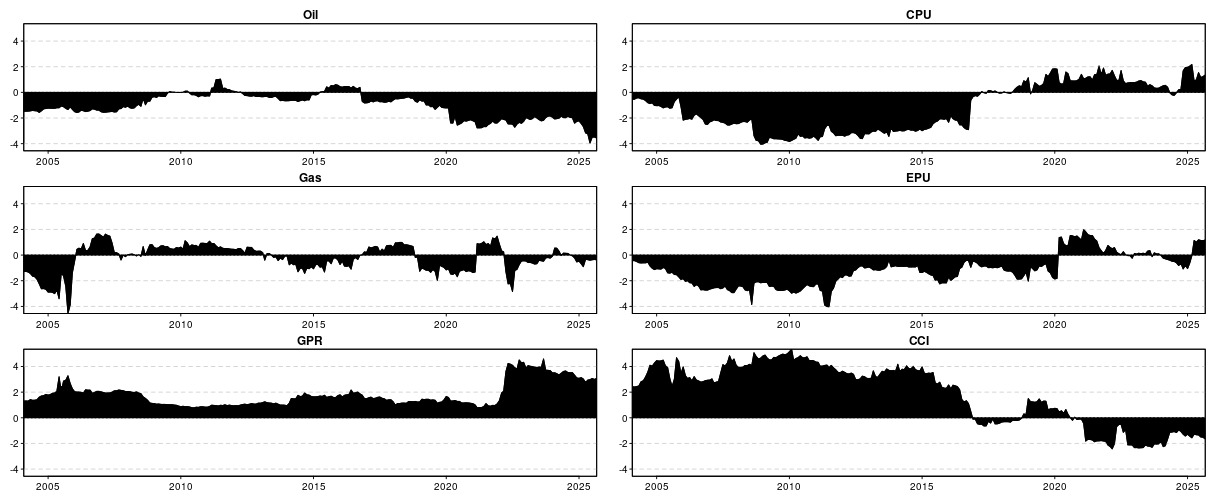
Figure 3 illustrates the time-varying dynamics of CCI’s net spillover position. CCI appears as a net transmitter during the pre-Paris Agreement period and briefly in the early phase of COVID-19. In contrast, during the later pandemic period and the Russia–Ukraine conflict, it shifts to a net receiver position. These patterns suggest that public climate concern acts as an autonomous transmission channel, but its influence changes over time.
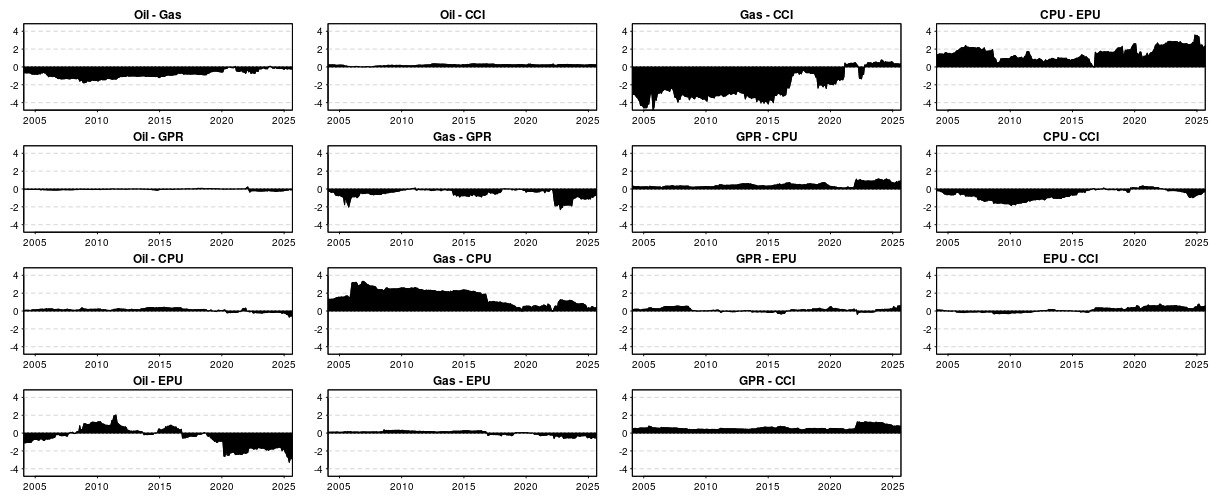
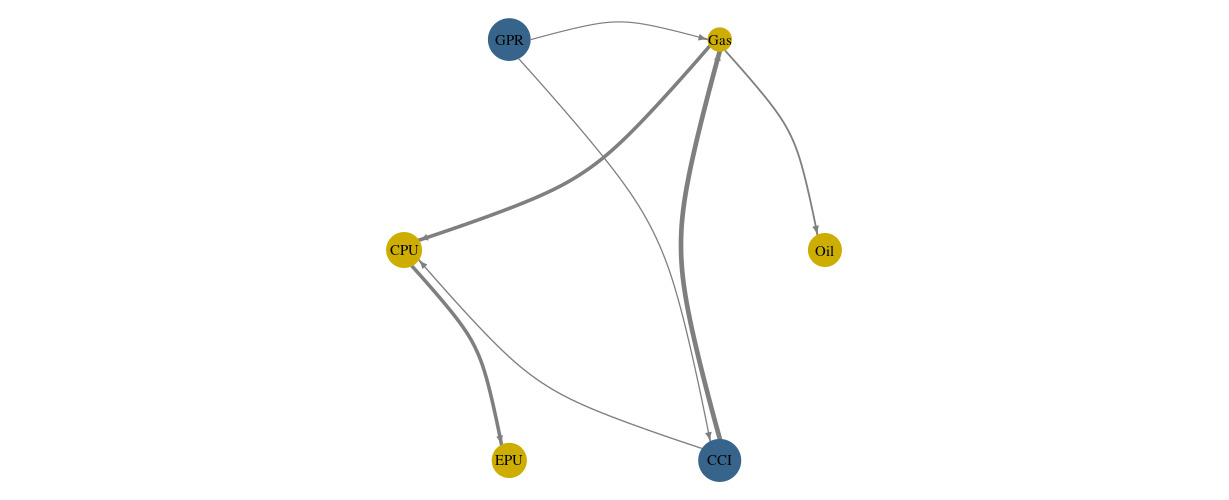
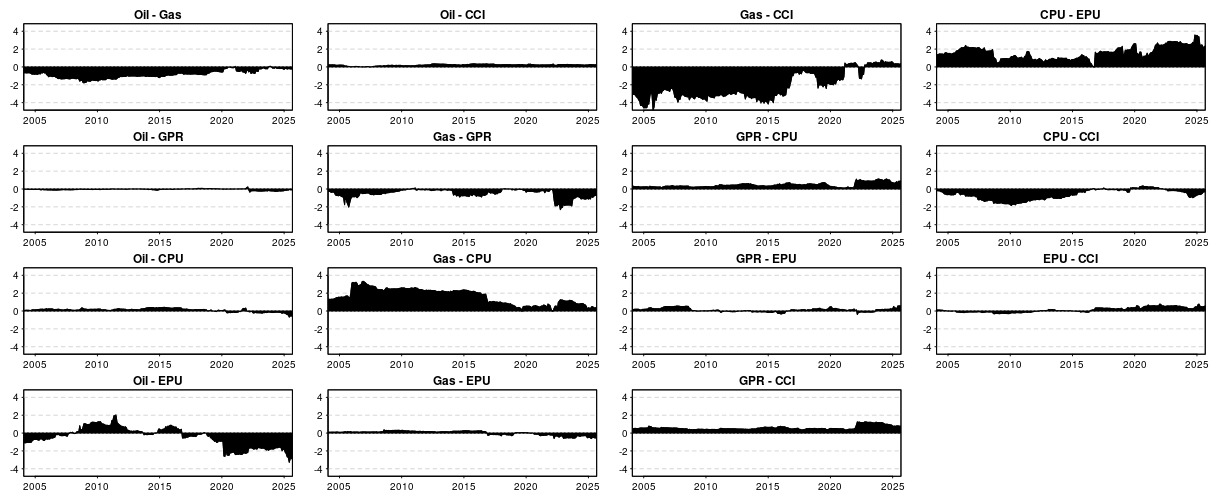
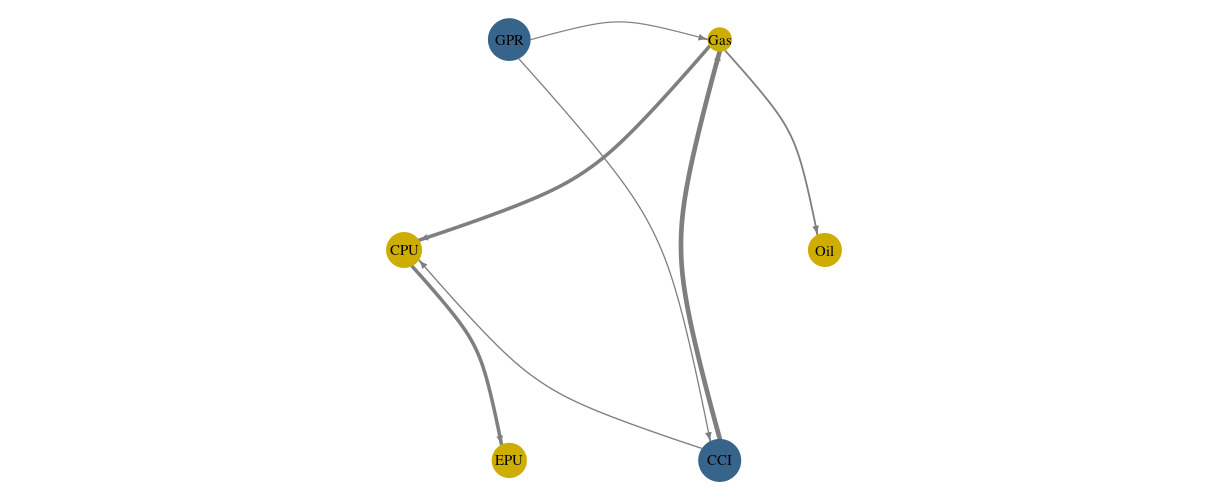
For brevity, additional results are reported in the Appendix. Figure A presents the NPDC, and Figure B shows the network plots. To assess robustness, the connectedness framework is re-estimated using WTI crude oil and Henry Hub natural gas futures prices. The results remain qualitatively unchanged.
IV. Conclusion
The empirical evidence reveals that public climate concern acts as an autonomous behavioural channel of shock transmission in U.S. fossil energy price dynamics. Stronger spillovers for natural gas relative to oil suggest that the transition-oriented fuel is more closely linked to shifts in public climate perceptions. For policymakers, this implies that regulatory and fiscal measures operate within an environment where behavioural climate risk perceptions interact with fossil energy price dynamics. For energy market participants, incorporating indicators such as the CCI into pricing and risk assessment frameworks may improve decision-making under uncertainty.
Acknowledgement
The author thanks the Editor and anonymous reviewers for their valuable comments, which have improved the manuscript’s clarity and quality.