I. Introduction
Environmental sustainability, commonly known as the new détente, has been a prevalent issue in industrialized economies for a while. Nevertheless, the implementation and significance of this concept in emerging markets and developing economies (EMDEs) have only recently started to gain momentum. According to Stern et al. (2022), a coordinated investment in clean capital is crucial for achieving transformative growth and transitioning into a net zero economy. However, EMDEs encounter a dearth of financial resources, impeding their endeavours in environmental preservation. The indigenous mechanisms within these economies cannot effectively tackle these challenges, primarily due to the non-sequential functioning of the financial intermediation process.
The Green Climate Fund (GCF) was instituted by the United Nations Framework Convention on Climate Change (UNFCCC) during the 15th Conference of the Parties (COP 15) held in Copenhagen. Developed countries pledged to direct a sum of US$100 billion annually towards EMDEs by 2020 (Watson, 2023). The fund was designed to aid impoverished and susceptible communities and promote a smooth economic transition (UNFCCC, 2022).
Remarkably, as of September 2023, the aforesaid objective remains unfulfilled, with a meagre sum of US$83.3 billion in climate finance being mobilized (Patel et al., 2023). Additionally, the funds allocated were insufficient to meet the financial needs of EMDEs (UNFCCC, 2022). Songwe et al., (2022), projected that EMDEs, excluding China, will require an annual expenditure of $1 trillion by 2025 and $2.4 trillion by 2030. In light of the evident disparity in climate financing and the substantial financial requirements, it is crucial to revitalize green financing in EMDEs to translate the commendable net zero aspirations into tangible outcomes.
Green Finance (GF) promotes the reallocation of investments away from the heavy reliance on fossil fuels, which contribute to the emission of greenhouse gases (GHGs), towards initiatives that prioritize environmental protection (Numan et al., 2023). GF advocates for air quality and the efficient utilization of green energy sources, particularly renewable energy options such as solar and wind power, which are known for their environmentally friendly characteristics (Lundgren, 2003). Despite the widespread recognition of the significance of green finance in promoting environmental quality, the extant research on the relationship between GF and environmental quality is sparse (Çitil et al., 2023; Numan et al., 2023). The primary emphasis of research is the decarbonization of mining, energy, and industry sectors and concurrently prioritizing technological remedies that align with the interests of the Global North.[1]
This study presents novel contributions to existing research. In contrast to previous studies that relied on indicators such as CO2 emission, ecological footprint, and biodiversity to assess environmental quality (Hieu, 2022; Musah et al., 2022), our research adopted a more comprehensive and distinctive approach. Specifically, we employed the load capacity factor (LCF) method, which effectively integrates both the demand and supply of environmental quality. To the best of our knowledge, no previous panel study on environmental quality has utilized the LCF, except Kirikkaleli & Adebayo’s (2022) country-specific study. The LCF can be mathematically expressed as the division of biocapacity by ecological footprint (Biocapacity/Ecological Footprint). LCF values below one signify an unsustainable system, implying that the prevailing consumption patterns of society are inflicting damage upon the ecosystem. Conversely, values exceeding one indicate a sustainable system. A value of one signifies the threshold of sustainability. Secondly, we employed fixed and random effects models to assess the relationship between the variables of interest (Olubusoye et al., 2016). These models account for all time-invariant unobserved (or latent) variables that impact the dependent variable, whether these variables are recognized by the researcher or not. Thus, the models are beneficial because of the probable existence of such omitted variables (Bollen & Brand, 2008).
The remaining part of the paper is in three sections: The data and preliminary analysis are discussed in Section II, and the main results are in Section III. Section IV concludes the study.
II. Data and Preliminary Analysis
Here, we provide a succinct description of the data and preliminary analysis. Our dataset includes various variables that were dichotomized into bipartite sub-groups. First, our main dependent variable, LCF, was sourced from the Global Footprint Network. Second, there were control variables, including international financial flows in support of clean energy research and development and renewable energy production; a proxy GF sourced from Our world in data database; patents on environment technologies, representing green innovation (GI) generated from the Organization for Economic Co-operation and Development (OECD) database; gross domestic product (GDP), taken from the World Development Indicator (WDI) database and government integrity (GINT) and financial freedom (FF) sourced from Heritage Foundation.
The dataset comprised EMDEs, including yearly frequency series from 2002 to 2022. Eleven (11) countries, namely Algeria, Armenia, Bangladesh, China, Colombia, Egypt, India, Indonesia, Mexico, Morrocco, and Peru were selected for the study based on IMF World Economic Outlook classification and data availability. Following the standard procedures for variables with time series properties, we considered the group statistical features of the series starting with the descriptive statistics (see Table 1). The mean statistic shows that the average GDP is relatively higher than other variables. Additionally, GINT in EMDEs, on average, appears to be less volatile. The statistical summary for green innovation was comparatively the lowest, with an average mean of 2.41. The result shows that in EMDEs, the GF average is 17.26, and that of FF is 3.79. The former, however, appears to be more volatile than the latter.
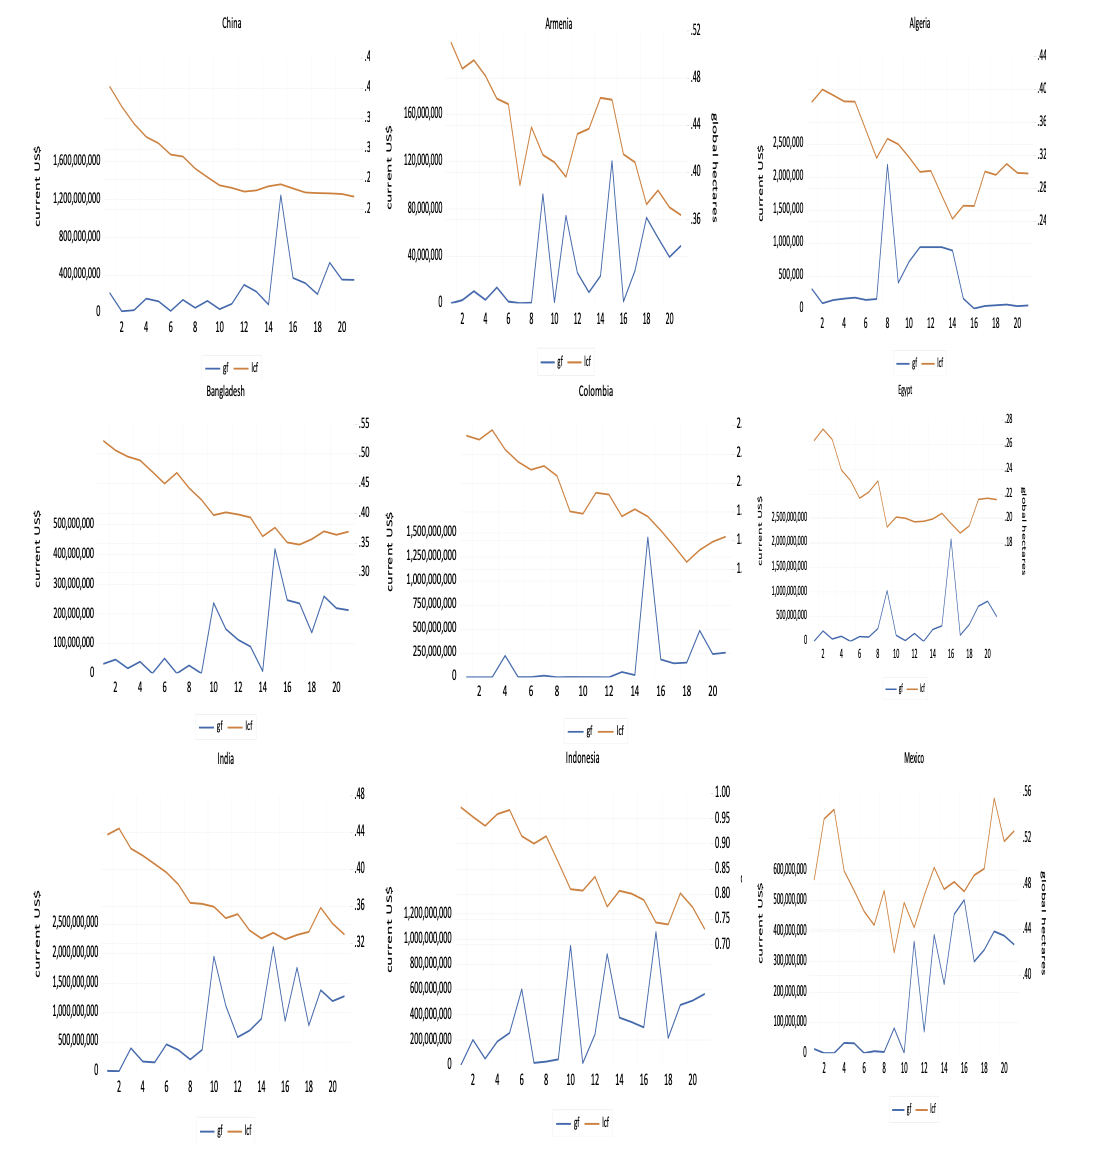
We plotted the LCF versus GF so that any potential interactions between the variables of interest could be clearly inspected (see Figure 1). In emerging nations, there is a potential relationship between GF and environmental quality. The co-movement between GF and environmental quality appears to be quite irregular in almost all EMDEs.

The Kuznets growth model remains the prominent theoretical model often used as the baseline equation to validate the GF and environmental quality nexus. The model assumes that economic growth reduces environmental quality in the long run as indicated by the following linear equation:
Poll it=β0+β1GDPit+β2GDP2it+ε1it
where Poll represents pollution; GDP denotes gross domestic product; connotes the square of gross domestic product; and depicts an error term. We specify the revised panel version of the model in Equation 2 to depict the standard fixed and random effects procedure:
lLCTit=β0+β1lGFit+β2lGIit+β3lGDPit+β4lGINTit+β5lFFit+(ηit)+μi+ε1itk
where is the log of LCF by country in year denotes the of GF at country level in year connotes the log of green innovation at country level in year is of gross domestic product at country level in year represents the log of GINT at country level in year connotes the of FF at country level in year captures aggregate shocks impacting the secular trends in outcome variables, and denotes individual fixed effects. The error term for which a rigorous exogeneity requirement is expected to apply, is independently and normally distributed, with a zero mean and constant variance, and is assumed to be uncorrelated with all the explanatory factors.
III. Main Results
The results of the impact of GF on environmental quality in EMDEs are presented in Table 2. Apparently, our results reveal that GF is a positive and statistically significant determinant of environmental quality in EMDEs. Put differently, GF may boost environmental quality in EMDEs. This outcome supports Zhou et al. (2020) study. The outcome was corroborated by both the fixed and random effects methodologies. However, the fixed effects model exhibited greater statistical significance. According to the Hausman result, the null hypothesis favouring random effects was refuted. Thus, the fixed effects model was the most optimal choice. Additionally, our findings demonstrate a statistically significant adverse impact of green innovation on environmental quality in EMDEs possibly due to a slow integration of environmentally sustainable innovations within EMDEs. Our discovery opposes that reported by Kirikkaleli & Adebayo (2022). Our findings also reveal a statistically significant negative relationship between GDP and environmental quality, which is supported by both fixed and random effects models. This outcome raises a pertinent inquiry regarding the growth trajectory of EMDEs. The observed adverse effect of economic growth on environmental quality substantiates the need for a reevaluation of the growth process in EMDEs.
Moreover, the findings indicate that GINT and FF have a favourable and statistically significant influence on environmental quality. This implies that the environmental conditions in EMDEs experience notable improvements due to GINT and the degree of FF. For example, there is a growing occurrence of democratically elected governments, and the financial sector is witnessing a rise in transparency due to the emergence of Fintech, which facilitates the seamless provision of GF in EMDEs. These factors collectively enhance environmental quality in EMDEs.
IV. Conclusion
This study investigated the green finance-environmental quality nexus in EMDEs. The study covered eleven (11 countries selected on the basis of IMF classification and availability of data. This study utilized fixed and random effects methodologies, employing data spanning from 2002 to 2022. The findings revealed that GF positively and significantly impacts environmental quality. Moreover, GINT and FF increase environmental quality in EMDEs. The aforementioned discovery portends practical implications for revitalizing GF to augment environmental quality. This analysis incorporated eleven (11) emerging economies, as data was unavailable for additional countries. Notwithstanding, our sample surpassed 60% of countries that contribute to more than two-thirds of environmental challenges in EMDEs. Moreover, the incorporation of diverse continents in our analysis allowed us to formulate more comprehensive and all-encompassing conclusions pertaining to EMDEs.
Acknowledgements
The comments from the Editor and the anonymous reviewers are gratefully acknowledged. The author is also grateful to Professor Afees Salisu, Professor Olusanya E. Olubusoye, Professor Akin Iwayemi and Professor Sam Olofin for their academic mentorship and provision of a conducive research environment that has aided the capacity development of the author at the Centre for Econometrics and Applied Research (CEAR) Ibadan, Nigeria.
See UNRISD (2018).