I. Introduction
Extreme climate events have become a global challenge. In order to respond to such an alarming issue, several stakeholders have prioritized transitioning to carbon-neutral practices and started implementing various policies on green development as it can reduce climate uncertainty. Climate uncertainty arises from many factors, such as policy changes, geopolitical aspects, energy security, increased carbon emissions, and frequent natural calamities. Climate policy uncertainty (CPU) refers to the unpredictability surrounding the design, scope, and stringency of climate regulations and the potential changes in government policies over time. Thus, climate policies accompany a certain degree of uncertainty, which can significantly influence market dynamics and investor behavior. This uncertainty surrounding climate policy implementation and future regulatory frameworks has significant implications for market participants, particularly in the carbon emission allowance ETF and environmental, social, and governance (ESG) investors. For example, changes in the CPU can lead to asymmetric reactions of carbon and ESG investors. Investors in carbon assets may perceive risks and opportunities, while ESG investors may become more cautious and inclined to invest in sustainable alternatives. The reactions of these investors are driven by their differing priorities, time horizons, and the impact of CPU on their investment strategies and objectives. A carbon emission allowance ETF is a fund that lets investors trade on the market for carbon credits, supporting environmentally responsible practices. Understanding how CPU influences carbon emission allowance prices and the ESG index can provide valuable information on the dynamics of these markets and the challenges investors and policymakers face in navigating the transition to a sustainable future. Therefore, this study investigates the nonlinear effects of CPU on carbon allowance prices and the ESG index prices.
By analyzing the relationship between CPU, carbon allowance prices, and ESG index prices, this study contributes to the existing literature on the intersection of climate change, financial markets, and sustainable investing. This study is the first to investigate the nonlinear effects of CPU on carbon allowance and ESG prices. Additionally, it examined how inflation uncertainty affects carbon allowance and ESG prices. The findings can inform investors, asset managers, and policymakers about the potential risks and opportunities associated with CPU, helping them make informed decisions and develop effective strategies to navigate this complex landscape.
We structure the paper as follows. Section II reviews the literature on the relationship between CPU, carbon emission allowance, and ESG index prices. Section III describes the nonlinear ARDL (NARDL) method, while Section IV describes the data. Section V discusses the results, and Section VI concludes.
II. Literature Review
Investor sentiment and behavior are crucial in shaping the relationship between climate policy uncertainty and market prices. The relationship between CPU, carbon allowance prices, and ESG stock prices can exhibit nonlinear characteristics. Initially, uncertainty can lead to erratic price movements and volatility. However, as market participants gain more information, experience, and understanding of policy developments, the relationship between uncertainty and market prices may become more stable and less nonlinear. Uncertainty about climate policies can influence market participants’ expectations and decision-making processes, affecting carbon allowance and ESG stock prices.
The nonlinear relationship between CPU and market prices can also arise from interactions between multiple policies and regulations. Different policy measures implemented at various levels (local, national, or international) may have overlapping or conflicting impacts on carbon allowance and ESG prices. Ding et al. (2022) show that CPU significantly affects carbon-intensive assets, i.e., clean energy and ESG stock prices. However, the authors did not indicate whether changes in CPU cause asymmetric price changes. On the contrary, Akpa et al. (2023) find that CPU does not affect the persistence of sustainable green asset returns. Wang and Li (2023) find that Chinese climate uncertainty significantly affects CSI 300 ESG volatility. Similarly, US firms tend to disclose more ESG information during times of increased climate policy uncertainty (Hoang, 2023), which can affect ESG stock prices. However, previous studies have not examined whether positive and negative changes in climate policy uncertainty affect carbon allowance and ESG stock prices differently. Understanding the relationship between CPU, carbon allowance prices, and ESG performance can facilitate the transition to a low-carbon emission regime. Therefore, the present study examines nonlinear relationships between CPU, carbon allowance, and ESG stock prices.
III. Method
We employed the NARDL model as it can effectively capture an explanatory variable’s short- and long-term asymmetric impact on the dependent variable (Tang et al., 2023). Unlike the ARDL, which cannot account for the positive and negative changes in CPU, NARDL captures the effects due to the positive and negative changes in the CPU. Given the nonstationary nature of most price series, the NARDL model is a suitable choice for examining and establishing the correlation between CCA, S&P 500 ESG index prices, and WTI oil futures prices, and inflation uncertainty (Chattopadhyay & Mitra, 2015). Additionally, this method can address multicollinearity by selecting the appropriate lag order for the included variables and avoid endogeneity problems by capturing the dynamic interactions between the variables (Shin et al., 2014). Besides, the nonlinear characteristics of the data, as shown in Table 2, support the NARDL application.
The baseline NARDL model can be written as in Equation (1):
\[y_{t} = \beta^{+}x_{t}^{+} + \beta^{-}x_{t}^{-} + u_{t}\tag{1}\]
where, is an error term, and are the asymmetric long-run parameters, and is a vector of independent variables decomposed as in Equation (2):
\[x_{t} = x_{0} + x_{t}^{+} + x_{t}^{-}\tag{2}\]
where, is an initial value, and are partial sum processes corresponding to positive and negative changes in as shown for CPU in Equations (3) and (4).
\[{CPU}_{t}^{+} = \sum_{j = 1}^{t}{\mathrm{\Delta}{CPU}_{j}^{+}} = \sum_{j = 1}^{t}{\max\left( \mathrm{\Delta}{CPU}_{j},0 \right)}\tag{3}\]
\[{CPU}_{t}^{-} = \sum_{j = 1}^{t}{\mathrm{\Delta}{CPU}_{j}^{-}} = \sum_{j = 1}^{t}{min(\mathrm{\Delta}{CPU}_{j},0)}\tag{4}\]
The NARDL error correction model can be defined as follows, from Equations (5) to (6):
\[\small{\begin{aligned} {lnCCA}_{t} &= \alpha_{0} + \alpha_{1}\ln{CCA}_{t - 1} + \beta_{1}{lnCPU}_{t - 1}^{+}\\ & \quad + \beta_{2}\ln{CPU}_{t - 1}^{-} + \beta_{3}\ln{WTI}_{t - 1}\\ & \quad + \beta_{4}\ln{VIX}_{t - 1} + \sum_{i = 0}^{p}{\phi_{3}{lnWTI}_{t - i}}\\ & \quad + \sum_{i = 0}^{q}{\phi_{4}{lnVIX}_{t - i}} + \sum_{i = 0}^{r}{\phi_{j}\mathrm{\Delta}ln{CCA}_{t - i}}\\ & \quad + \sum_{i = 0}^{s}{{(\pi}_{t}^{+}\mathrm{\Delta}ln{CPU}_{t - i}^{+}} + \pi_{t}^{-}\mathrm{\Delta}ln{CPU}_{t - i}^{-}) + \varepsilon_{t} \end{aligned}}\tag{5}\]
\[\small{\begin{aligned} {lnSPESG}_{t} &= \alpha_{0} + \alpha_{1}\ln{SPESG}_{t - 1} + \beta_{1}{lnCPU}_{t - 1}^{+}\\ & \quad + \beta_{2}\ln{CPU}_{t - 1}^{-} + \beta_{3}\ln{WTI}_{t - 1}\\ & \quad + \beta_{4}\ln{VIX}_{t - 1} + \sum_{i = 0}^{p}{\phi_{3}{lnWTI}_{t - i}}\\ & \quad + \sum_{i = 0}^{q}{\phi_{4}{lnVIX}_{t - i}} + \sum_{i = 0}^{r}{\phi_{j}\mathrm{\Delta}ln{SPESG}_{t - i}}\\ & \quad + \sum_{i = 0}^{s}{{(\pi}_{t}^{+}\mathrm{\Delta}ln{CPU}_{t - i}^{+}} + \pi_{t}^{-}\mathrm{\Delta}ln{CPU}_{t - i}^{-}) + \varepsilon_{t} \end{aligned}}\tag{6}\]
The asymmetric effect in the short run holds true if for all Similarly, if the long-run asymmetric effect holds true. For the NARDL framework, the BDM test statistic (tBDM) (Banerjee et al., 1998) and the PSS F statistic (FPSS) test (Pesaran & Yongcheol Shin, 2001) are used to check for cointegration. The null hypothesis (H0) of FPSS can be written as follows:
\[H_{0} = \alpha_{1}{= \beta}_{1} = \beta_{2} = \beta_{3},..,{= \beta}_{n} = 0\]
Cointegration exists if the test statistic exceeds the upper-bound values. In contrast, no cointegration exists if the test statistic falls between the upper and lower bounds or is less than the lower bound.
IV. Data
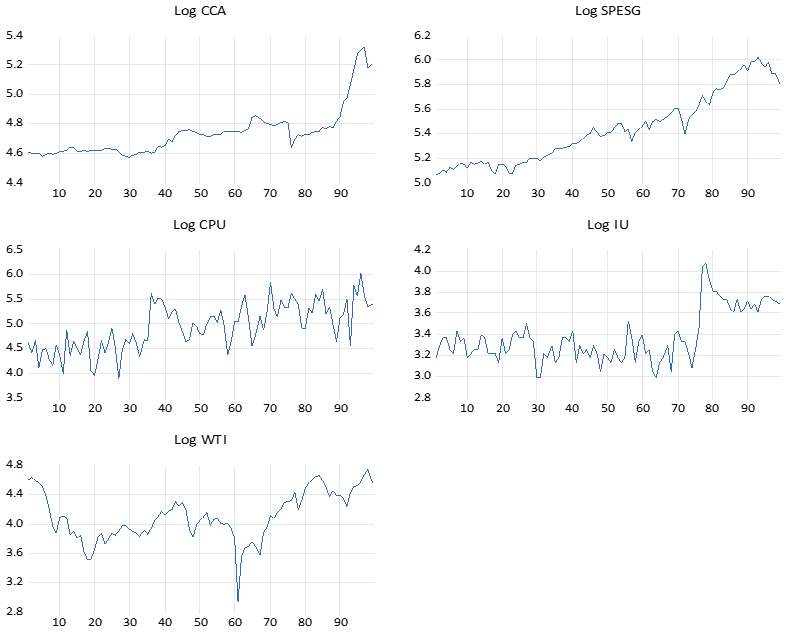
We used monthly data on California carbon allowance ETF prices (CCA), S&P 500 ESG index prices (SPESG), CPU, WTI oil futures (WTI), and inflation uncertainty index (IU) from December 2013 to August 2022. Data availability defines data duration. We extracted California carbon allowance prices, S&P 500 ESG index prices, and WTI oil futures from the Bloomberg database, while the inflation uncertainty index is extracted from https://sites.google.com/site/inflationuncertainty/home, and the climate policy uncertainty data developed by (Gavriilidis, 2021) from https://www.policyuncertainty.com.
.png)
We used the Brock, Dechert, and Scheinkman (BDS) test to examine the nonlinearity of the selected data.
V. Results and Discussion
Table 3 shows the nonlinear effects of CPU on California carbon allowance prices and SP 500 ESG index prices. The results indicate that increases in CPU positively affect carbon allowance and ESG index prices by 1.2% and 0.29%, respectively, in the short term. Carbon allowances represent the right to emit a certain amount of carbon dioxide or other greenhouse gases. If there is uncertainty surrounding climate policies, companies may anticipate stricter regulations or a more limited supply of allowances in the future. This expectation can drive up demand for existing carbon allowances, leading to higher prices. Similarly, uncertainty in climate policies can increase investors’ awareness and concern about climate change. They may prioritize investments in companies that demonstrate strong ESG practices, including efforts to reduce carbon emissions and mitigate environmental risks. As a result, the demand for their stocks and bonds could increase, pushing their prices. On the contrary, a unit decrease in CPU does not adversely affect carbon allowance prices. A unit reduction in CPU negatively affects SPESG by 0.11%. The volatility of WTI positively affects CCA prices, while inflation uncertainty negatively affects both CCA and ESG prices. The past prices of CCA and ESG positively influence their respective future values.
In the long term, a unit of positive change in CPU increases the CCA and SPESG prices by 0.78% and 0.22%, while a unit decrease in CPU negatively affects the CCA and SPESG prices by 0.18% and 0.10%. An increase in climate policy uncertainty can positively affect carbon allowance and ESG prices in the long term. This can occur due to the anticipated scarcity of carbon allowances, the increased investor demand for ESG-focused investments, the proactive adoption of sustainable practices by companies, and the promotion of market confidence and stability. WTI prices have positive impacts, while inflation uncertainty negatively impacts CCA and SPESG prices. The inflation uncertainty index has a negative impact on carbon allowance prices and ESG prices. This occurs primarily due to increased risk aversion among investors, reduced investment demand, the opportunity cost of seeking safer options, potential effects on business operations and costs, and increased market volatility. However, the relationship between inflation uncertainty and these asset prices is influenced by various factors and may vary depending on the uncertainty’s overall market conditions and duration.
The ECM term indicates a rapid adjustment of the deviation from the previous year in the current year, with 56% and 64% of errors from previous years being corrected in CCA and SPESG, respectively. The diagnostic statistics show that the residuals of the NARDL models have a normal distribution, equal variance, and are serially uncorrelated, and thus the models are well specified.

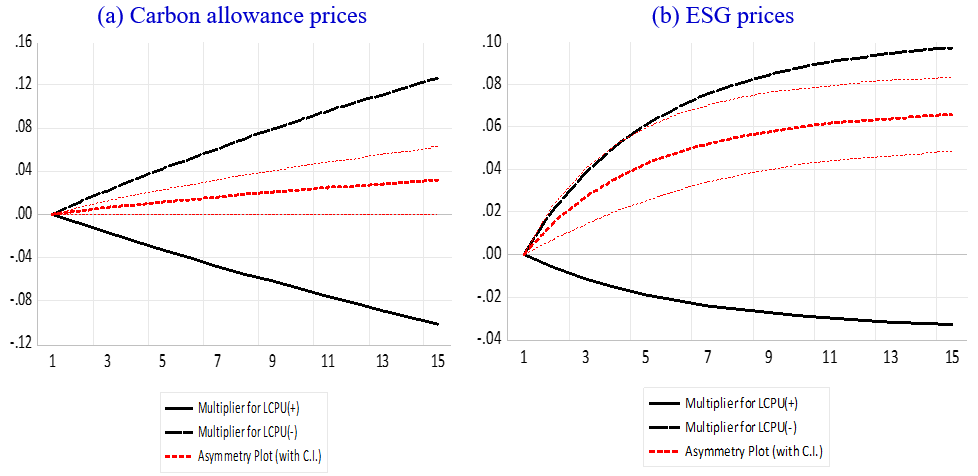
Figure 2(a) shows that a 1% shock to CPU lifts carbon allowance prices (CCA) by 0.04% within five months, with a significant short-term boost in the first two months. The magnitude of positive changes is more persistent than negative changes. Figure 2(b) shows that a 1% shock to CPU lifts the CCA of ESG prices by 0.03% within two months, with a significant short-term boost in the first month. This asymmetry is significant, as shown by the asymmetry curve and its 95% confidence interval.
VI. Conclusion
We examine the nonlinear effects of CPU on California carbon allowance (CCA) and ESG stock prices. The findings indicate that increases in CPU positively affect CCA and ESG stock prices, while decreases adversely influence CCA and ESG stock prices. The inflation uncertainty index negatively affects these prices, while the volatility of WTI crude oil positively affects them. Dynamic multiplier effects indicate that positive changes in the CPU increase the CCA and ESG stock prices. Under adverse changes, investors can hedge CCA and ESG assets with other green stocks. Furthermore, investors can use this information to construct green portfolios with carbon allowance and ESG stocks, while environmentalists and policymakers can exploit these findings in policymaking for carbon allowance and ESG markets.