I. Introduction
The linkages between the Russia-Ukraine war and commodity market volatility are well-documented in previous literature (Ihle et al., 2022; Wang et al., 2022). The major driving force of these studies are the consequences of commodity market volatility on policy efficacy (particularly for investors and policy makers). Commodity market volatility typically precedes inflation, and information regarding these vicissitudes can be utilized by market actors to inform their investment choices.
Russia and Ukraine make significant contributions to the global commodity market (Wang et al., 2022). The Russia-Ukraine war has primarily disrupted the global supply chain by impeding Ukrainian exports of goods, particularly commodities over which the nation has competitive advantage (barley, wheat, sunflower oil, seed oil, corn, and crude iron). Meanwhile, Russia’s exports of natural gas, palladium, nickel, fertilizers, and coal have decreased due to harsh sanctions. Expectedly, commodity prices have experienced a substantial increase in the international market (Avalos & Huang, 2022).[1] Volatility in the commodity market can be transmitted to other global investment portfolios (bonds, stocks, currencies, cash and cash equivalents) (Szczygielski et al., 2023).
This study makes two main contributions to the existing body of knowledge. First, we attempt to model the global volatility in the commodity market amidst the Russia-Ukraine war. This would give a holistic overview of the impact of the Russia-Ukraine war on the commodity market and bridge the gap in the literature, as existing literature is specific to countries and economic blocs.[2] Second, we construct a Russia-Ukraine war index using Google Trends (GT) and subject the modelling to alternative estimators. The use of alternative estimators is premised on endogeneity problems, which makes the rigorous ordinary least squares (OLS) exogeneity assumptions questionable, as commodity prices respond to both supply and demand shocks including climate change, technological progress, and supply disruptions. Closely related to endogeneity issues is the heteroskedasticity effect, which is applicable to our study following the use of high-frequency series. The utilization of alternative estimators in this study was inspired by Phillips & Hansen (1990) and Park (1992), who proposed a fully modified least squares (FMOLS) and canonical cointegration regression (CCR), as an alternative to OLS in the presence of endogeneity, asymptotic bias heteroskedasticity, autocorrelation, and residual non-normality.
Expectations and past experience play fundamental roles in investment decisions in the commodity markets; thus, we also employ the dynamic ordinary least squares method (DOLS), an alternative estimator developed by Stock & Watson (1993), which recognizes coefficients of leads and lags. Therefore, we test the performance of these alternative estimators in comparison to the OLS, because accurate modeling of commodity market volatility is crucial for informed investment portfolios, effective hedging, asset allocation, and regulatory guidelines. The paper is structured in the following ways, in addition to this introduction: Sections II presents the development of the Russia-Ukraine war index and describes the data and preliminary results. Section III discusses the results, and Section IV concludes the study.
II. Construction of Risk and Uncertainty Associated with Russia-Ukraine War
The growing intensity of the Russia-Ukraine conflict in February 2022 caused major economic and financial shocks, with raw material, energy, and agricultural product prices skyrocketing (Fang & Shao, 2022; Neely, 2022). To avoid masking of results, we chose a study sample period from 24 February 2022 (start of Russia invasion) to 20 May 2023 (The UK announced its plan to ban Russian imports, while the US imposed additional sanctions against Russia). To gauge popular opinion on the Russia-Ukraine conflict, we constructed a Russia-Ukraine war index premised on GT. This is in tandem with Khalfaoui et al.'s (2023) framework, which selected GT over other internet search engines. The Google search engine is superior; it dominates the global search market with a 90% worldwide search share (Urman et al., 2021). We employed a collection of terms associated with the Russia-Ukraine War.[3] Each term provided by Google had a value ranging from 0 to 100. We performed a principal component analysis on each keyword and aggregated the GT keywords.
A. Data and Preliminary Analysis
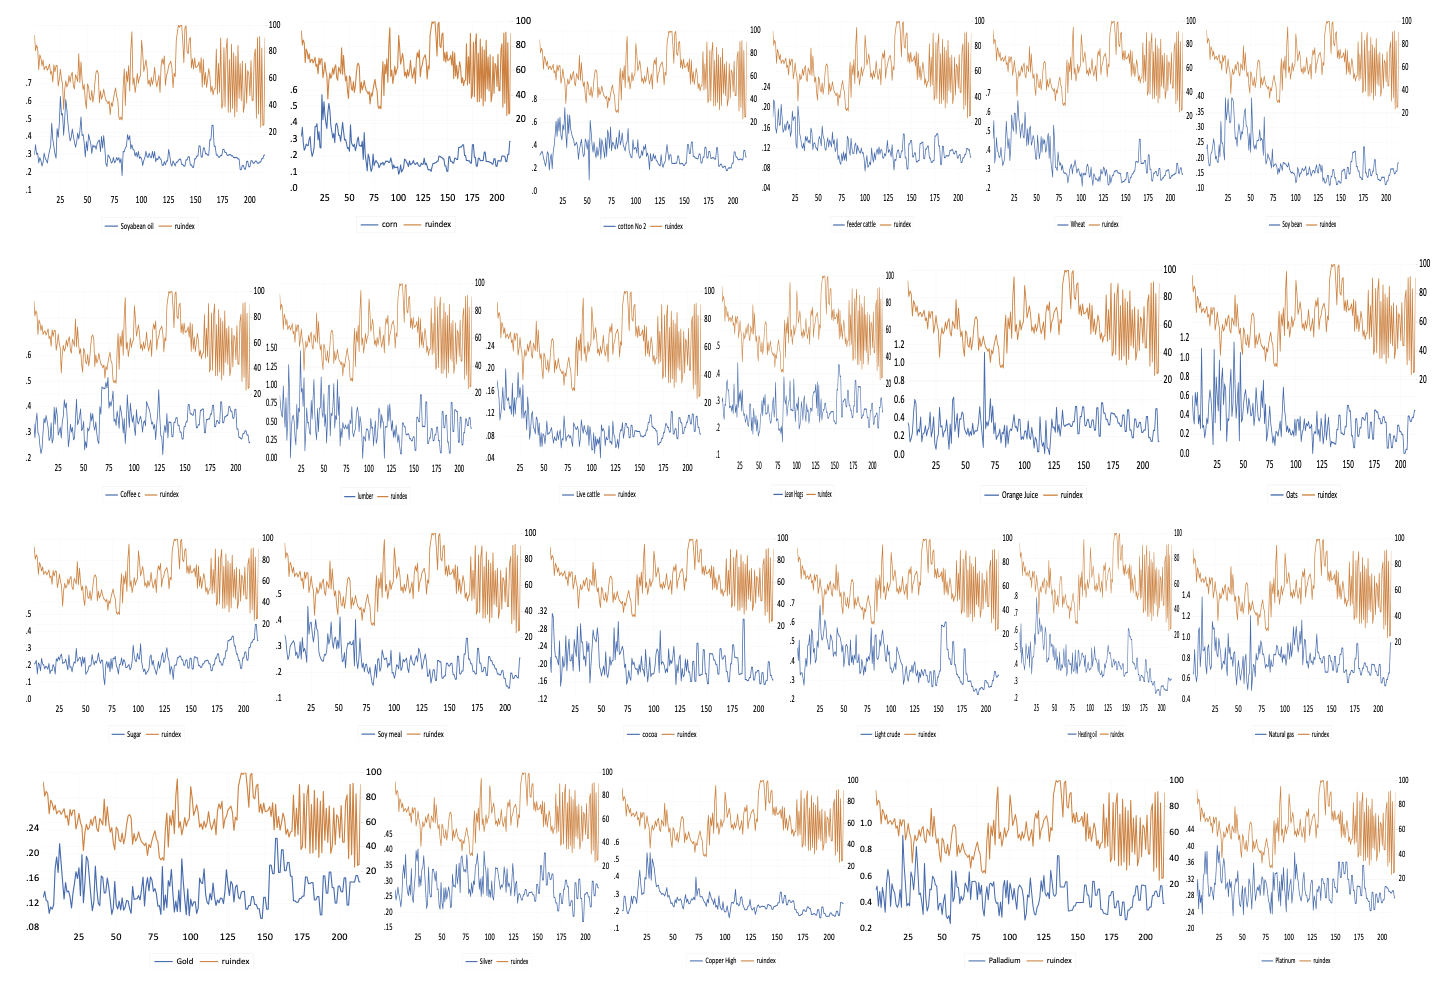
The data on global realised volatility (RV) of commodity futures was sourced from the University of Chicago Booth School of Business Risk Lab, under the auspices of Professor Dacheng Xiu (https://dachxiu.chicagobooth.edu/#risklab.com). The common national best bid and offer (NBBO), which is always available and has the highest-frequency was gathered and cleaned. Using non-zero returns of transaction prices sampled to the highest frequency accessible, for days with no fewer than 12 observations, we present quasi-maximum likelihood estimates of volatility (QMLE) based on moving-average model MA(q) observations (Xiu, 2010). The Akaike Information Criterion (AIC) was used to choose the optimal model (q). The preliminary findings highlighted key characteristics of the relevant variables prior to the main analysis. The graphical plot of the relevant series provides insight regarding the nature of the relationships (Figure 1). The descriptive statistics illuminate the series statistical characteristics, such as the mean, standard deviation, skewness, and kurtosis (Table 1). The graphical plots show that commodity market volatility align with the Russia-Ukraine war index (see Figures 1).

According to Table 1, the global commodities futures averaged about 0.313 daily, which is relatively low. Comparatively, feeder cattle and gold futures have significantly lower standard deviation values. Lumber futures appear to be the most unstable. The statistical distribution of the series demonstrates positive skewness for the entire series (implying greater individual values than the average). For all variables, the variable distributions are leptokurtic with the exception of light Crude, silver, and platinum that are considered platykurtic.
III. Main Results
We investigated whether the Russia-Ukraine war has the ability to crystallize commodity volatility in the stock market. We need ample proof of negative and significant coefficient values across the various indicators of commodity market volatility and estimators (OLS, FMOLS, DOLS, and CCR) to conclude that the Russian-Ukrainian War triggers volatility in the commodity market. To facilitate our discussion, we refer to the results presented in Table 2. The findings demonstrate that the four estimators consistently produce negative and significant estimates for a substantial number of commodities. These results align with studies that emphasize the negative consequences of the Russia-Ukraine war on commodity market volatility (Ihle et al., 2022; Wang et al., 2022). Noticeably, the commodity market volatility indicators with positive coefficients were insignificant. Thus, there is compelling evidence that the Russia-Ukraine War Index may be a reliable indicator of commodity market volatility. The results further reveal that energy and metal markets were worst hit, indicating that the markets are more sensitive and volatile to the Russia-Ukraine war. As an illustration, Light Crude, Copper High, and Gold diminished by 0.009, 0.009, and 0.002 respectively, while Lumber, Oats, Wheat, and Corn, which are leading exportable agricultural commodities from Russia and Ukraine, declined by 0.002, 0.002, 0.001, and 0.001, respectively.
IV. Conclusion
Commodity market volatility is a crucial indicator of risk and predictability. High volatility influences portfolio diversification and hedges towards less risky assets for investors seeking profit maximization. This study evaluates commodity market volatility during the Russia-Ukraine war. The novelty of this study includes: (i) developing the Russian-Ukrainian Conflict Index and modelling commodity volatility and (ii) comparing the efficacy of various estimators for modelling commodity market volatility. We see consistent trends in the behaviour of the volatility models relative to the chosen estimators. In line with Mu et al.'s (2022) findings, we demonstrate that volatility in the commodity market was caused by the Russian-Ukrainian war. This finding has implications for policies that could help commodity investors decide how to invest and hedge such volatile circumstances while serving as a litmus to policymakers in understanding systematic risk and developing strategies to reduce spillovers during crises.
Acknowledgement
The authors benefitted immensely from the capacity development training programmes at the Centre for Econometrics and Applied Research, Ibadan, Nigeria.
Anecdotal evidence shows that energy prices (in U.S. dollars) soared more than four times between April 2020 and March 2022, the biggest 23-month increase since the rise in oil prices in 1973. Likewise, between April 2020 and March 2022, fertilizer costs grew by 220%, the biggest 23-month increase since 2008, and food expenses increased by 84%, which was the biggest increase over a similar time period since 2008 (World Bank, 2022).
Huang et al. (2023)
Russo-Ukrainian War, Russia-Ukraine Conflict, Russia-Ukraine crisis, Azov, Neo-Nazism, Russian Gas Pipelines, Natural gas, Ukrainian Economy, Russian economy, US Sanctions on Russia, Sanctions on Russia, EU Sanctions Russia, Vladimir Putin, Volodymyr Zelenskyy, Ramzan Kadyrov, Ukraine invasion, Russia attack, Russian Missiles Strikes, Ukraine Missiles Strikes, Russian Air strike, Ukraine Air Strike.