I. Introduction
The recent COVID-19 crisis has increased the uncertainty in financial markets due to a lack of confidence in the future global economic outlook (Athari et al., 2023). The COVID-19 pandemic also changed communication processes and information retrieval. Social media applications showed higher growth during the pandemic due to mobility restrictions. Twitter is the most popular social media platform for sharing opinions and emotions about different hot topics among investment managers, global leaders, and the general public. For instance, based on the Policy Uncertainty website (Access date: 12 August 2023), the average total number of English tweets was 1,412,758 in December 2019 which significantly increased due to the pandemic to the highest of 4,457,241 in April 2020. The literature in behavioral economics underscores the importance of individuals’ and groups’ sentiments or opinions. Social platforms such as Twitter could share information about financial and economic conditions to create awareness and provide insight into predicting financial markets (Broadstock & Zhang, 2019).
Over the last three decades, some literature has been focused on investigating economic uncertainty’s effect on financial market behaviors by employing different proxies for uncertainty. For instance, several studies used the Chicago Board Options Exchange (CBOE) volatility index to measure volatility in equity markets (Shahzad et al., 2020). Likewise, numerous studies used the Google search trends index as an indicator of investors’ attention to equity and cryptocurrency markets (Zhang & Wang, 2020), and also the economic policy uncertainty index (EPU) (Athari et al., 2022). Besides, several studies used TEU as a predictor of equity and cryptocurrency markets at the aggregate level and concluded that Twitter sentiments could predict market returns (Chatterjee & French, 2021). As discussed in previous studies, a high level of uncertainty leads to a rise in the volatility of a firm’s cash flows, reducing the firm’s capital investment and financial performance, deteriorating financial markets (e.g., a higher cost of external funding and financial shortfalls), and decreasing the prosperity of business environments, which ultimately impacts firms’ stock prices (e.g., Athari & Bahreini, 2023; Irani et al., 2022).
As the COVID-19 pandemic spread globally, economic and financial uncertainty increased internationally, and a new avenue of research opened to explore the relationship between various asset classes. For instance, Choi (2020) tested the impact of EPU on the volatility of Standard & Poor (S&P) 500 economic sectors and found that the COVID-19 pandemic increased the volatility of all equity sectors. Matos et al. (2021) highlighted the adverse effects of COVID-19 deaths on the S&P sectors during the first wave. Siddique et al. (2021) demonstrate that gold, bitcoin, and green bonds had the slightest relationship with equity markets during the COVID-19 pandemic. Recently, Athari and Hung (2022) found that the co-movement between the various asset classes was strengthened during COVID-19.
What about the nexus between the TEU and energy stocks? Despite previous studies (e.g., Athari & Hung, 2022), fewer attempts have been made to examine the co-movement between the TEU and stocks from both time and frequency horizons, particularly during the pandemic. Since the energy market is closely linked to economic growth, it is essential to probe the TEU-energy stocks relationship to understand better how economic uncertainty could impact energy stocks. The energy market is theoretically more sensitive to economic uncertainty than other kinds of uncertainty. Unlike other industries, energy firms face higher risks due to their large scale and long payback period. Energy prices can also fluctuate due to economic uncertainty, causing changes in energy market supply and demand and energy consumption and production.
This study answers the subsequent questions: (i) During the COVID-19 period, was there any causal link between TEU and US energy stocks? (ii) If so, in which direction(s)? (iii) Are the co-movements between TEU and stock prices homogeneous or heterogeneous between other sectors and at an aggregate level relative to the energy sector? Understanding these relationships helps portfolio investors and asset managers diversify their portfolios and hedge against risks.
We employed the more advantageous wavelet coherence approach, which considers both time and frequency and nonlinearity between different time series and identifies the leading or lagging variables over time. Additionally, we used a novel TEU proxy for measuring economic uncertainty. The TEU (Baker et al., 2021) includes tweets from Twitter users in the US. This study selected TEU because most risk-averse equity market investors are influenced by their moods, sentiments, or uncertainties (Chatterjee & French, 2021). Furthermore, unlike a monthly EPU proxy, a daily Twitter-based measure of uncertainty may capture consumers’ short-term uncertainty better.
This paper is organized as follows: Section II presents the data and methodology, Section III discusses the empirical results, and Section IV concludes the paper.
II. Data and Methodology
We collected the daily price data of the US stock market at both aggregate and sectoral levels from 1 June 2011 to 24 December 2021 from the Thomson Reuters DataStream database. Likewise, we obtained the daily TEU from the Policy Uncertainty website.[1]
As shown in the descriptive summary in Table 1, the standard deviation of TEU is high, implying higher uncertainty levels during the sample period. The kurtosis values are also high, indicating more weights to tails than the normal distribution. Besides, the results of the Jarque-Bera test reject the null hypothesis of normally distributed log returns of variables. Furthermore, the ADF unit root test shows that the TEU and S&P 500 index and its sectoral indices follow the stationarity process.
Using the wavelet coherence method initially developed by Goupillaud et al. (1984), we analyzed the time-frequency connection between TEU and the US stock market. By allowing the subdivision of the one-dimensional time series into the bi-dimensional time-frequency range, wavelet methods demonstrate their originality and allow us to detect causation and correlation in the short, medium, and long term, respectively. According to Kondoz et al. (2021), a multiscale decomposition technique offers a natural intuition for frequency-dependent aspects to disclose the linkage between TEU and the US stock market.
III. Empirical Results
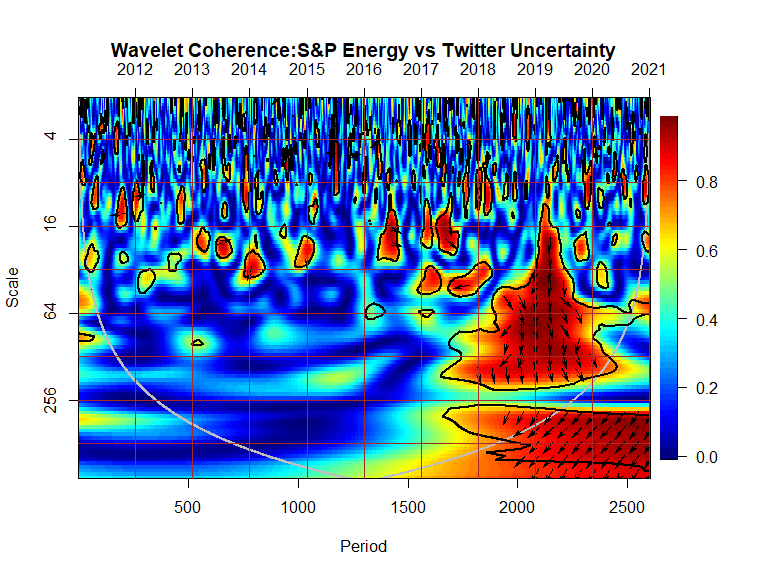
As displayed in Figure 1, the results show a negative co-movement between TEU and energy stock returns, which we can observe with ↙ arrows over the frequency bands of 32-512 days during 2019-2021. This implies that a rise in TEU leads to declining energy stock returns and vice versa. This finding aligns with our expectations; energy companies are very sensitive and significantly impacted by rising economic uncertainty (Shafiullah et al., 2021).

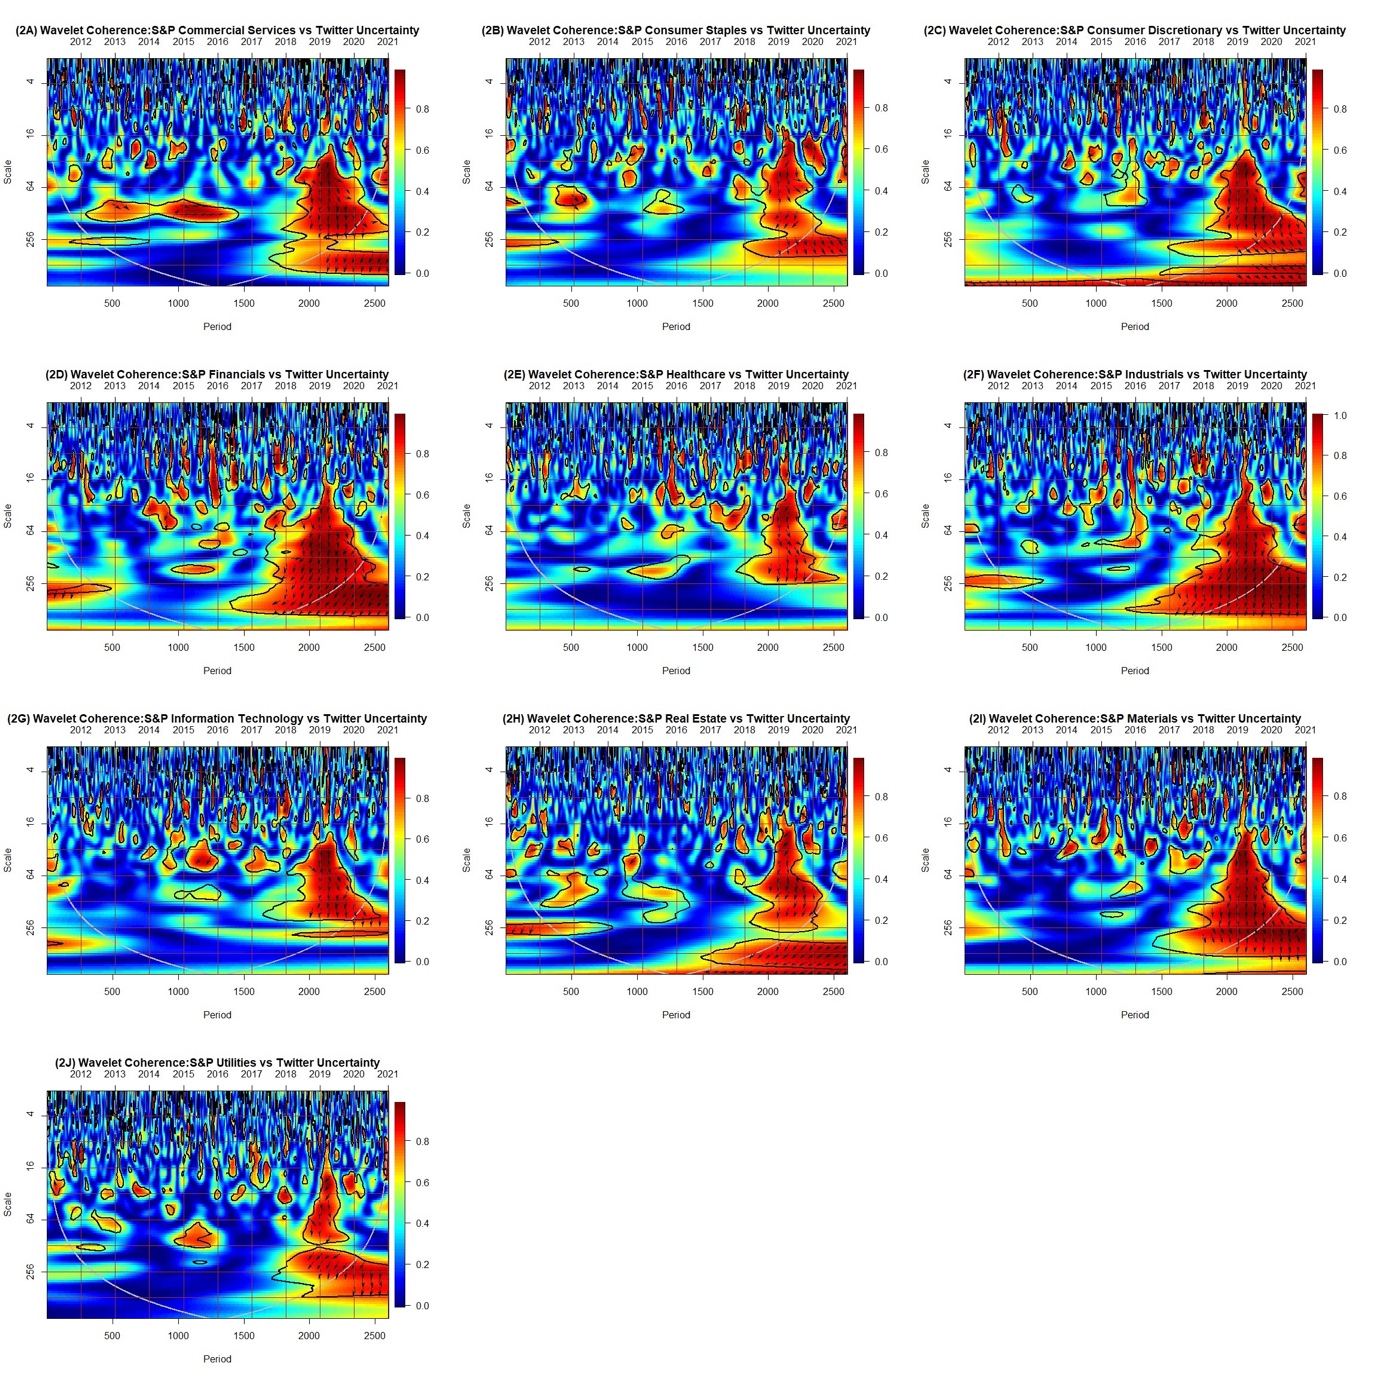
Figure 2 (A-J) presents the results of the co-movement between TEU and S&P 500 sectoral indices. The red region in Figure 2 indicates the strong co-movement from 2019 to 2021 when Twitter became the popular platform for sharing investment opinions with investors. The blue area from 2012 to 2018 shows the low co-movement among S&P 500 sectoral indices returns and TEU. Specifically, the interconnections between the TEU and S&P 500 sectoral indices increased significantly during the last three years.
As shown in Figure 2A, the arrow ↗ in 2015-2016 at frequency bands of 70 to100 days indicate the positive co-movement between commercial services sector index returns and TEU. There is also a negative co-movement between the commercial services sector index returns and TEU’s leading effect in the medium- and long-term investment horizons. The wavelet coherence results in Figure 2B depict the positive and significant co-movement between consumer staples sector index returns and TEU during the initial two waves of the COVID-19 pandemic, which is indicated by the shaded red areas and ↘ in 64 to128 days and 256 to 512 days frequency bands with the leading effect of TEU. These findings suggest that consumer staples/food items can provide higher returns for medium- and long-term investors and can be used to hedge the uncertainties during the COVID-19 pandemic.
Figure 2C shows the positive and significant co-movement between consumer discretionary sector index returns and TEU during the COVID-19 pandemic, which is indicated by the red area and ↘ arrow in 256 to 400 days and 512 to 1,024 days frequency bands with the leading effect of TEU. This reveals that the consumer discretionary sector delivers higher returns to long-term equity market investors, supporting Matos et al.'s (2021) findings. As expected, Figure 2D shows the negative co-movement between TEU and financial sectors index returns, which we can observe with the ↙ arrow over the frequency bands of 32 to 512 days from 2019 to 2021. However, the healthcare sector index returns show some resilience during the COVID-19 pandemic (see Figure 2E). These findings posit the positive co-movement with the healthcare sector index returns and TEU (↘) in the 64 to 128 days frequency band during 2020 when the healthcare sector performed well due to the COVID-19 vaccines.
As presented in Figure 2F, the findings indicate a strong and negative co-movement (↙) from 2018 to 2021 at the frequency bands of 16 to 512 days. These findings show that equity market investors cannot hedge economic uncertainties by investing in the industrial sector. Similarly, Figure 2G shows the negative co-movement between the information technology sector index returns and TEU for medium- and long-term investors, supporting Choi’s (2020) study. Moreover, Figures 2H, 2I, and 2J highlight the negative co-movement between the real estate, materials, and utilities sector indices returns and TEU, which is indicated by an arrow (↙) with the leading effect of TEU, again supporting Choi’s (2020) study. The negative co-movement could be because these sectors are the receivers of the volatility shocks from other sectors, especially from the energy sector, because of lockdowns, which resulted in a fall in demand for these services.

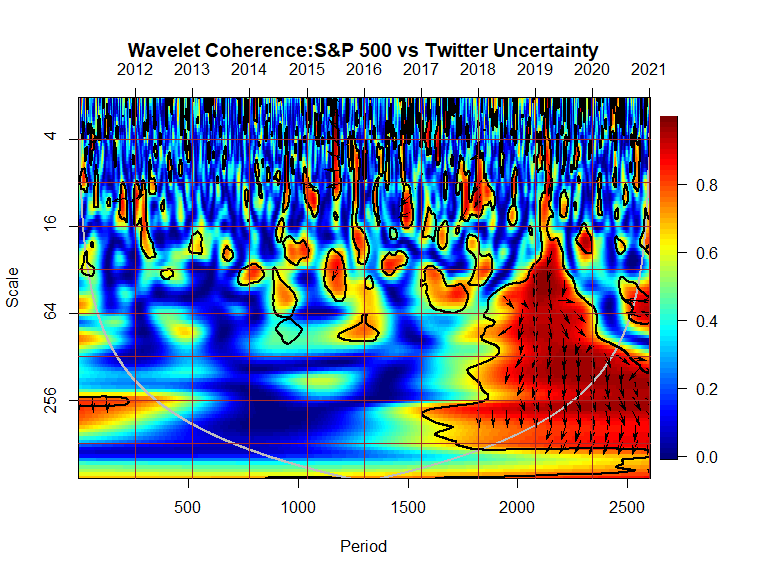
Figure 3 also reveals the results of the wavelet coherence of TEU and S&P 500 index returns. The downward direction of the arrows shows that the first series (TEU) leads the second series (S&P 500 index) and vice versa. Figure 3 shows a significant negative co-movement between S&P 500 index returns and TEU during 2019 at the frequency of 16 to 300 days. The ↙ arrow shows the anti-phase nexus between the S&P 500 index and TEU, with the dominant effect of TEU on the S&P 500 index. Based on the COVID-19 crisis (2020-2021), the red area shows a strong correlation between the S&P 500 Index and TEU over the long term. Figure 3 reveals that the negative co-movement between the S&P 500 Index and the TEU will spread to the 64- to 128-day frequency band in 2020 as the first and second waves of the COVID-19 pandemic hit the stock market, supporting Scherf et al.'s (2022) study. Overall, the results underscore that the US sectors react differently to TEU in the various time and frequency dimensions.

IV. Conclusion
The study examines the time and frequency of co-movement between the TEU and the US energy stocks using the wavelet coherence method. Overall, the results reveal that there is a negative co-movement of the TEU with the energy stocks though a heterogeneous co-movement of the TEU with other sectors. Moreover, the results reveal a positive and significant co-movement of the TEU with the S&P 500 index, at the aggregate level, over the medium- and long-term horizons, while the co-movement became more pronounced during COVID-19.
Our findings have significant implications for policymakers, analysts, investors, and asset managers to hedge their portfolios to get higher portfolio returns, particularly during the pandemic outbreak. The results have also been helpful for foreign investors to understand that US sectors have heterogeneous responses to changes in TEU.
It would be interesting for further studies to conduct this nexus for other developing and developed stock markets. Also, it would be helpful to examine the interdependence of TEU with other asset classes during the COVID-19 pandemic.