I. Introduction
Oil (crude oil in particular) is a main source of energy and a major asset in the commodities market. However, since the 1970s, oil prices have been fluctuating severely. In the last decade, there has been a significant volatility in the price of crude oil (Gharib et al., 2021; Perifanis & Dagoumas, 2019). Effects of the COVID-19 pandemic have driven oil prices extremely low, and the oil sector has experienced both supply and demand shocks (Prabheesh & Kumar, 2021). The first supply shock was triggered during the pandemic due to the failure of Saudi Arabia and Russia to strike a deal in March 2020. Lockdowns in several nations during the pandemic generated demand shocks in the oil business. The COVID-19 pandemic spread fear and uncertainty globally, wreaking havoc on the global economy and exacerbating market volatility. Simultaneously, the spread of COVID-19 created some systemic risk and uncertainty, which had a negative impact on the financial market and global economy (Cui et al., 2021). COVID-19 significantly reduced oil demand, which was already characterized by a high degree of uncertainty, particularly in the US, Japan, and the EU.
In the wake of lockdowns and travel restrictions caused by COVID-19, business activities were shut down, and the demand for oil consumption reduced drastically. Price war between Russia and Saudi Arabia also led to a sharp collapse in crude oil prices. As such, the global oil price reduced from US$61 on December 31, 2019 to US$9 on April 4, 2020. The pandemic has also led to economic uncertainty and volatility in the financial markets, which has contributed to fluctuations in oil prices (Bourghelle et al., 2021; Devpura & Narayan, 2020; Narayan, 2020; Narayan & Liu, 2011; Prabheesh et al., 2020; Sha & Sharma, 2020). The OPEC+ group of oil-producing countries made production cuts in an attempt to stabilize the market, which also had an impact on the price of oil. COVID-19 news and information by the media played a key role in disseminating economic shocks across the market and degrading investor sentiments (Bourghelle et al., 2021).
Various theories show that economic uncertainty may impact crude oil prices. According to the investment theory, uncertainty can have an effect on investment choices in the oil sector. Due to the uncertainty of future pricing, businesses may be hesitant to engage in exploration and production initiatives. Thus, oil price volatility can cause economic uncertainty (Bernanke, 1983; Henry, 1974; Mohn & Misund, 2009). Similarly, the speculation theory highlights that market uncertainty might stimulate speculative activity in the oil sector. Because uncertainty increases risk, it might draw speculators’ attention to those hoping to make money from price fluctuation (Kilian & Murphy, 2014). Researchers, decision-makers, and investors are continuously interested in discussions about changes in oil prices and other macroeconomic variables.
The present study contributes to the existing literature in several ways. First, the study examines the dynamics of oil price returns in the presence of COVID-19 uncertainty. While most existing studies (Devpura & Narayan, 2020; Narayan, 2020; Prabheesh et al., 2020) have focused on understanding the relationship between oil price volatility and the COVID-19 pandemic and commodity and stock market relations for the entire period, the present study goes a step ahead to examine the relationship between oil price returns and the COVID-19 uncertainty index. This study employs different frequency regimes, particularly Breitung & Candelon’s (2006) frequency domain Granger causality (herewith BCG). Whereas most studies used only the COVID-19 confirmed cases for their estimation process, this study used the aggregate COVID-19 index and COVID-19 uncertainty index developed by Narayan et al. (2021). Therefore, this study obtained a relatively more robust result than other studies.
The rest of the paper is constructed as follows. Section II describes the dataset and variable sources; section III explains the methodology used in the estimation process; section IV describes the empirical findings of the study; and finally, section V concludes the study.
II. Data and Sources of Variables
The present study examines the impact of the COVID-19 pandemic on oil price returns from 31st December 2019 to 28th April 2021. We employed the well-known oil price benchmark, the West Texas Intermediate, for daily data on closing oil price from the US Energy Information Administration (https://www.eia.gov/). Oil price returns were measured as the logarithmic of first difference of daily closing prices. For more appropriate measures of COVID-19 uncertainty and fear index, the study used aggregate COVID-19 index and COVID-19 uncertainty index data (Narayan et al., 2021); 327 keywords from 100 major newspaper sources were used to construct the COVID-19 index variables. Thus, the COVID-19 index dataset was more valuable compared to using confirmed cases of COVID-19. Narayan et al. (2021) provide a more detailed understanding of the index and information about the keywords used to construct the index.
III. Methodology
A. Granger Causality based on VAR framework
To determine the causal relationship between the aggregate COVID-19 index, COVID-19 uncertainty index and oil price returns, the study applied the Toda & Yamamoto (1995) causality test, henceforth called TYM. It has an advantage over the traditional Granger causality test, as it is applicable even if the Vector Auto Regression (VAR) is stationary, integrated in any order or is a combination of both. The TYM also considers the modified Wald Chi-square test and can be expressed as follows:
Yt=α0+∑i=1c+dmax
X_{t} = \beta_{0} + \sum_{i = 1}^{c + d_{\max}}{\beta_{1i}Y}_{t - i} + \sum_{i = 1}^{c + d_{\max}}{\varnothing_{1i}X_{t - i}} + u_{2t}\tag{2}
Where, stands for oil price returns and stands for the aggregate COVID-19 index, and and are two residual series of the models. If the null hypothesis of “Y does not Granger cause X” is rejected, it means that for i=1, 2,…,c. On the other hand, when the null hypothesis of “X does not Granger cause Y” is rejected, it means that for i=1, 2,…,c. This model follows a seemingly unrelated regression procedure, where is the optimal lag selection based on the Schwarz information criterion and refers to the maximum order of integration. The augmentation stands for the addition of more lags based on the order of integration of the time series.
B. Frequency-domain Granger causality
By considering the “infinite time horizon,” the time-domain causality explains a single statistical measure that takes the entire frequency analysis into account. However, Geweke (1982) suggests that causal relations may vary across different frequencies. Thus, the problem of a nonlinear frequency domain causality graph arises. To address such difficulties, Toda & Yamamoto (1995) suggested the parameters autoregressive process to the VAR model and allowed different frequency domain approaches within the causality of various frequency intervals. The BCG approach has also been tested in the literature (Bouri et al., 2017). In the present study, the BCG test was used to examine the causal effect of the aggregate COVID-19 index and COVID-19 uncertainty index variables) on oil price returns variables) in a VAR equation. The testing procedure is clearly explained through the following equations.
\begin{aligned} X_{t} &= \alpha_{1}X_{t - 1} + \ldots + \alpha_{p}X_{t - p}\\ & \quad + \beta_{1}Y_{t - 1} + ..\beta_{p}Y_{t - p} + u_{1t} \end{aligned}\tag{3}
H_{0} = R(w)\beta = 0,\tag{4}
Where is the vector of coefficient ‘Y’, i.e., and
R(\omega) = \left( \binom{cos(\omega)}{sin(\omega)}\ \binom{\cos(2\omega)\ldots.}{\sin(2\omega)\ldots.}\binom{cos(p\omega)}{sin(p\omega)} \right)
Here, BCG uses the null for the frequency interval with the presence of an F-statistic distributed approximately at in a graphical representation. The frequency parameter “” measures the time span “T” (short and long period). The “long-run causality” is equivalent to the definition of causality at frequency zero, but the frequency should be higher for “short run causality.” It can be shown that the lower the frequency zone the higher the time period (T) and vice versa; as “T =”
IV. Empirical results
A. Time domain TYM causality test results
Table 1 reports the stationarity test results. As indicated by the Augmented Dickey Fuller (ADF) and Phillips Perron (PP) test statistic, the model is stationary at level.
Next, we examined the time domain TYM causality from the COVID-19 aggregate index to oil price returns and from COVID-19 uncertainty to oil price returns. The result of Table 2 shows that the null hypothesis, “the COVID-19 aggregate index does not Granger cause oil price returns,” is rejected at a 1 percent level of significance. Thus, COVID-19 aggregate index has a causal effect on oil price returns, but reverse causality is not feasible. The results also indicate that the COVID-19 uncertainty index has a causal effect on oil price returns at a 10 percent significance level.
B. Frequency domain (Spectral) BCG causality
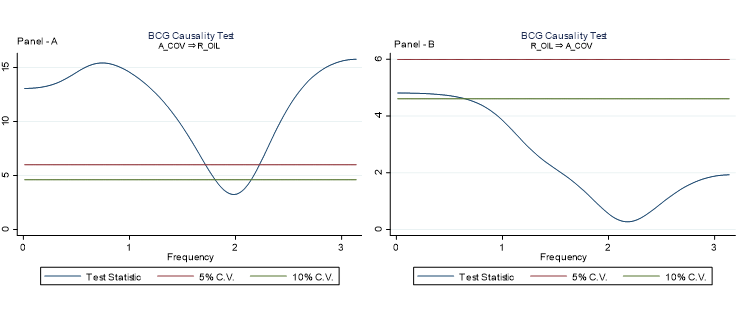
Regarding the frequency domain causality, the study examined the spectral causal relationship between low- and high-frequency shocks of the aggregate COVID-19 index and returns on oil price at different time frequencies. In this study, panel A and B in Figure 1 clearly show the causal relationship between the aggregate COVID-19 index and oil price returns at various time intervals during the COVID-19 period. The spectral causality technique allows frequencies to be split into different time periods and causal figures to be evaluated at different frequencies. From panel A and B of Figure 1, the frequency parameter measures the time span “T” of short and long periods. The lower is the frequency zone and the higher is the time period (T) denoted as "T = As an illustration, frequency = 0.2 corresponds to a long period of 330 days and frequency = 3 corresponds to a short period of 2 days. In this study, we see a significant effect of the aggregate COVID-19 index on oil price returns only for a very short frequency (0 to 1.7), and long frequency (2.2 to 3). The frequency period is significant at a 5 percent level (results are available upon request). The results indicate no causal evidence in the frequency domain from 1.71 to 2.19 as the figure 1 (panel A) is below the 5 percent level. This shows that during the mid-frequency zone (1.7 to 2.2), the COVID index does not predict oil price returns. The aggregate COVID-19 index has predictive power for oil price returns during the very short and long run. On the other hand, panel B shows that there is no spectral causality from oil price returns to the COVID-19 index, as the plotted figure is below 5 percent. Thus, we find the evidence of causality of aggregate COVID-19 index on oil price returns only for very short and long periods.


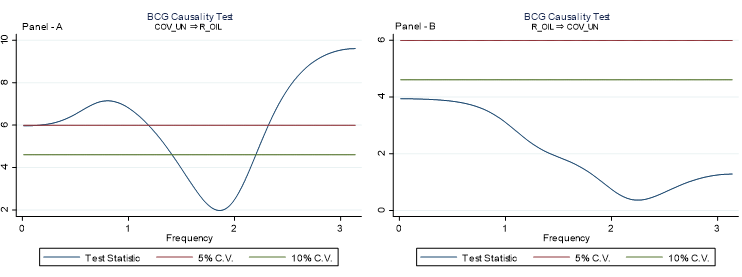
Panel A and B of Figure 2 reveal the causal effect of COVID-19 uncertainty index on oil price returns. Figure 2-panel A shows evidence of causality from COVID-19 uncertainty index to oil price returns for the long period i.e., 330 days (frequency from 0.01 to 1.1) and short period i.e., 2 to 3 days (frequency from 2.3 to 3.5). However, no causal evidence between COVID-19 uncertainty index and oil price returns for the period 1.2 to 2.29, as the spectral causality line is below 5 percent of critical value. In panel-B of Figure 2, we examined the causal effect from oil price returns to COVID-19 uncertainty index. Findings indicate that the whole spectral causal graph is below the critical value and confirms no causality running from oil price returns to the COVID-19 uncertainty index. The study also examined the sub-sample post estimation test. The results show that the COVID-19 index and uncertainty index have significant causal effects on oil price returns. The post-estimation results are available upon request.
V. Conclusion
The present study examined the TYM time domain and BCG frequency domain causal effects between oil price returns and the aggregate COVID-19 index and COVID-19 uncertainty index. First, the findings suggest that there is evidence of TYM causality from aggregate COVID-19 index to oil price returns, and COVID-19 uncertainty index to oil price returns. Second, in the case of spectral time-domain BCG causality, the study found that the causal effect from aggregate COVID-19 index to oil price returns only exists for long and short periods, which is similar to the COVID-19 uncertainty index. This shows that COVID-19 uncertainty may help in predicting oil price returns. Our findings have practical implications for decision-makers and portfolio risk managers in the peculiar era of uncertainty induced by the COVID-19 pandemic. Therefore, investors are encouraged to check the COVID-19 uncertainty situation while investing in the commodity oil market.
Conflict of Interest
The authors declare that they have no competing interests in this study.