I. Introduction
In their ranking of global risks, the World Economic Forum (2016) ranks the failure of climate change mitigation as the most likely impactful risk for the coming decades. Capable of compounding such risk is the increased exploration of oil and other important energy sources, which according to Pindyck (2013) usually results in CO2 emissions and, by extension, unwanted climate risk in the form of higher global temperatures, increased climate variability, and possibly rising sea levels. Concerned by the growing negative impact of climate change, a number of policy instruments have been developed in commitment to the global goal of reducing carbon emissions, thereby mitigating climate-related risks (see Hastings & Smith, 2020). However, the fact that the adoption and implementation of some of the said policy instruments restrict oil use and have an unknown arrival time tend to cause oil firms to accelerate extraction, which in turn leads to a decrease in oil prices as well as the value of oil firms. Motivated by this indication of the probability of oil price-related transition risk from climate change coupled with the increasing financialization of the oil market, it thus becomes inevitable to identify and distinguish the degree of oil market volatility attributable to climate risk from the conventional oil market volatility typically due to innovations. Thus, the focal point of this study is to offer evidence-based insights into how climate change (risk) amplifies oil market volatility, thereby contributing to the literature on the subject matter in two ways.
First, the oil markets have grown significantly over the years, becoming the world’s largest commodities market, as they transitioned from a purely physical to a highly sophisticated and complex financial market (Tudor & Anghel, 2021). With the financialization of the oil market gaining traction following the global financial crisis, higher financial stress has been shown to transmit to higher oil-market volatility (see Bampinas & Panagiotidis, 2015; Bonato, 2019; Gkillas et al., 2020; Nazlioglu et al., 2015). More importantly, the oil market tends to experience volatility through a variety of routes; however, the climate change channel and the extent to which it matters in the volatility dynamics of oil market is only an emerging debate that has received little or no significant attention in the literature. To the best of our knowledge, Gupta and Pierdzioch (2022) as well as Salisu et al. (2022) are the few notable studies that examine the connection between climate change and volatility in the crude oil market. However, while both studies concern themselves with the forecasting/predictive value of climate-risk for oil market volatility, germane to this study is whether climate risk amplifies oil market volatility. Essentially, we decoupled and distinguish the persistence of volatility in the oil market that is due to climate risk from one spurred by innovations in the market. Secondly, we test the robustness of climate risk as an amplifier of volatility across two alternative measures of oil market volatility.
Methodologically, we employ both the standard GARCH model and its extended variant that includes an X component, for instance, GARCH-X. The first enables us to reflect on the dependency of oil market volatility on its own past, while the X term in the latter enables us to investigate the role of climate risk as an amplifier of volatility in the oil market. Empirically, we find oil market volatility attributable to climate risk to be persistent, while volatility due to innovations in the market appears to be temporary. What this portends is that when making investment decisions about portfolio choice in the realm of oil financialization, investors are likely to be better off seeking a greater shield from volatility due to climate risks compared to volatility due to innovations.
II. Data and Methodology
A. Data and preliminary analysis
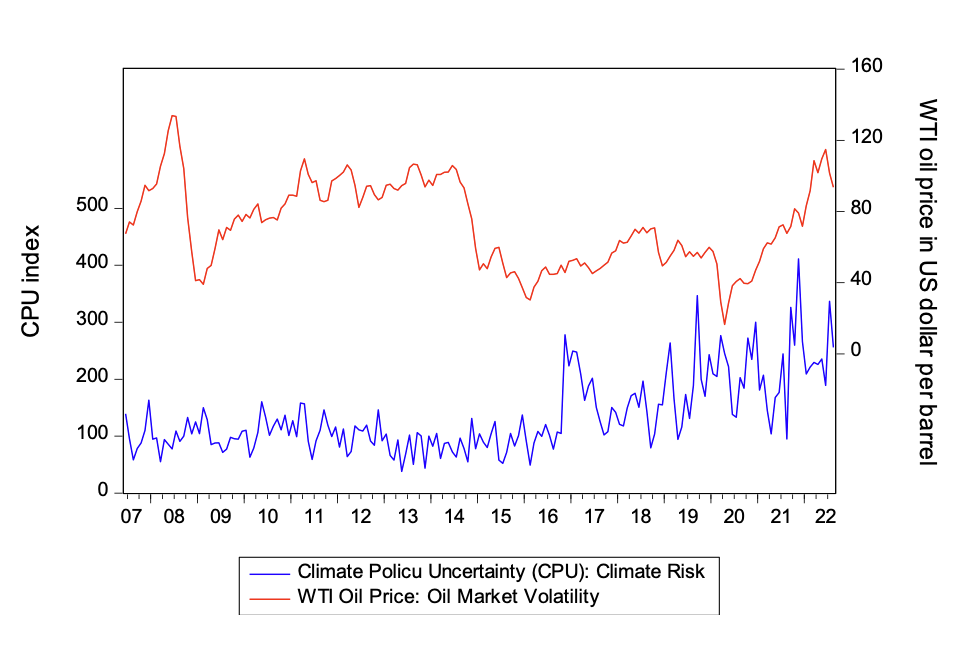
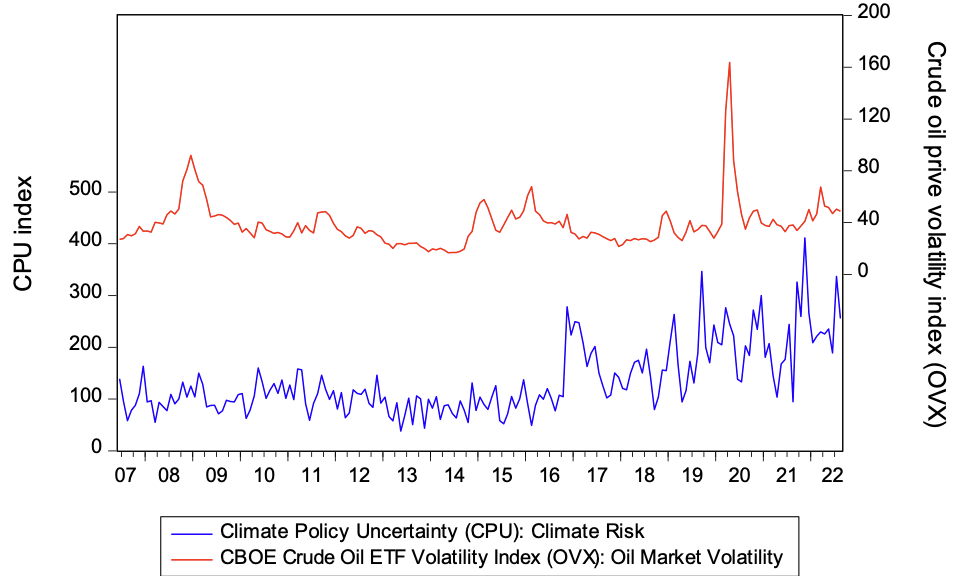
The monthly Climate Policy Uncertainty (CPU)[1] index developed by Gavriilidis (2021) is used as a measure of climate risk in this study. One of the novelties of this study is the use of alternative measures of oil market volatility. On the one hand, we follow the common practice in the literature to measure oil market volatility in terms of the returns of WTI[2] crude oil prices in a GARCH framework (see Salisu et al., 2022). We further complement this approach to modelling volatility in the oil market with the CBOE crude oil ETF volatility index (OVX).[3] However, while the data archiving of the WTI crude oil price has been ongoing since as far back as 1986 and across different frequencies, the OVX is only available on a monthly basis, starting from June 1, 2007. Therefore, in order to allow for a just comparison, we normalize the start date for all the variables to June 2007, while the end date, for instance, August 2022, is uniform across all the variables.
Presented in Tables 1 is a brief statistical description of the variables of interest, where the mean statistic seems to be suggesting that the average CPU, a measure of climate risk, and crude oil price volatility (OVX), are somehow at par for the period under consideration. The standard deviation statistic, which measures the dispersion of the series from their means, reveals the CPU index as the most volatile followed by the OVX, with the WTI the least volatile series. Although the skewness statistic results are mixed across the three variables of interest, the non-zero value of the statistic, which contradicts the rule of thumb, is mostly evident in the cases of WTI and OVX. In another development the kurtosis appears to exhibit a fat-tail feature in the cases of WTI and OVX, while the value at 3.3 in the case of CPU conforms to the rule of thumb.
Confirming the statistical implications of the skewness and kurtosis statistics is the J-B statistic, which rejects the null hypothesis of normality for both WTI and OVX but for CPU. However, the unit root test results confirm all the variables as stationary, and this is not surprising given the fact that the variables are expressed as the logarithm of their first differences (returns). We extend the preliminary analysis to include graphical illustration of the series. A look at Figures 1 and 2 are depictions of trends of possible co-movements between the CPU index and WTI and CPU index and OVX, respectively. However, while a look at the figures shows the CPU and OVX tend to be moving in the same direction, the reverse is largely the case for the CPU and WTI movements. This further strengthens our hypothesis that the role of climate risk as a volatility amplifier in the oil market vary for different indicators of oil market volatility.


B. Methodology
Our methodology begins with the univariate GARCH model of Bollerslev (1986), which is an extension of the Engle (1982) ARCH model. Following Salisu’s (2011) approach, our standard GARCH (p, q) model is as represented in Equation (1), where is the lagged terms of the conditional variance, while is the squared error term.
\[ h_t^2=\delta_0+\sum_{j=1}^q \alpha_j \varepsilon_{t-j}^2+\sum_{i=1}^p \beta_i h_{t-i}^2 \tag{1} \]
For and and it is expected that The term in Equation (1) captures the ARCH effect, while the term represents the GARCH effect in the specification. The GARCH model in Equation (1) can be rewritten using the lag operator (L) as follows.
\[ h_t^2=\delta_0+\alpha(L) \varepsilon_t^2+\beta(L) h_t^2 \tag{2} \]
Here, while the term on the other hand is the polynomial lag operator, which if expressed in line with pth term will take the following form:
The GARCH specification so far is only sufficient to understand the dynamics of oil market volatility that is due to own innovations. Whereas, germane to this study is the question of whether climate risk constitutes a volatility amplifier in the oil market. To address this concern, we employ, as shown in Equation (3), an extended variant of the GARCH model, i.e., GARCH-X, to accommodate the role of climate risk as an underlying source of volatility in the oil market.
\[ h_t^2=\delta_0+\sum_{j=1}^q \alpha_j \varepsilon_{t-j}^2+\sum_{i=1}^p \beta_i h_{t-i}^2+\sum_{n=1}^m \psi_n x_{t-n} \tag{3} \]
where the term in the extended GARCH model is an exogenous regressor that captures climate risk as a potential amplifier of volatility in the oil market.
To validate or refute the hypothesis that climate risk is an amplifier of volatility in the oil market, the degree of the sum of the two main parameters in the standard GARCH (1, 1) would be compared to those obtained from the GARCH-X model in Equation (3). The hypothesis holds if the magnitude of the sum of the parameters is larger for GARCH-X relative to the conventional GARCH (1, 1), and the reverse is the case if otherwise. From a technical point of view, if the sum of alpha and beta is greater than one (1), then the volatility is said to be explosive, and we have an exponential decay model if the sum is equal to one. In another, the volatility is persistent when the value of the sum is close to unity, whereas it is temporary when the value of the sum is closer to zero.
III. Empirical Results
The focal point of this study is the volatility of the oil market and the extent to which climate risk induces it; however, the empirical results in Table 2 include estimates from the mean equations of the estimated variant GARCH models—for example, the coefficients on the AR(1) measure the mean returns in the oil markets. The returns appear to be positive irrespective of the indicator of the oil market under consideration. However, the magnitude of the returns seems higher when the oil market is measured in terms of OVX, both in the conventional GARCH and GARCH-X models. More importantly, we find the shock persistence of the combined ARCH and GARCH effects close to unity in the model that includes the role of climate risk compared to the model without the role of climate risk, thus validating our hypothesis that climate risk amplifies the persistence of volatility in the oil markets. Our findings in this regard find support in Salisu et al. (2022), where climate risk was previously established as capable of fueling higher uncertainties in the global crude oil market. However, and quite innovative in the context of this study, is the fact that the extent to which climate risk amplifies volatility in the oil markets tends to vary for different indicators of oil market volatility. This implies that, in addition to being wary of the possibility of climate risk fueling volatility in the oil market, concerned investors should be aware that the extent to which climate risk induces volatility in the oil market may be sensitive to the measure of oil market volatility under consideration.
IV. Conclusions
We investigate climate policy uncertainty (CPU) as a source of volatility persistence in the oil market, motivated by the increasing financialization of the oil industry on the one hand and the growing climate-related financial risks on the other. To separate the dynamics of oil market volatility induced by own innovations from one induced by climate risk, we use both the traditional GARCH (1,1) model and its extended variation (GARCH-X). We find the oil market volatility caused by climate change to be relatively more pronounced than the volatility caused by own innovations, thus confirming the hypothesis that climate risk is an amplifier of volatility in the oil market. That said, the potential of climate risk as an amplifier of volatility in the oil market appears to vary for different metrics of oil market volatility. As a result, investors in their quest to optimize returns through portfolio selection are likely to seek a stronger shield against volatility due to climate risks than volatility due to innovations, and they are also more concerned with identifying the variant of oil market volatility that is most vulnerable to climate risk.
The CPU was developed using eight leading U.S. newspapers containing some terms relating to uncertainty, regulatory, climatic, and environmental factors. The CPU is obtained from
The WTI crude oil price is downloaded from and online database of FRED Reserve:
The OVX, which is downloaded from the following internet page: https://fred.stlouisfed.org/series/OVXCLS, is an estimate of the expected 30-day volatility of crude oil as priced by the United States Oil Fund (USO).