I. Introduction
Motivated by existing studies that only document the effect of oil shocks on green investments, this study examines the interdependence between oil shocks and green investments within the time and frequency domains framework. This becomes relevant in the current time due to the global clamor for green and clean energy activities as an alternative to conventional energy sources, such as fossil fuel resources, which are highly detrimental not only to the environment but also to the population’s health and the global economy (Yaya et al., 2022). Since 2007, investments in renewable energy sources across advanced and emerging economies have been estimated at over US$1.25billion, paving the way for portfolio decisions in eco-friendly assets (Park et al., 2020). However, the performance of these investments is persistently challenged by different oil market shocks due to their competing nature (Park et al., 2020). Meanwhile, the continuous investments in green resources imply a transition to a green economy and lesser demand for crude oil; therefore, distorting the efficiency of the global oil market (Lee et al., 2021).
The growing concern over climate change among environmental experts, researchers, and policymakers has attracted several studies on the link between oil shocks and green investment; the findings so far are mixed. On one hand, a group of studies including Dutta et al. (2020), Lee et al. (2022), and Yaya et al. (2022) conclude that the changes in green investments are significantly driven by different oil shocks. Contrarily, a study by Lee et al. (2021) support evidence of a bidirectional causality between oil prices and green investments in the United States of America. However, from the documented evidence, the interdependence between diverse oil shocks and green investments over time and frequency domains remains understudied. Meanwhile, activities in global oil market have a potential implication for the green market decisions and vice versa, since their resources are interchangeably used to generate energy. However, the growing desire to promote eco-friendly energy generation poses a huge threat to the performance of the global oil market. Interestingly, diverse oil shocks may challenge green investment decisions differently because oil demand and supply are driven by market forces and lower demand for oil resources can be motivated by an increase in the utilization of green technologies.
Following the limitations of previous studies, this study contributes to the literature in two ways. First, we deploy a dataset on four oil shocks developed by Baumeister and Hamilton (2019) to evaluate the interdependence between oil shocks and green investments from a global perspective. This dataset adds supply, aggregate demand, economic activity, and precautionary demand shocks to the previously developed oil shocks by Kilian (2009) and Kilian and Park (2009), recognizing their potential as oil market risk influencers (Salisu & Gupta, 2021). Second, this study applies wavelet coherence to analyze the interdependence between oil shocks and green investments. This technique is considered imperative to simultaneously understand the dynamics of these series over time (short-, medium-, and long-term) and in frequency domain bands (June 1994 to February 2022), following the persistent fluctuations experienced in both markets over the last few decades. In addition, this method enables us to identify the in-phase and out-phase causality between these variables on time-frequency scales over different tranquil and turbulent periods (i.e., periods before, during, and after the global financial crisis, the 2014–2016 oil crisis, and the COVID–19 pandemic) for policies and investment decisions in the clean and unclean energy markets.
Following this introductory section, Section II discusses the methodology, Section III presents the empirical results, while Section IV concludes the paper.
II. Methodology
The empirical framework follows the construct of Lee et al. (2021), established based on the Granger causality model. Using wavelet coherence analysis, the relationship between oil shocks and green investments is structured in a bivariate system within time and frequency domains. According to Torrence and Compo (1998), the estimation begins with the construction of the cross wavelet transform and cross-wavelet power frameworks such that the sequence of the two series and is expressed as follows:
Qab(r,s)=Qa(r,s)Q∗b(r,s)
From Equation (1), and respectively stand for the two continuous wavelet transforms of and whereas and denote the measure and is the combined conjugate. From Equation (1), being the cross-wavelet transform, is used to generate the cross-wavelet power, which finally resolves the estimation into time and frequency domains such that the time phase depicts the movement in the sequence of the time series at every measure stage. Furthermore, the interdependence between the variables is observed using the wavelet coherence within the time and frequency dimensions by generating the adjusted wavelet coherence coefficient as follows:
L2(r,s)=|D(D−1Qab(r,s))|2D(D−1|Qa(r,s)|2)D(D−1|Qb(r,s)|2)
where represents the smoothing operator and lies between 0 and 1. implies weak correlation, while indicates strong correlation.
III. Results
In this study, we employ a monthly data from June 1994 to February 2022. For the oil shocks series, we deploy the dataset developed by Baumeister and Hamilton (2019), which covers Oil Supply Shocks (OSS), Oil Inventory Demand Shocks (OIDS), Oil Consumption Demand Shocks (OCDS), and Economic Activity Shocks (EAS),[1] and publicly available on the website of the first author via https://sites.google.com/site/cjsbaumeister/research. In the case of green investments, we adopt the Morgan Stanley Capital International (MSCI) Global Environmental Index (GEI), which comprises of investments that ensure exposure to clean technologies. According to Dutta et al. (2020), MCSI-GEI is a parent indicator, which consists of companies that invest in environmentally friendly activities. Therefore, using the historical data of MSCI-GEI retrieved from https://www.MSCI.com, we compute the return series as [2] These series are then analyzed using wavelet analysis, which allows for the examination of causal relationships and the interdependence between green investments and oil shocks over time and frequency domain space using the cone of influence (COI) test.
Table 1 presents the preliminary analyses. Panel A shows that only GEI and OCDS have a positive mean. The maximum and minimum values show the variability of the series with the standard deviation indicating dispersion from their means. Meanwhile, all the variables except OIDS are negatively skewed and leptokurtic complementing the Jacque-Bera statistics that confirm non-normality in the series. Interestingly, one of the superiorities of the wavelet technique over the conventional methodologies is its ability to handle series that are not normally distributed (Sharif et al., 2017). Furthermore, the DF-GLS and Ng-Perron unit root tests in Panel B show that the variables are stationary at level; hence, the series are stable to assume cointegration in the wavelet coherence analysis.
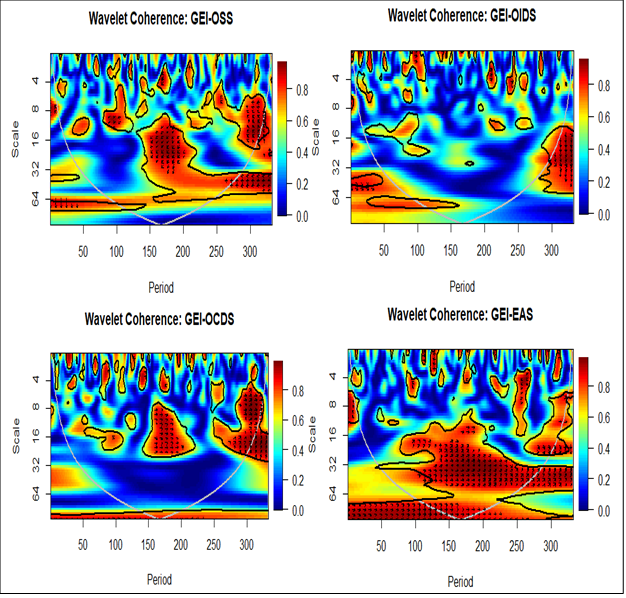
Figure 1 displays the wavelet coherence analysis for the interdependence between diverse oil shocks (OSS, OIDS, OCDS, and EAS) and green investments (GEI). The vertical axis corresponds to the time domain covering short run (0-8), medium run (8-32), and long run (32-128), while the horizontal axis explains the frequency dimension of the series spanning from June 1994 to February 2022 (333 months). The result for GEI-OSS supports causality from oil supply shocks to green investments from September 2002 to January 2011, whereas green investments Granger causes oil supply shocks around March 2015 to February 2022 in the short run and medium run. This confirms evidence of bidirectional causality between the series; although, oil supply shocks significantly trigger investments in green energy during the global financial crisis, whereas green investments influence oil supply shocks mostly around the 2014-2016 oil crisis corresponding to the period of excess supply and low demand for crude oil. In the case of GEI-OICS, the in-phase and out-phase relationship only exists in the short run, where green investments lead around September 2002 and oil inventory demand shocks exhibit Granger movement around January 2011. Hence, the existence of a bidirectional relationship between the series. The results for both GEI-OSS and GEI-OICS are consistent with those of Lee et al. (2021) that show the presence of bidirectional causality between oil prices and green bonds.
_and_green_invest.png)
Meanwhile, the panel for GEI-OCDS reveals that oil consumption demand shocks and green investments affect each other from November 2006 to May 2019, corresponding to periods before, during, and after the global financial crisis and the 2014-2016 oil crisis. These results indicate that shocks to oil inventory and consumption demand enable divestment in crude oil assets and the transition to green technologies and assets investment to ensure a sustainable environment. Simultaneously, green investments impose shocks on oil inventory and consumption demand, thereby creating instability in the global oil market. Turning to the GEI-EAS panel, there is evidence of unidirectional causality from economic activity shocks to green investments from September 2002 to February 2022 in the long run. A closer look at the panel shows that the causation corresponds to the COVID-19 period, known as the period of slowdown in economic activities, which led to the disruption of the global energy market and stimulated investments in green assets and technologies. This conforms to the findings of Lee et al. (2022) and Yaya et al. (2022) that support evidence of a significant influence of oil shocks on green investments.
IV. Conclusion
In this study, we examine the interdependence between oil shocks and green investments over different time and frequency domains from June 1994 to February 2022, using the wavelet coherence analysis. It uses data on the four recently developed oil shocks by Baumeister and Hamilton (2019) and the MSCI-GEI as the proxy for green investments.
In general, our results show that oil shocks related to precautionary demand, consumption demand, and supply have bidirectional interdependence with green investments mostly during the global financial crisis of 2008/2009 and the oil crisis of 2014/2016. Meanwhile, the economic activity shocks seem to have unidirectional causality with green investments predominately during the COVID-19 pandemic. Hence, our evidence supports the presence of interdependence and co-movement among diverse oil shocks and green investments. Interestingly, it also offers answers to the recent discourse on the possible link between the global crude oil and green energy markets and why persistent oil shocks may be influenced by increased demand for clean energy resources to promote a sustainable eco-system.
Our findings imply that, while ensuring environmental sustainability through increased investments in green technologies and assets, the global oil market is adversely affected. This indicates that the process of transitioning to a green economy leads to a phase-out in crude oil resource usage to clean energy utilization. Hence, huge financial asset divestment is expected in the global crude oil market as investors continuously invest in the green energy market for profitable returns in the process of ensuring the continuous development of clean resources. However, efficiency in the green market is paramount to circumvent future adverse shocks during economic, financial, and geopolitical crises.
In addition, shocks to oil supply, precautionary demand, consumption demand, and economic activity during the global oil crisis of 2014–2016 as a result of excess supply and low demand for crude oil influenced the level of green investment, suggesting that periods of economic downturn in the global energy market instigate investment in green energy and technologies. Hence, financial market investors need to be conscious of shocks to crude oil demand and supply during turbulent periods in order to avoid divestment of crude oil assets for investment in green energy because, while the world needs to transition to green energy, the role of crude oil resources cannot be downsized during the transition period.