I. Introduction
Crude oil is a strategic resource that is essential for the operation of the overall economic system worldwide. According to the Energy Information Administration, China is the world’s largest crude oil importer—70% of its crude oil is foreign sources.[1] To establish a domestic trading standard and help investors hedge against investment risks, China initially introduced the Shanghai crude oil futures (SC) on March 26, 2018.[2] Although the Shanghai crude oil market has now become the largest crude oil trading platform in the Asia-Pacific region and the world’s third largest in terms of scale and volume, the development of China’s crude oil market is still in its initial stage.
Studying the evolution of the correlation between the SC and mature oil markets is important due to the following reasons. Identifying the dynamic market correlation between the SC and international benchmarks could help policymakers examine the long-standing hypothesis regarding the oil market integration and the response of the Chinese crude oil market to external shocks (Huang & Huang, 2020; Ren et al., 2022). It could also enhance policy effectiveness on regulating the domestic oil market, especially during the period of market downturn associated with the ongoing COVID-19 pandemic. For investors, studying the degree of the oil market integration could provide investors with the cross-market information that helps improve the efficiency of arbitrage and hedging the risks related to their investment portfolios (Chan & Woo, 2016). The dynamics of the degree of the oil market integration are analyzed mainly in three different scenarios: the outbreak of the COVID-19 pandemic; post-pandemic; and the period when international oil prices rose.
So far, many existing studies have explored the relationship between international crude oil markets. Lu et al. (2014) find that the Brent and West Texas Intermediate (WTI) crude oil futures prices dominate the global crude oil price dynamics. Liu et al. (2020) show that there exist volatility spillovers between international crude oil markets, and that the correlation depicts a varying pattern over time. Ji et al. (2015) and Caporina et al. (2019) point out that the long-term correlations in the global crude oil market exist only before 2010, after which the global crude oil markets tend to diverge and driven by the market fundamentals.
At the same time, there exists ongoing, but still scant literature on the co-movement between the Chinese and international crude oil markets. In this literature, Yang et al. (2020) find a cointegration relation between the two crude oil futures markets. Huang et al. (2020) find the correlation between the Chinese crude oil futures and international oil prices to be relatively weak and time-varying. Wang et al. (2022) also find that relations between the SC and international oil benchmarks are weak, and that the SC market has response lags relative to those benchmarks. Palao et al. (2020) find that Chinese crude oil futures prices have negligible influence on prices of WTI and Brent oil futures. Zhang et al. (2021) point out that the pricing power of the SC is limited compared to the international oil prices. They demonstrate that the Chinese oil price dynamics appear to have an increasingly important role in driving the Asian oil price transmission.
In addition, only few studies focused on the impact of COVID-19 on the crude oil future market integration. To our knowledge, only Zhang (2021) examines and finds an increasing integration of the Chinese oil market with the global crude oil markets in the face of the global health crisis.
Previous studies mainly consider the short-term (daily) oil market correlation, while ignoring the long-term term correlation. To this end, we fill this gap by examining the dynamics and the degree of the oil market integration in both the short- and long-terms using the GARCH-MIDAS and DCC-MIDAS models. We represent China’s oil market by the recently-developed SC and the international oil market by the WTI and Brent crude oil futures prices. The daily conditional volatility is divided into two components, i.e., short-term and long-term. A mixed-frequency data sampling (MIDAS) regression to long-term frequency is employed to capture the long-term components. As a first step, we estimate the price return of the SC, WTI, and Brent by using the GARCH-MIDAS model. Then, the dynamic conditional correlations of SC-WTI and SC-Brent are, respectively, examined by using the DCC-MIDAS model.
Our main findings are mainly summarized as follows. First, the market correlation has increased since the COVID-19 outbreak and peaked in June 2020. Second, as the pandemic in China tapers off over time, the market correlation weakens, which implies a decrease in crude oil market integration. Finally, the correlation strengthens when international oil prices significantly increase from October 2021 onwards. Our research contributes to the existing literature by studying the short- and long-term correlations between Chinese and international crude oil markets. Our obtained findings offer an essential reference for a clear comprehension of the oil market integration in the different time horizons. Our findings possess important implications for effective and timely supervisions of the oil market dynamics to prevent excess systemic risks.
II. Data and Methodology
A. Data
The SC, Brent, and WTI oil prices are from the Wind database and ranges from March 27, 2018 to January 31, 2022. Table 1 shows the logarithmic returns of the three markets over the sample period. The SC has the lowest mean and standard deviation, whereas the WTI has the largest. In terms of distribution, all the three markets show a negative skewness, suggesting that the left tail of the return distribution holds higher weight for crude oil prices in three crude markets. The null of the Augmented Dickey-Fuller statistic for each of the target series is rejected at the 1% significance level, which suggests that each return series is stationary.
B. Methodology
B.I. GARCH-MIDAS Model
We use a GARCH-MIDAS approach to forecast crude oil futures volatility. Engle et al. (2013) multiplicatively decomposed the conditional variance into short- and long-term components.
Daily returns are defined as where and We follow Engle et al. (2013) and express
ri,t=μ+√τtgi,tεi,t,∀i=1,⋯,Nt
The long-term component is whereas the short-term component is which accounts for daily changes. The short-term component follows the GARCH(1,1) process as:
gi,t=(1−α−β)+α(ri−1,t−μ)2τt+βgi−1,t.
The long-term component is expressed as:
τt=m+θK∑k=1φ(ω1)RVt−k
where follows the beta lag polynomial process:
φ(ω1)=(1−kK)ω1−1∑Kl=1(1−lK)ω1−1
B.II. DCC-MIDAS Model
We use the DCC-MIDAS model developed by Colacito et al. (2011) to investigate the market dynamic correlation. Based on the GARCH-MIDAS model, the model is extended to a DCC-MIDAS model. We derive the monthly DCC by choosing period as follows:
qi,j,t=¯ρi,j,t(1−a−b)+aεi,t−1εj,t−1+bqi,j,t−1
¯ρi,j,t=KijC∑l=1φl(ωijr)ci,j,t−1
ci,j,t=∑tk=t−KijCεi,kεj,k√∑tk=t−KijCε2i,k√∑tk=t−KijCε2j,k.
where and correspond to the different crude oil markets; are the short-term correlations between and represents the long-term correlations; are the standard residuals in the GARCH-MIDAS model; and are lagged order of historical correlations.
III. Empirical Results
The GARCH-MIDAS model is the first step of the DCC-MIDAS, which we built for the three crude oil markets by using the realized volatility of the three markets. Table 2 shows the results from the GARCH–MIDAS models for the different crude oil markets. The results and for the daily component in the GARCH–MIDAS models are positively significant at the 1% level, which indicates that the three market returns exert a significant volatility clustering effect in both the long and short terms. Specially, both the WTI and Brent prices have higher s (of nearly 0.8), implying a higher level of daily volatility clustering than that of the SC. The parameter for Brent in the GARCH-MIDAS model is statistically insignificant, meaning that realized volatility has a negligible influence on the monthly component of crude oil futures’ daily volatility.
To find the dynamic correlations between SC and global oil benchmarks, we divide the returns into short-term and long-term components, and interact them in the DCC-MIDAS model. Table 2 indicates that the DCC-MIDAS model coefficients are statistically significant at the 5% level, except for the parameter a for the SC-WTI interaction. Only w is significant in the SC-Brent relation, indicating that realized volatility has little influence on the oil market correlation.
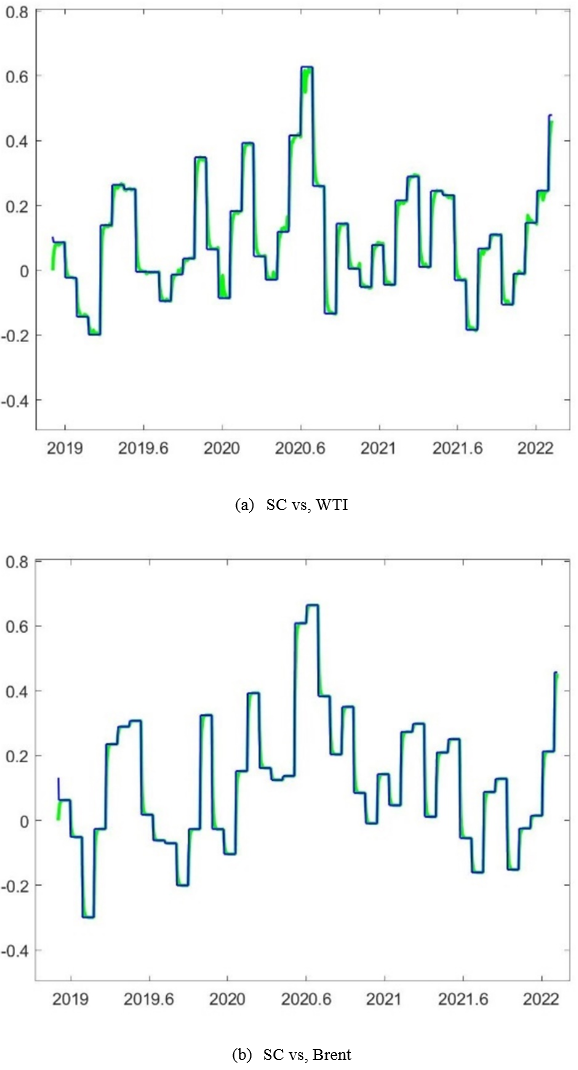
Figure 1 depicts the time- variations of the daily and monthly components of the dynamic correlations between the Chinese crude oil futures market and international benchmarks. The green line in the figure shows the daily correlation, while the blue line shows the monthly correlation. The patterns of daily and monthly volatilities and correlations are very similar, and the trends are comparable in both figures, especially during the pandemic period. The correlation between the SC and international oil benchmarks has fallen to its lowest point in history at the end of 2019, the outbreak of COVID-19. However, after the COVID-19 outbreak, the correlation between the SC and other crude oil futures increased gradually, peaking at nearly 0.65 at around July 2020. In the post pandemic period, the correlation dropped to 0.2 and then stabilized between -0.2 and 0.2. The empirical results are in line with the existing literature and illustrate that although the relation between the Chinese crude oil market and the international markets has increased in the short term after the pandemic; the integration has then decreased gradually, showing a tendency of localization of the oil market dynamics (Wang et al., 2022; X. Zhang, 2021).

In addition, Figure 1 also shows that, as the international crude oil prices rose, the correlation between the Chinese and international crude oil futures markets rose, especially from the October 2021 to January 2022; at the end of January 2022, the correlation reached 0.5, which is a new peak since COVID-19 outbreak. Following the launch of the COVID-19 vaccination campaign and the gradual recovery of the global economy, the demand for international crude oil has grown, giving a stronger upside momentum to international crude oil prices. The Chinese crude oil market, which is a lagging recipient of international crude oil prices (Wang et al., 2022; Wen et al., 2022), has been affected by the sharp rise in international prices. As a result, the dynamic correlation is also rising.
IV. Conclusion
The paper employs the DCC-MIDAS model to investigate the dynamic correlation between Chinese and international crude oil futures prices. We find that both our measures of international crude oil futures prices, namely WTI and Brent, exhibit a higher level of daily volatility clustering than our measure of Chinese crude oil futures prices (i.e. the SC). We further find that the dynamic correlation between Chinese and international oil prices grew rapidly since the COVID-19 outbreak and peaked in June 2020. The correlation weakened from July 2020 to September 2021 and strengthened from October 2021 to January 2022, as international oil prices sharply rose.
These findings have important implications for various stakeholders. While China’s crude oil futures market has recently witnessed rapid development, the degree of its integration with global oil markets has long remained relatively low. However, since the COVID-19 outbreak and the heightening level of the international crude oil price, China’s oil market integration with global oil market has gradually increased. It is therefore important for policymaker to supervise the international crude oil market fluctuations and to suppress excessive cross-market risk contagions to ensure financial stability. Different investors with time-varying investment horizons should gain a clear interpretation of the extent of the oil market integration from our estimates and thus are better positioned to adjust their positions in the domestic market with high efficiency of arbitrage and hedging.