1. Introduction
Russia’s invasion of Ukraine on the 24 February 2022 has seen an intricate development in crude oil prices, since the oil market experienced structural changes. This raised the following questions: (i) does the Russia–Ukraine war influence oil prices? and (ii) is there evidence of a causal relationship between the war and oil prices? (iii) if yes, what is the direction of causality?
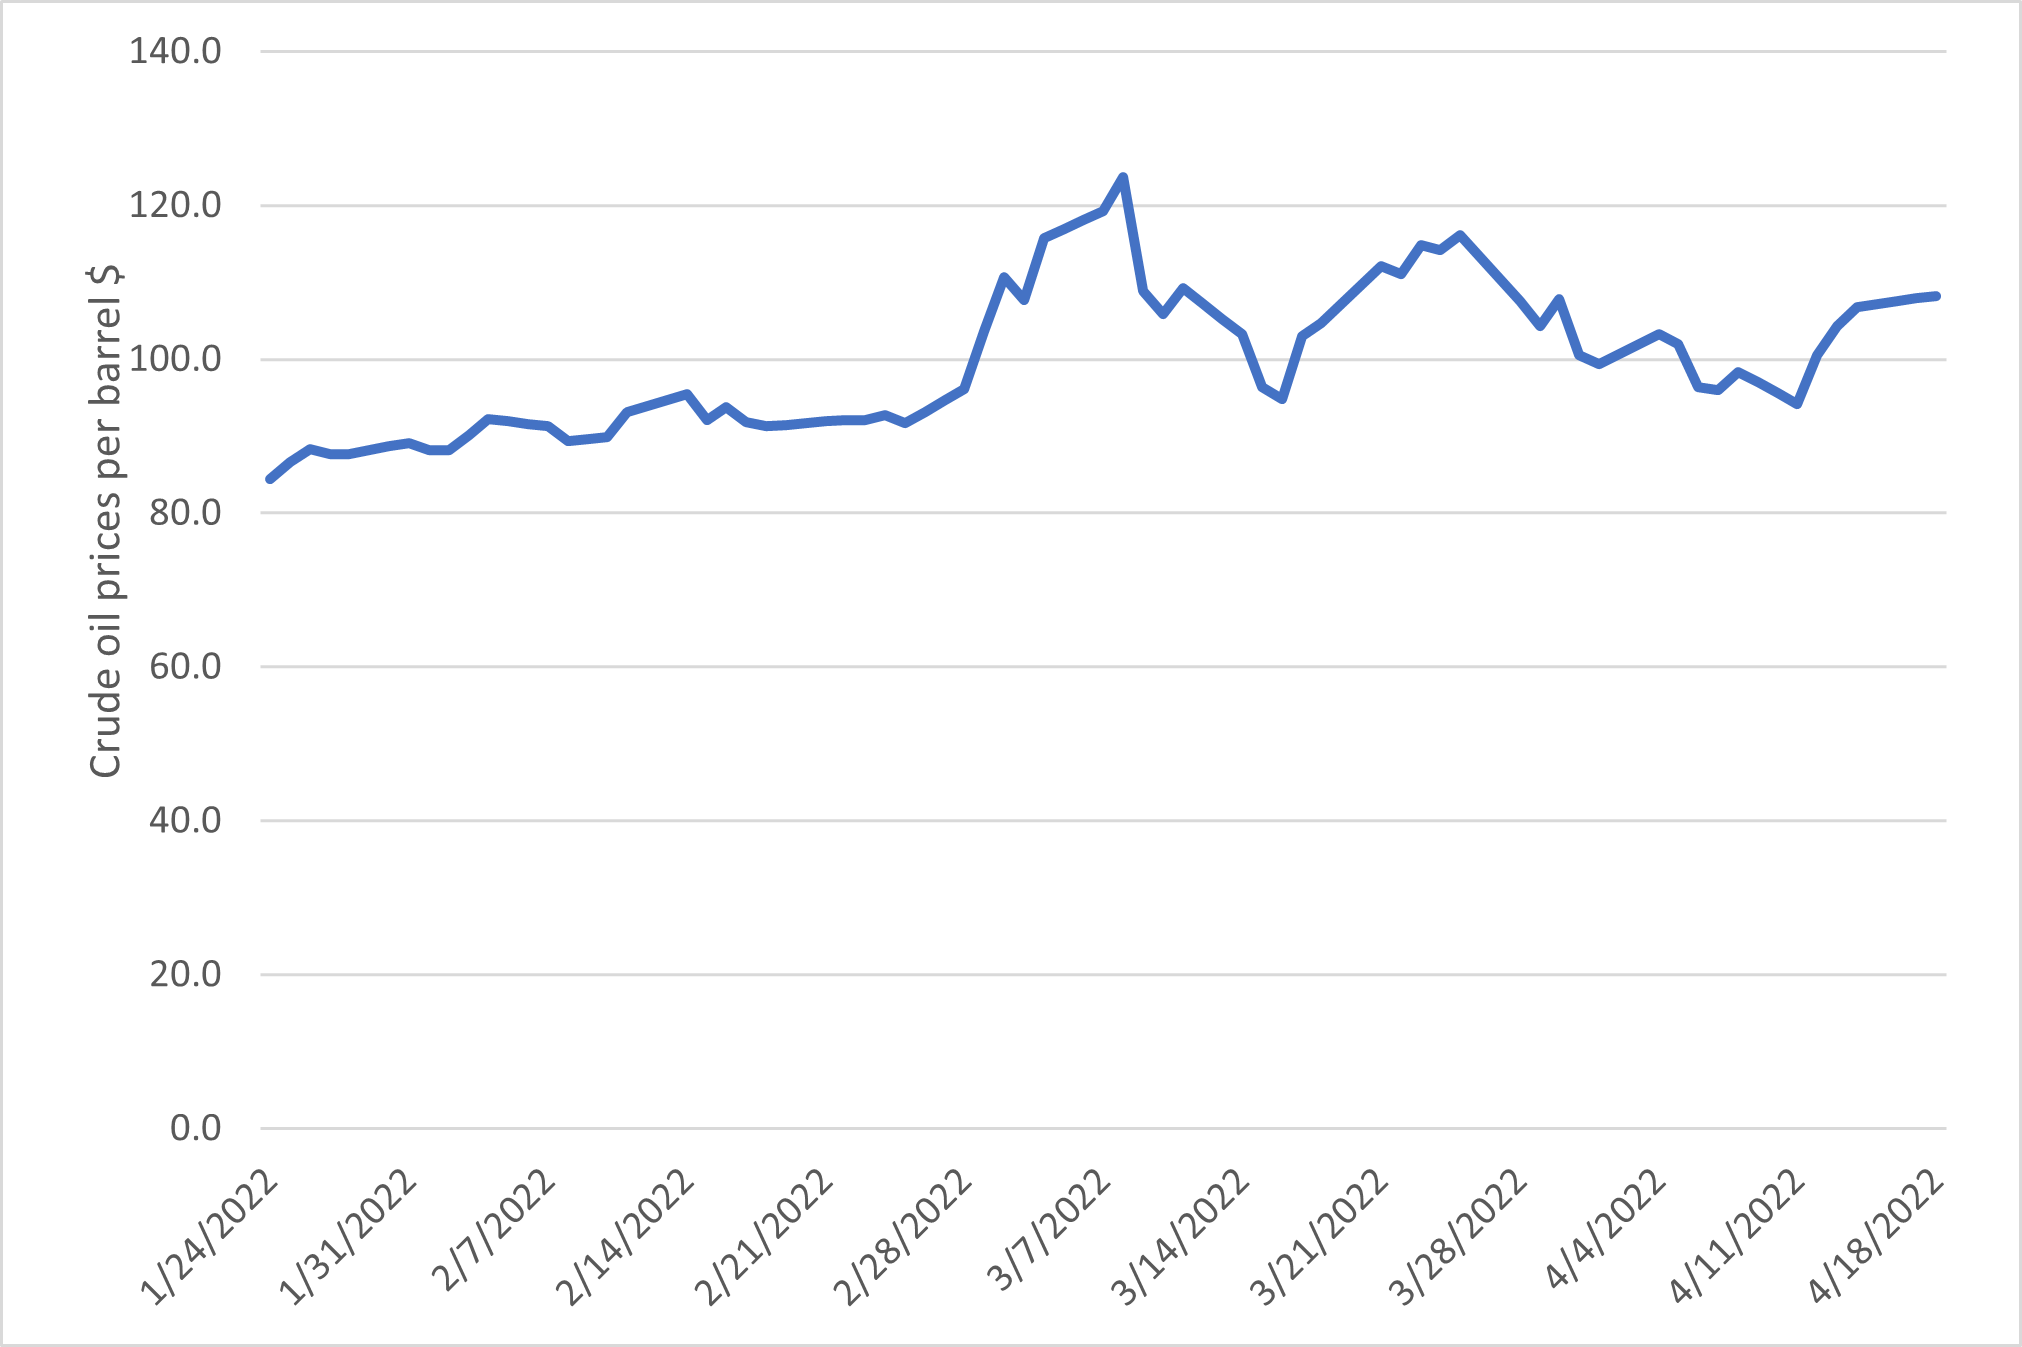
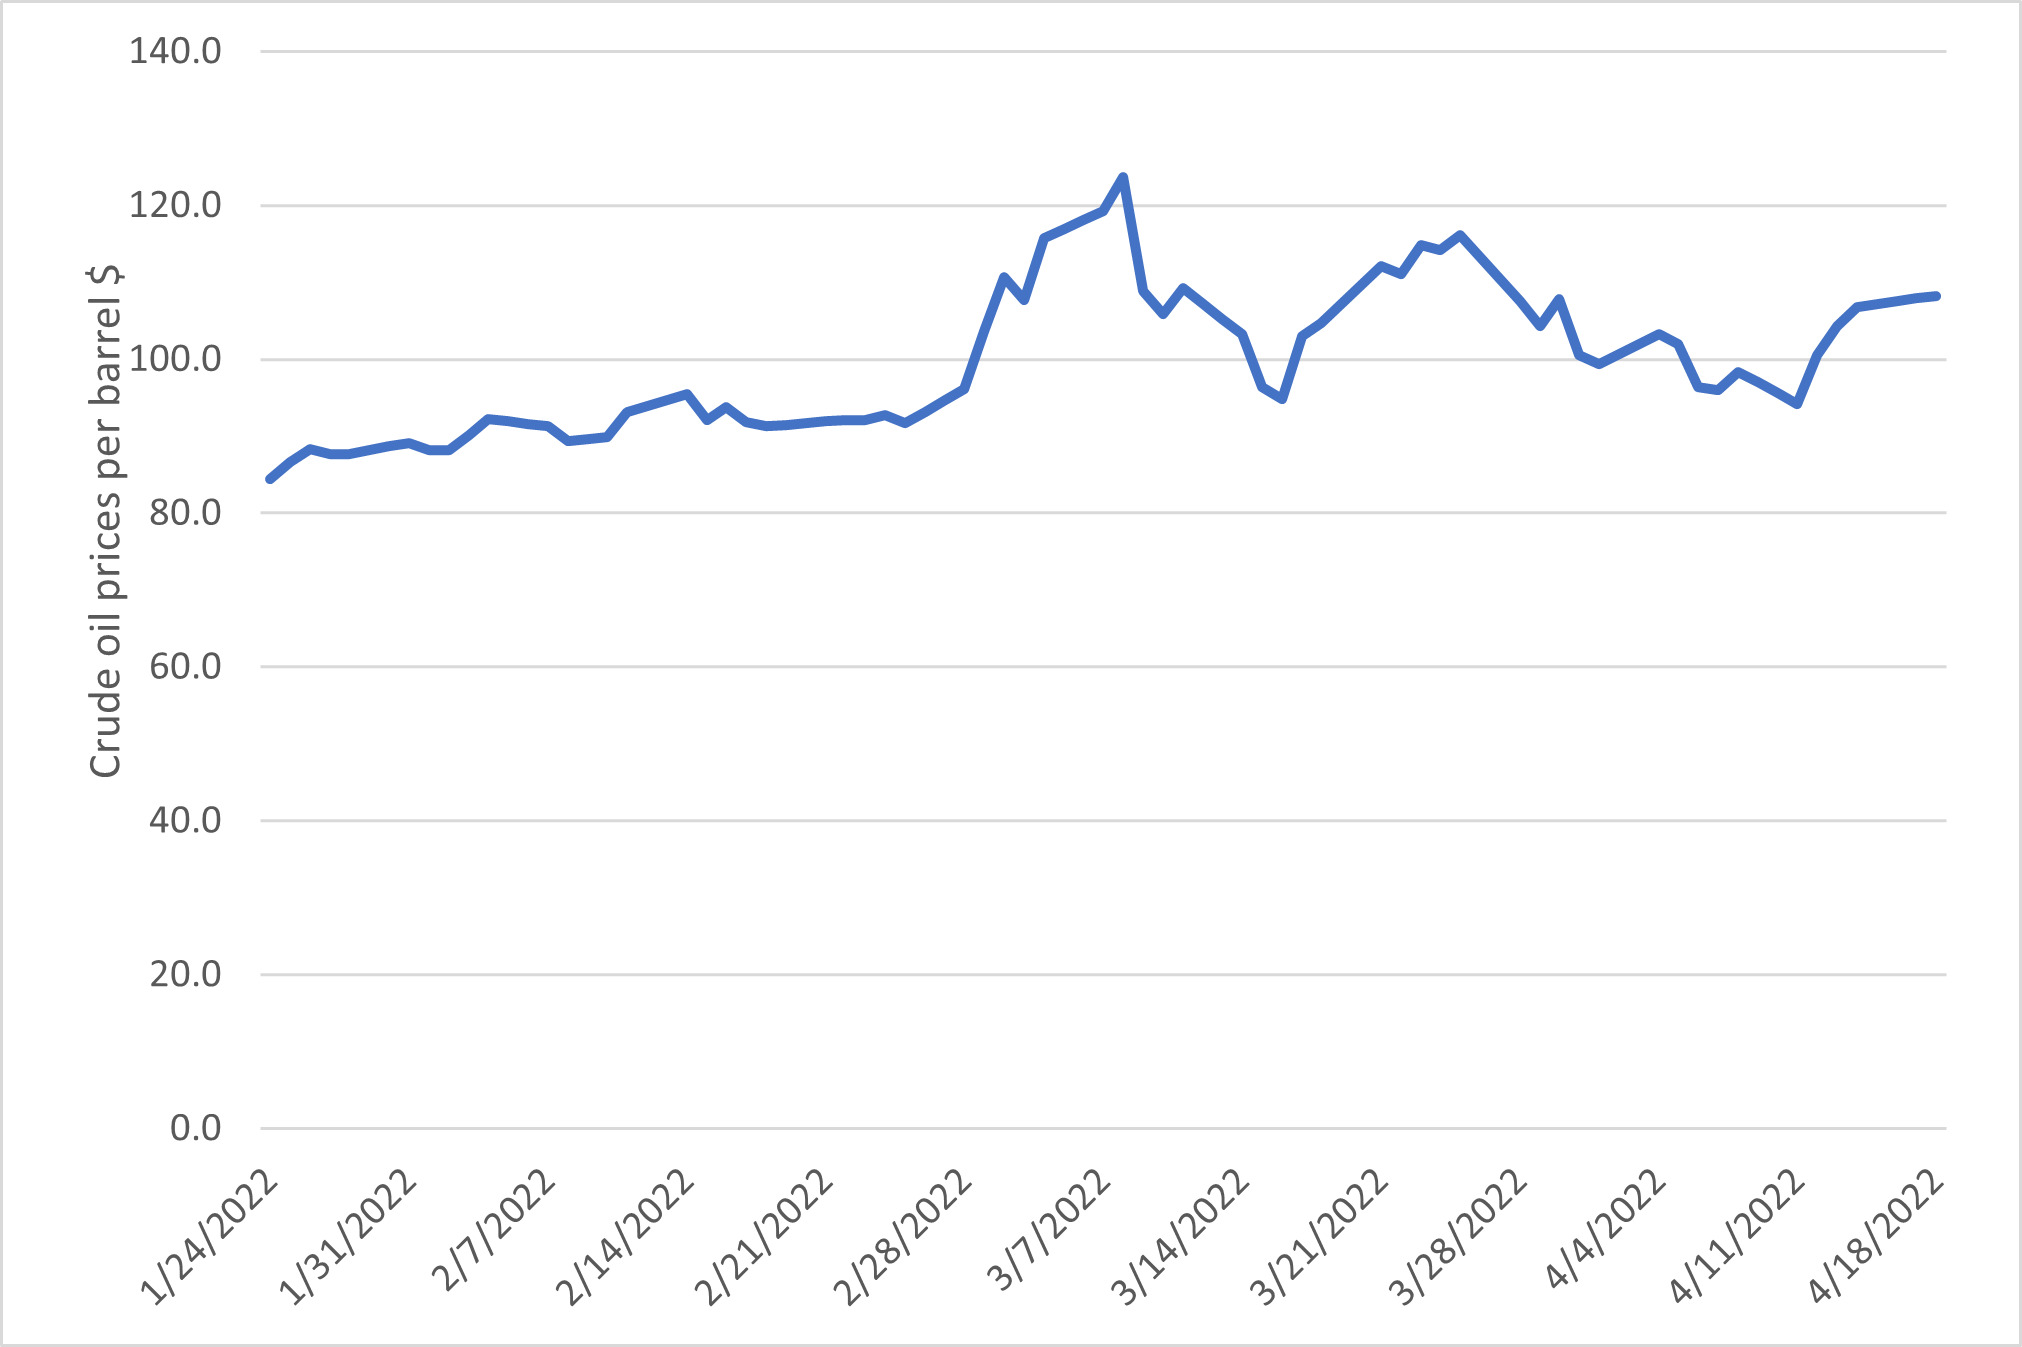
To answer these questions, this study employed the US, a major oil producer, as a case study. The focus on the US is justified by the Biden administration’s embargo on the importing of Russian crude oil since the start of the war. Following the embargo, the US has seen swings in its crude oil prices (see Figure 1). Fluctuations in oil prices are known to impact all aspects of the economy, including company earnings, household spending, and the entire economy (Bassil et al., 2018; Iyke, 2019). Accordingly, this study hypothesised that the Russia–Ukraine war could influence US oil prices. Testing this hypothesis for the US would guide policy decisions, since oil price changes impact everyone.
The study made the following additions to the literature. Firstly, this, to the authors’ knowledge, is the first research to quantitatively measure the impact of the Russia–Ukraine war on oil prices. By focusing on the Russia–Ukraine war, this study contributed to the scant research on the influence of war/terrorism (see Blomberg et al., 2009; Kollias et al., 2013; Ma et al., 2021; Ruiz Estrada et al., 2020; Wang & Sun, 2017) on oil prices. Secondly, this study contributed to the extensive literature on the drivers of oil prices. For instance, extant studies have documented economic policy uncertainty, political factors, financial factors, trading factors, and the more recent COVID-19 pandemic as the drivers of crude oil prices (see Atri et al., 2021; Lin & Bai, 2021; Narayan, 2020). This study extends these studies by also exploring the impact of the Russia–Ukraine war and economic policy uncertainty on oil prices. Thirdly, in terms of methodology, this study used the quantile regression model to estimate the impact of war on oil prices. In contrast, most studies on the drivers of oil prices have used the vector autoregression, generalised autoregressive conditional heteroscedasticity, and structural equation models. The quantile regression model has the advantage of capturing the distribution of oil prices. This technique also helps capture the impact of the Russia–Ukraine war on oil prices across various quantiles. Finally, this study applied the wavelet coherence analysis to explore the causal association between the Russia–Ukraine war and oil prices. This technique captures the co-movement of the variables across time and frequencies, which the ordinary causality analysis of Dumitrescu and Hurlin (2012) fails to capture.
Section II of the paper focuses on data and methods. Section III presents the results and discussion, and Section IV contains the conclusion.
II. Data and Methodology
A. Data
This study used daily data for the period from 24 January 2022 to 18 April 2022. Although the war began on 24 February 2022, many global leaders had long planned for it and felt it was only a matter of time until it began (Boungou & Yatié, 2022). This is why the study commerce on 24 January 2022. The study used Google Trends (which is available at https://trends.google.com/trends) to gather the data on the Russia–Ukraine war (war). We searched the key term Russia and Ukraine and war over a 90-day window. We measured oil prices (oil) using the West Texas Intermediate oil price data. We used oil price returns, computed as in the empirical analysis. Finally, we controlled for economic policy uncertainty (epu). We retrieved the oil price and economic policy uncertainty data from the Federal Reserve Economic Data at https://fred.stlouisfed.org/. All the variables, except oil price returns were log-transformed to ensure coefficient estimates were elasticities (Appiah-Otoo, 2021).
B. Methodology
This study used the quantile regression of Koenker and Hallock (2001) for our empirical analysis. Quantile regression offers a method for evaluating conditional average performance models as well as a wide range of many other conditional quantile functions (Zeinedini et al., 2022). Quantile regression can generate more comprehensive statistical estimates of the randomized interactions among regressors (Koenker & Hallock, 2001) and hence was appropriate for this study. The quantile regression is specified as follows:
yt=α0+φqxt+μt
where represents the natural logarithm of oil prices is a vector of covariates (i.e. the natural logarithms of economic policy uncertainty and the Russia–U.kraine war denotes the error term; denotes time; represents the constant term; and represents the quantile of the conditional distribution.
This study also used the wavelet coherence analysis of Torrence and Compo (1998)[1] to explore the causal association between the Russia–Ukraine war and US oil prices. Wavelet coherence analysis helps to calculate the spectral characteristics of a dataset concerning time (Torrence & Compo, 1998) and to identify the short- and long-term causal links between the Russia–Ukraine war and oil prices.
III. Results and discussion
Table 1 shows the results. The upper part of the Table shows the results for the impact of the Russia–Ukraine war on oil prices, while the lower part shows the results for the impact of the Russia–Ukraine war on oil price returns. Focusing on oil prices, the results show that economic policy uncertainty has an insignificant effect on oil prices across all quantiles. This finding could be attributed to the short sample period. The oil price market usually takes a longer time to comprehend the noise in trade (Hammoudeh et al., 2022). The results also show that the Russia–Ukraine war has a positive and statistically significant effect on oil prices across all quantiles, except the first. The results also show that the Russia–Ukraine war has a positive effect on US oil prices. These are new findings in the literature. Thus, policies that reduce oil prices, such as transition towards renewable energy sources like wind and solar energy, increasing domestic supply from spare capacity, reduction in oil taxes and value-added taxes, provision of government incentives, prioritizing digital economy, and using of sharing economy services (such as shared cars and bike) would help cut oil prices.
Turning to oil price returns, the results show that economic policy uncertainty has a statistically significant positive effect on oil price returns in the 75th quantile. This implies that economic policy uncertainty inhibits firm investment leading to an increase in oil prices in the medium and long term and thereby resulting in higher oil price returns. This supports the findings of Hammoudeh et al. (2022). The results also show that the Russia–Ukraine war reduces oil price returns in the 25th and 50th quantiles, while it increases oil price returns in the 75th and 90th quantiles; however insignificant even at the 10% level.
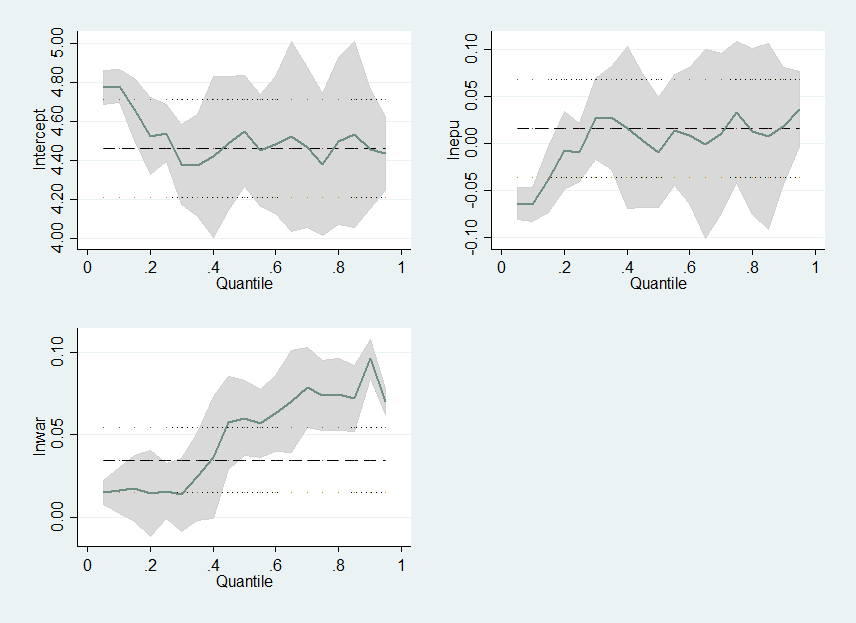
Figure 2 shows the plot of the quantile regression results for the impact of the Russia–Ukraine war on oil prices. The figure shows that the Russia–Ukraine war has a positive effect on oil prices across all the quantiles.

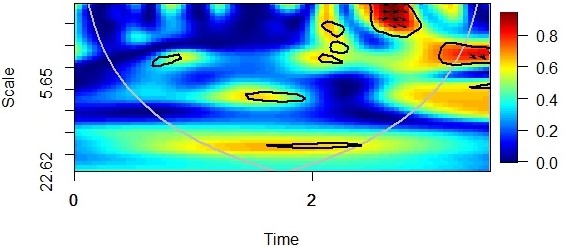
Figure 3 shows the wavelet coherence analysis for the Russia–Ukraine war and oil prices. The x-axis represents the time (months), while the y-axis represents the frequency. The grey line represents the cone of influence. The correlation coefficient is shown on the vertical line on the right. The dark-blue colour shows no evidence of correlation, while the dark-red colour shows evidence of strong correlation. The dark yellow and green colours show evidence of moderate correlation. The thick red contour shows the 5% level of statistical significance. The right-down arrows also show co-movement from the Russia–Ukraine war to oil prices. The estimates show that in the long run, the Russia–Ukraine war causes oil prices.

IV. Conclusion
Oil is very important to a country’s economic development. Therefore, policymakers, investors, and researchers continue to be concerned about the factors that influence oil prices. This paper added to the body of knowledge on the determinants of oil prices by offering the first empirical examination of the influence of the ongoing Russia–Ukraine war on US oil prices. The study used the quantile regression and the wavelet coherence analysis to estimate the impact of the war on oil prices.
The results showed that the Russia–Ukraine war raised US oil prices, with the effect being very obvious in the middle and upper quantiles. The study also revealed one-way causal flow from the Russia–Ukraine war to oil prices in the long run.
Due to data scarcity, this study focused solely on the US. Future research should consider other countries to corroborate our findings. In addition, future research should employ panel data to investigate the influence of the Russia–Ukraine war on oil prices before and after the invasion. This study also employed the quantile regression approach, which failed to capture the threshold value beyond which the Russia–Ukraine war reduced oil prices. In turn, future research should use the threshold model to estimate the threshold value beyond which the Russia–Ukraine war reduced oil prices.
Acknowledgment
We thank the Editor and two anonymous reviewers for their constructive comments and suggestions, which helped improve the quality and readability of this manuscript.
See Torrence and Compo (1998) for the mathematical expression of the wavelet coherence framework.