I. Introduction
An increasing trend among energy economists and social science researchers is the use of web surveys to obtain perception, acceptance, and preferences for energy (Arning et al., 2021; Cousse, 2021; Ladenburg et al., 2020), to mention a few. However, a disadvantage of web surveys is the lack of control over the respondent’s setting with the questionnaire, such as screen size, thus risking visual elements being presented to respondents in differing forms.
The mental perception of sizes is complex and involves many different cues, such as contrast, resolution, visual angle, depth information, foreground texture, and familiarity (Meehan & Triggs, 1992; Predebon, 1992; Roscoc, 1993). Consequently, the perception of the contents of a picture correlates with screen size (Reeves et al., 1999). The current understanding of the impact of screen size on visibility and its impact on perception and wind power preferences are minimal. Previous wind power visualisation research has focused on the type of visualisation techniques (von Haaren & Warren-Kretzschmar, 2006), the accuracy of visualisations using different camera lens focal length (Takacs & Goulden, 2019) and the type of visualisations (Hevia-Koch & Ladenburg, 2019).
Studies testing the effect of screen size on viewers’ visual perceptions were initially done in television research. Hatada et al. (1980) found that increasing the visual angle [through large image sizes or nearer viewing distances] increased the feeling of realism. Reeves et al. (1999) found that participants paid more attention to the messages presented on large screens (55") than to messages presented on small (2") or medium-sized (12") screens. Detenber & Reeves (1996) argue that the best summary of past research is that “larger image sizes indeed can intensify viewers’ evaluation of content” [pp. 70, line 5-6]. Presenting the same image to respondents using different screen sizes might affect their perception of the image.
Evidently, this phenomenon is highly relevant when considering the use of visualisations in online wind power surveys as indicated in many studies and as addressed explicitly by Lutzeyer et al. (2018), page 624: “To control the visual cues that respondents received, the survey was professionally printed on high-quality paper. An internet survey was ruled out because wind turbines are small features in a photographic context, and the visual impact varies dramatically across computers, depending on the monitor size, type, and quality, as well as the viewing angle. Instead, each choice question was presented on an 8.5 by 11 in.(letter size) page”.
To the authors’ knowledge, the effect of screen size on individuals’ perceptions on wind turbine visualisations remains untested. To shed light on this subject, we use data from 2,359 respondents, who are presented with different visualisations of onshore and offshore windfarms and examine the correlation between screen size and the visibility of the visualised turbines.
II. Material and methods
A. Survey development and data collection
The data is from a Discrete Choice Experiment (DCE) (Adamowicz et al., 1994) survey with visualisations of onshore and offshore wind farms. As part of the DCE, the respondents were asked to assess the visualised wind turbine visibility. This paper focuses on the relation between screen size and the visibility of the visualised turbines.
The survey sample is drawn from an internet panel considering quota sampling based on the Danish national population according to geography, gender, and education level. In December 2011, a pre-test of the questionnaire was carried out and developed using focus groups. The survey was conducted as a web survey between December 2011 and January 2012. The respondents were e-mailed a link to the survey page where they were presented with the questions in order. We only have access to the response rate from the pilot study, which was 8.6%. However, considering that the actual study (after the pilot) contained reminders, and based on experience with similar pilot studies and surveys (Göritz & Crutzen, 2021), we would expect the actual response rate to be above 15%. However, we do not expect that selection into the survey influenced the potential impact of screen size on the visibility of the turbines in the visualisations and preferences. In total, 2,359 respondents answered the questionnaire.
B. Screen Size
To make answering the survey relatively easy for the respondents, they were provided with three screen size classifications: larger than an A4 paper (8-1/4 x 11-3/4 inches),[1] the same size as an A4 paper, and smaller than an A4 paper. In hindsight, it would also have been relevant to ask about the type of device–computer versus mobile device. Accordingly, we cannot make continuous screen size correlation estimates when comparing our screen size data with Liebe et al. (2015). Furthermore, and as we will come back to, it would benefit the analysis if we had specifically sampled more respondents with a small screen size.
C. Visualisation
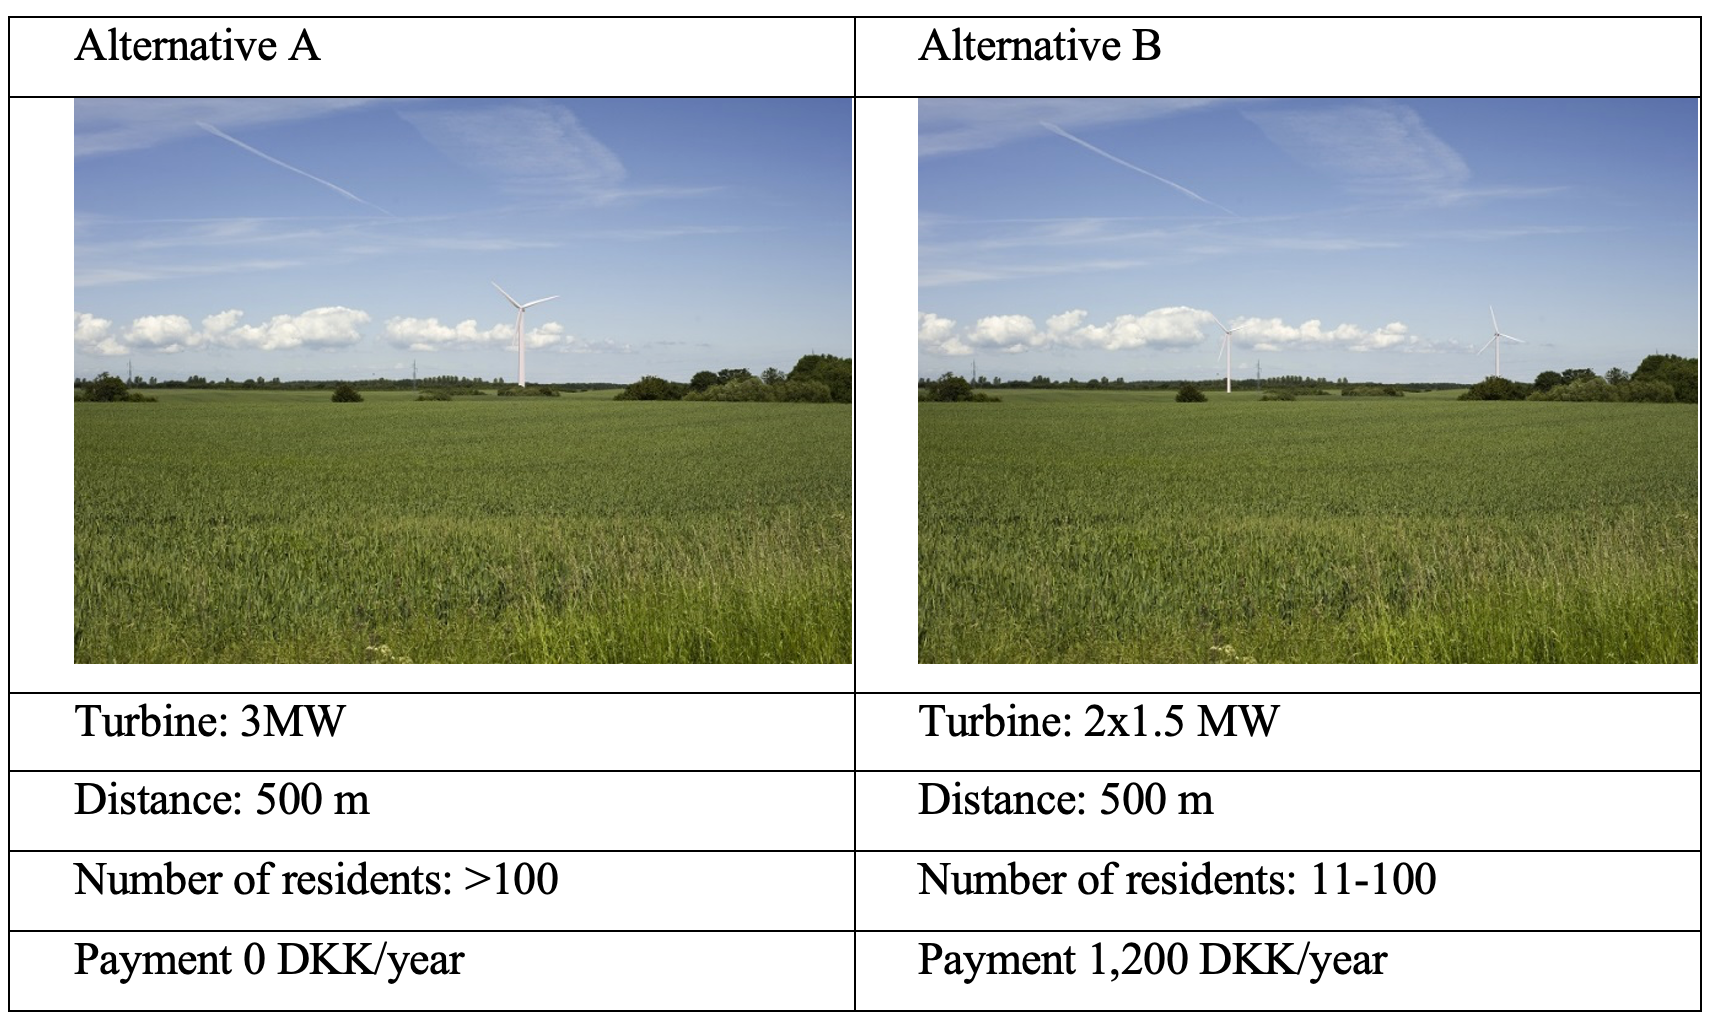
In the DCE, each respondent was presented with eight pairwise generic visualisations (Hevia-Koch & Ladenburg, 2019). The wind turbines in the visualisations varied regarding the distance of the viewpoint and size of the turbines.[2] A wind turbine visualisation company created the computer-based visualisations. In total, 72 visualisations were divided into nine visualisation blocks. An example of the visualisations is shown in Figure 1.

III. Econometric analysis
In the survey, the respondents were asked if the visualised wind turbines were always visible. The respondents could state “Yes”/“No”/“Don’t Know”. Though this question gives us the relevant information about the visibility of the turbines, more pertinent and specific developed questions could have been applied to test for screen size effects.
A Linear Probability Model (LPM) is applied to estimate the marginal correlation between screen size and the visibility of the visualised wind turbines. The OLS parameter estimates may be interpreted as having approximate marginal effects (Angrist & Pischke, 2008; Wooldridge, 2010). We report heteroscedasticity-robust standard errors. In the models, the respondents’ answer to turbine visibility is the dependent variable and the respondents’ screen sizes (Medium Screen, size of an A4 sheet), (Small Screen, smaller than an A4 sheet) and a vector of control variables are the independent variables in the model:
Yi=β1⋅SSi+β2⋅MSi+Β⋅Xi+ϵi
where denotes the individual respondent, and is an error term that has normal distribution.
We hypothesise that respondents with smaller screen sizes will have a higher probability of answering “No” and vice versa. This would be reflected in the model by having significantly different positive values for and
IV. Results
Before we present the results related to the screen size correlation estimates, the characteristics of the sample, particularly across the samples related to the different screen sizes, are presented.
A. Sample characteristics and screen size
The respondents’ socio-demographic characteristics, knowledge of local wind turbine development, if they have onshore wind turbines in the viewshed from their residence, and the number of minutes they spent answering the survey are in Table 1. The table is divided into the overall sample means and the means for each screen size sample. We also point out if the screen size sample mean is significantly different from the other sample means for each screen size sample. The differences in the samples presented in Table 2 are estimated using multinomial models. The results related to the multinomial logit models are in Appendix A.
There are significant differences between the samples, regarding gender, age, education, income level and the time spent completing the survey. Furthermore, there are significant differences in the visualisations given to the respondents across screen size. The visualisation block distribution is not significantly different between screen sizes. However, the visibility of the wind turbines by design (distance, height and number of turbines) differs slightly across the visualisation blocks given to the respondents. We therefore control for which visualisation block each respondent is given. This ensures that potential screen size correlation estimates are not confounded with the given visualisations to the respondent.
B. Wind turbine visibility and screen size
In Table 2, we estimate and present two LPMs with the “Yes” category as the baseline . In the first model, the dependent variable is equal to one if the respondent answers “No” and zero if the respondent answers “Yes”. In the second model, the dependent variable is equal to one if the respondent answers “Don’t know” and zero if the respondent answers “Yes”. A large screen is the reference group for screen size in the model.
In the LPM, the respondents with a small screen size have a 15.6% higher probability of answering “No”, compared to respondents with a large screen. The respondents with a medium screen size have a 6.3% higher probability of answering “No”, when compared to respondents with a large screen size. The difference between the respondents with a small or medium screen size is significant on a 95 percent confidence level.
The results strongly denote that wind turbine visibility is positively correlated with screen size and vice versa.
V. Discussion
An explicit limitation of our study is that we did not have information on the actual screen size, as in Liebet et al. (2015). Further investigation should address this limitation. Another explicit limitation is the relatively few small screen size observations. However, the small and medium screen (larger sample) size correlation estimates are distinct. The results should merit some consideration in planning future studies using visualisations to facilitate environmental quality degradations. One thing to consider is whether it would be possible to allow only people using larger screens to answer the survey. However, a potential caveat of that approach could be screen size-induced selection bias in the survey. A potential solution, though perhaps unrealistic, would be to ask people to hold on with completing the survey until they have a laptop, tablet or similar large screen device on hand. Another way around the problem could be mailing (postal) the visualisations to the respondents as in Lutzeyer et al. (2018). However, this would clearly make the survey more costly.
Our results should also be seen in the light of how visualisations are used in the energy research social science field. In some studies, the visualisations are used to elicit the WTP for different wind farm configurations, see Hevia-Koch & Ladenburg (2019) for a review. (Lothian, 2008).
VI. Conclusions
This study examines the correlation between screen size and turbine visibility in visualisations based on the assessment of 2,359 respondents in a wind power survey. Respondents with smaller screen sizes found the visualised wind turbines harder to see when compared to respondents with medium and large screen sizes. The marginal difference in probability is 16% points. Likewise, respondents with medium screen sizes found the turbines harder to see, when compared to the respondent with large screen sizes. The estimated marginal difference is 6% points. The results denote that screen size is an essential factor to count for when asking people to judge the visual impacts of wind turbines using web-based visualisations.
Acknowledgements
The authors would like to thank the participants of Concurrent Session 1 of the 2015 Danish Environmental Economic Conference [August 28th] for their valuable feedback. Any remaining mistakes are the sole responsibility of the authors. The authors state that there exists no conflict of interest. This work was funded by project 1305-00021B under the Danish Council for Strategic Research (current Innovation Fund).