
I. Introduction
Scholars have long argued about cryptocurrency’s sustainable, environmental, and economic attributes (Karim et al., 2022). Volatility spillovers from the cryptocurrency market to green financial assets are increasingly prevalent in recent studies (Kamal & Hassan, 2022; Naeem & Karim, 2021). For instance, there is evidence of volatility spillovers from EPU (Haq et al., 2021) and VIX (Kamal & Hassan, 2022; Le et al., 2021) to green financial assets. However, the Cryptocurrency Environmental Attention Index (ICEA) captures cryptocurrency environmental attention (Karim et al., 2022) and hence it is pivotal to consider how cryptocurrency environmental uncertainty spillovers to the green financial assets to complement prior studies on spillovers from Bitcoin mining (Naeem & Karim, 2021) and crypto-specific uncertainty measures (Hasan et al., 2021; Hassan et al., 2021; Wang et al., 2022) to green financial assets. In addition, the health crisis caused by COVID-19[1] has increased the prospect of volatility transmission (Karim & Naeem, 2021). Therefore, COVID-19 may diminish hedging opportunities in financial markets.
This study draws inferences from the volatility spillover of cryptocurrency environmental attention to green financial assets using the time-varying parameter vector autoregression (TVP-VAR) approach during COVID-19 and the full sample periods. The green financial assets are the S&P global clean energy index, S&P green bonds index, Dow Jones sustainability world index, and Dow Jones Sustainability Australia Index.
Undoubtedly, the cryptocurrency market has become an attractive avenue for diversification and hedging (Hasan et al., 2021). Cryptocurrency mining has become a negative predictor of the environment (Krause & Tolaymat, 2018). Despite the financial development, blockchain and cryptocurrency mining foster air pollution, high-energy consumption, climate change, and Carbon dioxide pollution issues (Wang et al., 2022). Hence, the motivations of the study are as follows. First, cryptocurrencies are dirty currencies, which influence the investment decisions of environmentalists and clean energy investors (Naeem & Karim, 2021). Second, cryptocurrency mining (Bitcoin mining in particular) requires huge electricity. Notably, the current energy consumption of Bitcoin is about 0.55% (110 TWh) of global electricity consumption per year according to the Cambridge Center of Alternative Finance (CCAF).[2] Therefore, it is crucial to study the information transmission from cryptocurrency environmental attention to green financial markets.
Earlier research lacks empirical evidence related to environmental concerns about cryptocurrency (Bariviera & Merediz-Solà, 2021; Naeem & Karim, 2021; Wang et al., 2022). Therefore, this study fills this research gap. Accordingly, the contributions of this study relate to three aspects of the literature: 1) the growing literature on COVID-19 induced attention on the environmental effects of cryptocurrency mining (Kamal & Hassan, 2022; Karim et al., 2022; Wang et al., 2022), 2) the volatility spillover from cryptocurrency environmental attention to green financial assets (Kamal & Hassan, 2022; Naeem & Karim, 2021) in terms of uncovering the impact on Australian and world sustainability, and 3) providing useful implications for policymakers and green investors during normal and higher uncertainty periods (such as the COVID-19 period) using Antonakakis and Gabauer’s (2017) TVP-VAR model.
II. Data and methods
A. Data and descriptive statistics
This study considered the closing prices of four green financial assets, namely the Dow Jones World Sustainability Index (DJWSI), Dow Jones Sustainability Australia Index (DJSAI), S&P Global Green Bonds (GB), and S&P Global Clean Energy Index (GCEI), and an attention measure, Index of Cryptocurrency Environmental Attention (ICEA). The ICEA is a news-based index constructed by Wang et al. (2022). Using weekly data for green financial assets according to ICEA, the data sample spans the period of January 3, 2014 to December 31, 2021. The sub-sample analysis covers observations from December 1, 2019 to December 31, 2021. Data on financial assets and cryptocurrency environmental attention are sourced from DataStream and brianmlucey.wordpress.com, respectively.
The first differenced log-returns are illustrated in Table 1. The most (least) volatile green financial asset is GCEI (GB). The distribution of log returns is high-peaked, asymmetric, and, thus, non-normal. All return series are stationary, thus ensuring stationarity.
B. TVP-VAR Model
To investigate the dynamic connectedness between cryptocurrency environmental attention and green financial assets, author employed Antonakakis and Gabauer’s (2017) TVP-VAR model. This empirical model was introduced by Primiceri (2005) and extended by Antonakakis and Gabauer (2017). It has several benefits over other methodologies. These include: 1) its ability to capture system-wide net connectedness among indices, 2) its specifying of the dynamic potential impact of financial contagion and volatility spillovers on the overall system of the markets over time, and 3) its ability to identify the potential structural breaks and relationships among time series. Overall, it validates whether the linear structure is derived from the probability of shocks (or response) from the extension of the change mechanism (Karim & Naeem, 2021).
The model equation is stated as follows:
yt=β0,t+β1,tYt−1+…+βp,tYt−p+ut+X′tΘt+ut
In Equation (1), indicates the vector of dependent variables, are dynamic coefficients over time, rewritten as matrix (Naeem & Karim, 2021).
X′t=[1,y′t−1,…,y′t−p]
is an matrix considering both intercept and lags of time-varying variables, where represents structural shocks and n×1 follows zero mean with the heteroskedastic distribution. The term indicates the time-varying variance-covariance matrix. Therefore, the variance-covariance matrix of ICEA and green financial assets differenced returns can be written as:
Ωt=M−1tHt(M−1t)
where and represent the simultaneous relationship between time series and stochastic connectedness, respectively.
The transition in dynamic parameters over time is assumed to be as follows:
Θt=Θt−1+vt,vt≈N(0,S)
αt=αt−1+ξt,ξt≈N(0,Q)
where the time-varying parameters are estimated through Equations (4) and (5) following the random walk process:
lnhit−1=ln hi,t−1+σtμi,t, μi,t≈N(0,1)
Equation (6) estimates the stochastic connectedness, using the random walk process (Kamal & Hassan, 2022). Overall, the error term is determined to be independent of the transition equation. Therefore, coefficients among variables vary independently to maintain efficient and simplified estimates (Karim & Naeem, 2021; Primiceri, 2005).
III. Empirical results
Table 2 reports the results of time-varying connectedness between ICEA and green financial assets for Panel A (full sample) and Panel B (during COVID-19) using the TVP-VAR model. In Panel A, the total system-wide connectedness is 28.29%, where ICEA is the net transmitter of volatility spillover to the other green financial assets. These findings partially corroborate Kamal and Hassan (2022), who documented that ICEA is a net transmitter (receiver) in lower quantiles (higher). The GCEI is the second volatility transmitter to the green financial assets and GB and DJSAI are the net volatility recipients, consistent with the work of Kamal and Hassan (2022), which found GCEI as a net transmitter of shocks in lower quantiles and GB as the net volatility recipient in both higher and lower quantiles. Notably, DJSWI and DJSAI are the net recipients of volatility spillovers.
The strong connectedness of DJSWI, DJSAI, and GCEI suggests their homogenous sustainable contribution to the environment and sustainable development goals (Ferrer et al., 2021). The weak connectedness of GB with other markets points to its strong diversification ability as a green financial asset (Haq et al., 2021).
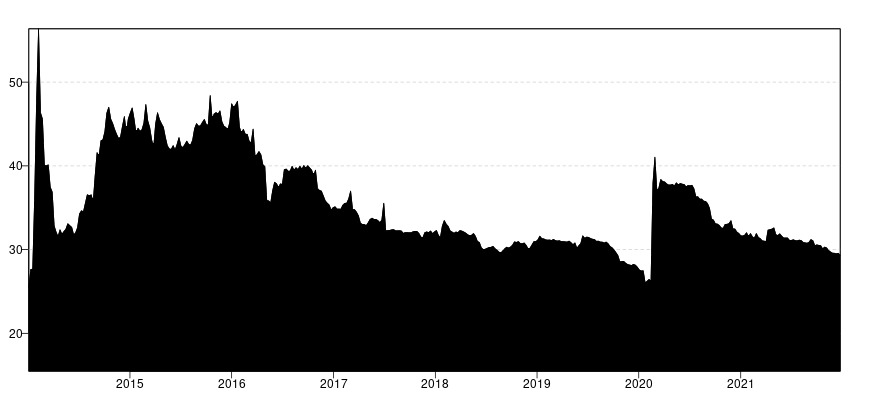
Panel B represents the COVID-19 results from the TVP-VAR model, whereby the strongest (weakest) net transmitter is GB (ICEA). These results suggest that GCEI is the second-highest shock transmitter to the sustainability world and the Australian index during the COVID-19 pandemic. These findings are consistent with previous work by Kamal and Hassan (2022), which found the ICEA to be a shock receiver during COVID-19. Notably, DJSAI is the strongest net receiver of volatility spillover during the pandemic. Findings reveal that the ICEA transmits shocks to the GCEI, which contradicts Kamal and Hassan (2022), who documented an opposite contagion effect during COVID-19. This may be due to the fewer number of observations Kamal and Hassan (2022) considered in their analysis (69 observations). The total connectedness index improved to 32.79% in the pandemic episode, indicating improved connectedness between ICEA and other green assets (Akhtaruzzaman et al., 2021; Kamal & Hassan, 2022). Figure 1 also verifies the fact. The lower connectedness suggests the hedging potential of green financial assets during the COVID-19 period.

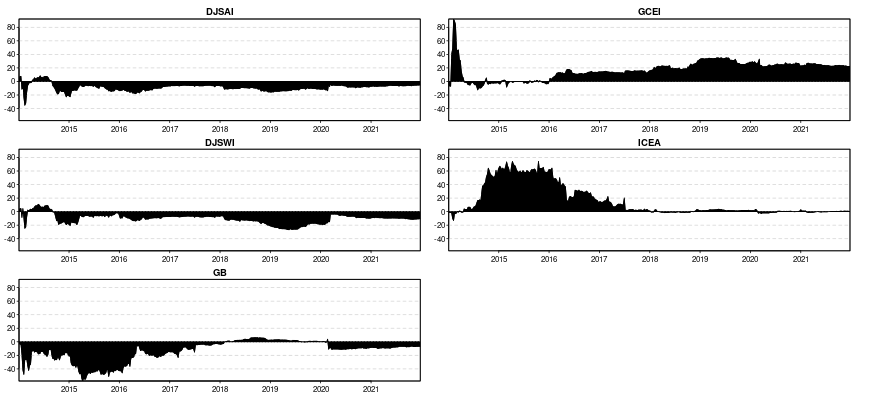
Figure 2 delineates ICEA as a net transmitter of volatility spillover from 2014 to 2018 and shock transmission lingered very low from 2018. Likewise, GCEI is a net transmitter of volatility spillover throughout the sample period, despite the last few weeks of 2014. The indices GB, DJSWI, and DJSAI are the net recipients of volatility spillovers from 2014 to 2021, except few positive connectedness movements. These findings confirm that the cryptocurrency environmental volatility transmission follows time-varying patterns for both transmitters and receivers and that investors can hedge ICEA considering GCIE in their portfolio with other assets.

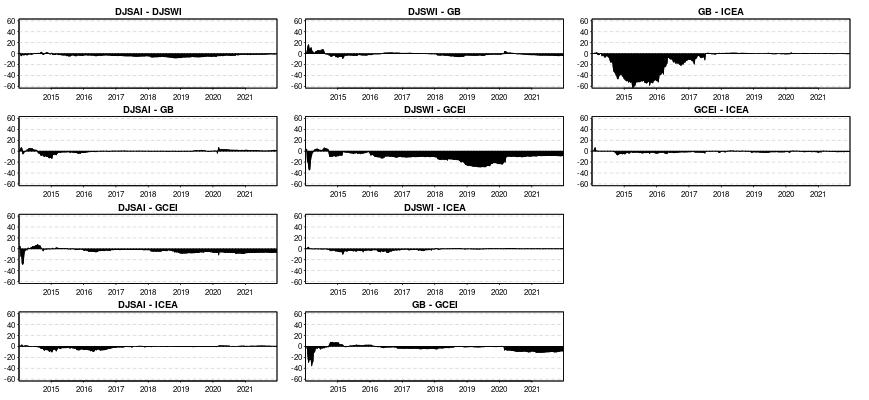
Figure 3 represents the pairwise dynamic connectedness of ICEA and four green financial assets. The volatility spillover of cryptocurrency environmental attention is higher (lower) than GB (GCEI). The lower spillover suggests GCEI can be used in a portfolio to hedge ICEA, which is in line with the earlier research (Kamal & Hassan, 2022; Karim & Naeem, 2021). Therefore, these findings lend support to the growing belief that cryptocurrencies are dirty currencies (Naeem & Karim, 2021). Therefore, environmentalists and policymakers should take countermeasures to promote lower cryptocurrency energy consumption and carbon footprint.
Above findings are crucial for policymakers and sustainable investors, both international and Australian, in terms of investing in green financial assets in a portfolio and tackling the volatility transmission from the cryptocurrency market to green financial assets. Meanwhile, investors need to take heterogeneous and rational investment decisions during the COVID-19 pandemic.
IV. Conclusion
This study investigates the dynamic connectedness between cryptocurrency environmental attention index and four green financial assets, using the TVP-VAR model. Empirical analysis covers the COVID-19 pandemic period and reveals volatility spillover transmitted from ICEA to green financial assets. The ICEA and GCEI are the main net volatility spillover transmitters over entire sample period, whereas GB is a net volatility transmitter during the COVID-19. Conversely, GCEI, GB, DJSWI, and DJSAI are the net recipients of ICEA spillover over entire sample period, whereas only GCEI and GB are the recipients of ICEA shocks during the COVID-19 pandemic. Notably, DJSAI is the highest receiver of spillover from GB and GCEI. The TVP-VAR results confirm the financial contagion effect on systemwide connectedness, with higher connectedness during the pandemic. Furthermore, pairwise connectedness between ICEA and green financial assets shows the minimal hedging and diversification potential to hedge ICEA.
Investors have heterogenous investment options (short-term and long-term) and the TVP-VAR approach cannot model the dependence over multiple frequencies. Therefore, it suggest that future studies consider sustainable cryptocurrencies in portfolios of green financial assets to examine various aspects of connectedness and hedging ICEA using wavelet models over multiple investment horizons.
Acknowledgment
I thank the anonymous reviewers and the Editor for their constructive comments and suggestions, which substantially enhanced the quality of the paper.
See Akhtaruzzaman, Boubaker, and Sensoy (2021) for more descriptions of COVID-19.