I. Introduction
Rooftop photovoltaic (PV) systems have the potential to contribute significantly to the worldwide transition toward renewable energy. Research has identified various determinants that drive the diffusion and adoption of residential PV systems (Schulte et al., 2022). Previous adoption studies, however, often under-appreciate the importance of social interactions with other actors or, rather, stakeholders (Axsen & Kurani, 2012; Geels et al., 2018), since these studies assess the decision making process of individuals in isolation from their social environment. Hereinafter, the term stakeholder refers to any tangible actor, that is, institution, organization, or group of individuals that in some way influences a household’s PV adoption process, whether directly or indirectly, as defined by Curtis et al. (2018) and Scheller et al. (2020). Innovation diffusion is not a process of decontextualized individual choice; rather, it is a social process in which subjective evaluations of the innovation disseminate from earlier to later adopters (Valente & Rogers, 1995). As Rogers (2004) has stressed, the relations between sender and receiver determine what information is disseminated and how it is interpreted, affecting individual decision making.
Accordingly, a better understanding of individual PV adoption decisions requires a better understanding of PV stakeholder interactions and influence. Drawing on social psychology literature, social influence is defined in this paper as a change in the behavior of a decision maker that results from the action of another stakeholder (Raven, 2008). Since stakeholders’ involvement in different decision making stages can vary, the term stakeholder dynamics describes the context- and time-dependent roles and degrees of social influence of stakeholders along the PV adoption process (Scheller et al., 2021).
Recent studies have shed light on the role of stakeholder dynamics in PV diffusion. Mundaca and Samahita (2020) demonstrated that hearing about PV from a personally familiar source significantly improves the likelihood of its adoption. Likewise, Scheller et al. (2021) showed that stakeholders who are emotionally distant from decision makers exerted less influence on their decisions, suggesting that social influences are partly determined by the strength of established relationships. Wolske et al. (2020) furthermore proposed that the quality of interactions between stakeholders and decision makers is crucial. While information tends to spread quickly among individuals with close relationships, communications might be particularly effective when they come from stakeholders who are perceived as trustworthy and credible. Additionally, several studies have indicated that stakeholders’ degrees of influence are dynamic across different stages of the decision making process (Arts et al., 2011; Scheller et al., 2021).
This paper explores whether there is a varying association between the attributes ascribed by decision makers to influencing stakeholders and the strength of the influence of those stakeholders on decision makers throughout different stages in the residential PV decision making process. This study is based upon a survey conducted with residential PV decision makers in Germany. The survey questionnaire focused on decision makers’ interactions with stakeholders on the topic of PV, their perceptions of various stakeholder groups’ attributes, and their assessments of these stakeholder groups’ influence on the PV decision making process.
II. Methodology
Data on PV stakeholder dynamics in Germany were collected using an online survey conducted in December 2019. The sample consisted of 1,165 completed questionnaires. To ensure relevance, all the respondents needed to indicate an awareness of PV technology, own their house, and have decision making power over their rooftop. Respondents who met these criteria were asked if they had already acquired a PV system (current adopters) or were interested in doing so (potential adopters). Potential adopters were asked to indicate their perceived stage in the adoption decision making process – stage I, II, or III – using a slider matched to a graphic showing the following stages.
- Stage I, awareness: I am aware of the existence of residential PV systems.
- Stage II, interest: I find residential PV systems interesting and I want to know more about them.
- Stage III, planning: I plan to install a residential PV system in my home.
- Stage IV, implementation stage: I have signed a contract for a residential PV system.
Current adopters were automatically assigned to stage IV. Respondents who did not assign themselves to at least the decision making stage II were excluded; this decision was based on preliminary qualitative research, which demonstrated that decision makers actively involved with the technology were more confident in their assessments of stakeholders (Scheller et al., 2021). The respondents were distributed between the decision making stages, with n = 602 in stage II, n = 169 in stage III, and n = 394 in stage IV. Among current adopters, n = 159 reported adopting PV at the time they purchased their house, while n = 235 reported PV adoption independent of their house purchase; only the latter were included in the analysis.
During the different stages of the decision making process, residential PV decision makers encounter multiple stakeholders. To gain insight into how stakeholders are perceived, the survey respondents were asked to rate 14 stakeholder groups along nine attributes (with a linear sliding scale from 1, indicating that the selected attribute does not apply at all, to 10, indicating the selected attribute applies completely).
The stakeholder groups were as follows:
- Family and relatives
- Friends
- Acquaintances and colleagues
- Neighbors
- Other private persons with an interest in PV
- Local energy utilities
- State- and country-level energy utilities
- Local governments and administrations
- Private organizations and societies
- Financial institutions
- Contractors, architects, and technical providers
- Energy consultants
- PV producers and providers
- Reporters and the media
The nine attributes were as follows:
- Trustworthiness—stakeholders offer honest and transparent statements and information about PV systems.
- Competence—stakeholders are very competent concerning PV systems.
- Power—stakeholders have the power to stand in the way of my decisions regarding PV systems.
- Independence—stakeholders would not profit from my decision to acquire a PV system.
- Availability—stakeholders are always available for discussion or to provide information on PV systems.
- Closeness—stakeholders are located near my place of residence and home.
- Likeability—I find the stakeholders likeable.
- Integrity—stakeholders behave in the way that I would generally expect.
- Reliability—stakeholders keep their promises and honor contracts.
The respondents were then asked to assess stakeholder interactions during each stage of the adoption process that they had completed. In each relevant stage, the respondents first indicated with which of the 14 groups above they had interacted. They then reported the perceived strength of influence for each of these interactions (with a linear sliding scale from 1, where the selected stakeholder had very weak influence in the respective decision making stage, to 10, where the selected stakeholder had a very strong influence in the respective decision making stage). Linear scales were chosen instead of Likert scales to enable linear regression analyses.
A linear regression model was used to determine the impact of the nine perceived attribute ratings for each stakeholder group of the reported influence strength of each stated interaction within each decision making stage
Infls=β0,s+9∑a=1βa,sAttra,s+εs
The estimated coefficients allow for an estimate of the extent to which a change in a perceived attribute level affects the strength of influence across all stakeholder groups in each decision making stage (marginal effect). In the original survey, the respondents were asked to report their interactions with up to 14 stakeholder groups per stage. Since we are interested in the association between perceived stakeholder attributes and indicated influence strengths, we analyze the interactions independent of the specific stakeholder groups by defining an observation as the interaction between the residential decision maker and the stakeholder group, without going into detail on possible differences between stakeholders. While the stakeholder groups were used as a practical means of making it easier for the respondents to answer questions about interactions and influences, we directly relate the ascribed attribute ratings of the stakeholder groups to the indicated influence strengths. For our research objective, the stakeholder groups themselves were not decisive, but the attributes perceived of them were, since the decision makers, or, rather, the respondents, might see the stakeholders in different ways. This seems plausible, since one respondent described a neighbor as a highly competent source with respect to PV, while another respondent ascribed the same attribute to an energy consultant.
For the linear regressions, we used ordinary least squares, minimizing the sum of squared error distances. In line with the literature, observations with studentized residuals with a modulus greater than two were treated as unusual observations and iteratively removed (e.g., Field, 2013; O’Halloran, 2005). This approach halved the number of observations to those where the relation appears linear. We justify this procedure by noting that the assessment of the attributes and influences in numerical form might have created difficulty for the respondents. Nevertheless, the share of useful observations seems ample enough to provide meaningful insights against the explorative background of the survey. Multicollinearity between the independent variables was checked using variance inflation factors (VIFs), which were found to be less than three. According to the literature, a VIF above five indicates multicollinearity.
III. Results
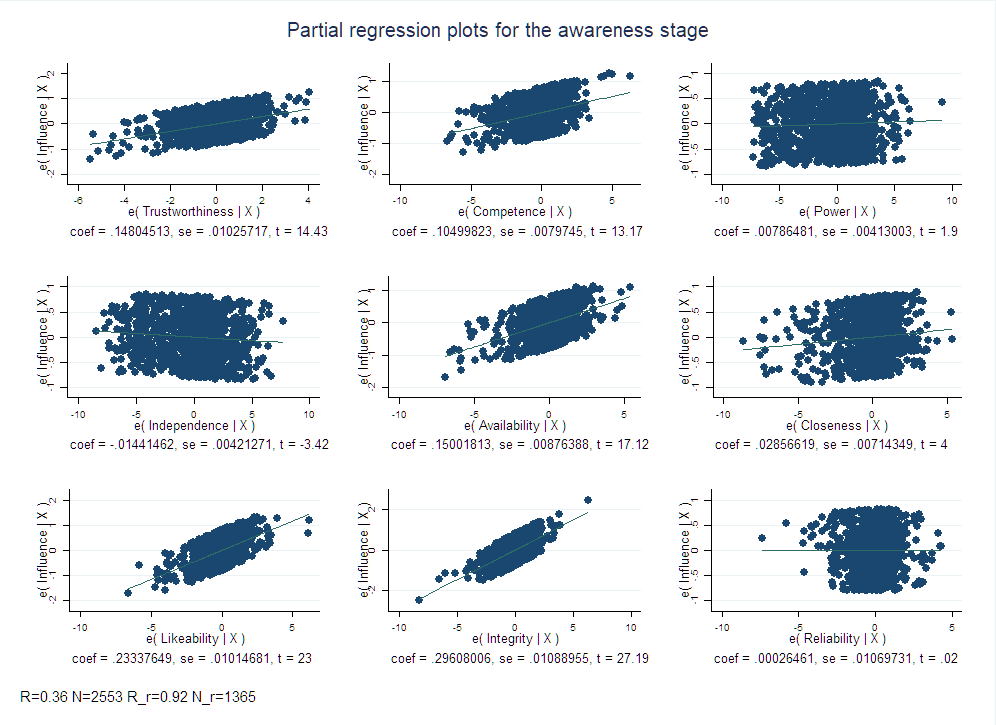
Table 1 summarizes the derived association of perceived attributes on influence strength. After a large number of unusual observations were removed, the results demonstrated that perceived attributes could largely explain influence strength across all stakeholders (with R2 values from 92% to 95% throughout the stages). While the link test revealed no problems with our specification, the distribution of the residuals is slightly platykurtic compared to the normal distribution. Even though the three decision making stages had a similar average influence rating, the mean strength of influence across all stakeholders was reported to be highest for the last decision making stage (stage I, M = 8.075, SD = 1.460; stage II, M = 7.973, SD = 1.520; stage III, M = 8.169, SD = 1.368). Furthermore, the mean ratings of the attributes are as follows: for trustworthiness, M = 7.721 and SD = 1.814; for competence, M = 7.290 and SD = 2.053; for power, M = 5.606 and SD = 2.998; for independence, M = 6.537 and SD = 3.035; for availability, M = 7.524 and SD = 2.030; for closeness, M = 7.466 and SD = 2.193; for likeability, M = 7.692 and SD = 2.003; for integrity, M = 7.881 and SD = 1.793; and for reliability, M = 7.851 and SD = 1.778.
During the decision making process, different combinations of key variables emerged, as Table 1 makes clear:
- In stage I, integrity and likeability were the most influential attributes. While attributes such as availability, trustworthiness, and competence also proved important, a better linear association of the first two attributes (i.e., integrity and likeability) was detected when analyzing the correlation ellipses of the partial regression plots, as shown in Figure 1. Reliability, power, closeness, and independence played a subordinate role.
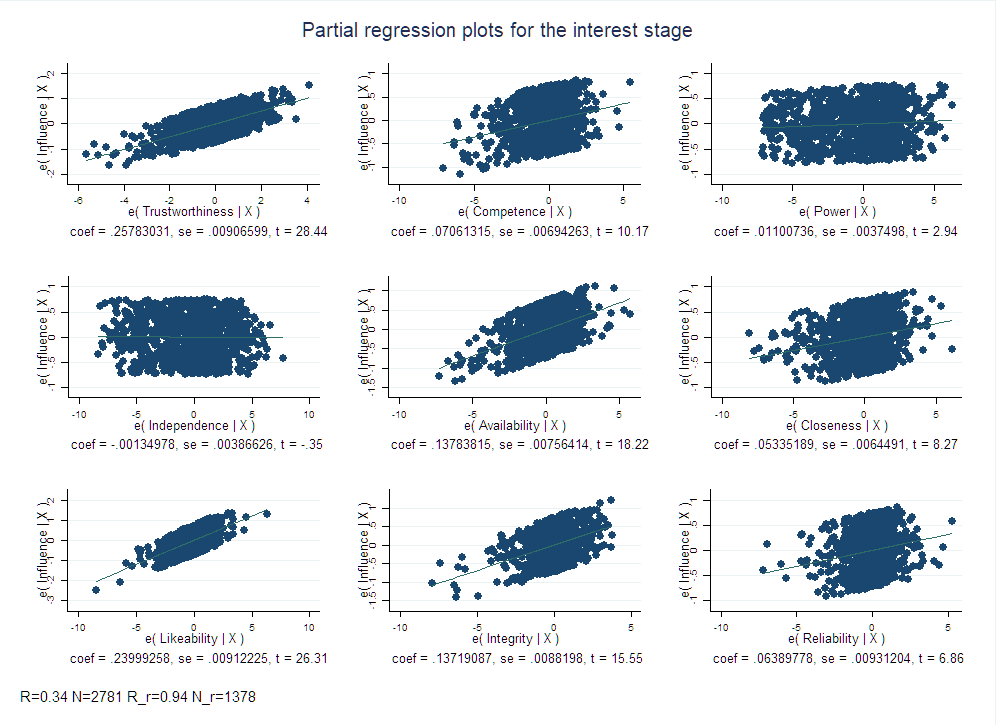
- In stage II, trustworthiness emerged as the most influential attribute; likeability mostly maintained its influence, but integrity decreased in influence.
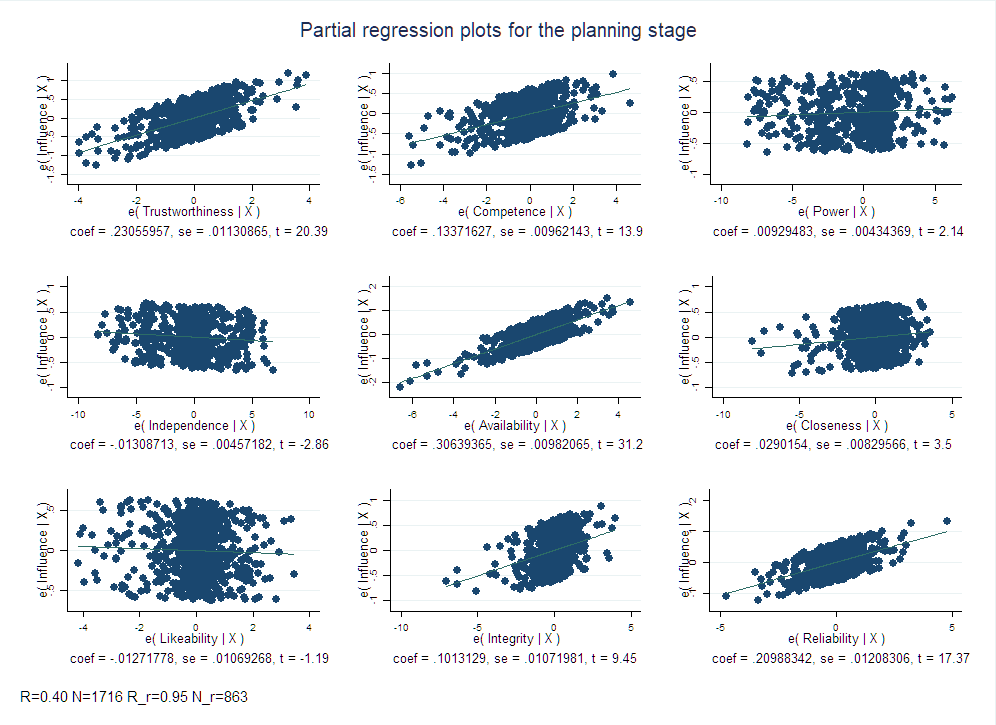
- In stage III, availability emerged as the most influential attribute, trustworthiness mostly maintained its influence, and reliability gained significantly in importance.

The attribute competence showed a significant influence throughout all stages, but the linear relation between the attribute level and influence strength is much more pronounced in stage III, as shown in Figure 3. The same is valid for the attribute availability. In contrast, a strong interrelation between the attribute level of likeability and influence strength is depicted in stages I and II (Figures 1 and 2), but this interrelation is quite chaotic in stage II (Figure 3). The varying importance of certain attributes in successive stages is plausible, since each stage involves different types of interactions and assessments. For example, the importance of likeability in stage I reflects the importance of this attribute in first impressions, whereas the importance of reliability in stage III reflects the fact that this is the stage during which PV system implementation is planned in concrete detail (e.g., timing and budgets).


IV. Conclusion
This study contributes to our understanding of stakeholder interactions in PV adoption by exploring the mix of beneficial attributes concerning PV that influential stakeholders possess and how the relative contributions of certain attributes of peer influence depend upon the decision maker’s stage in the decision making process. For instance, ascribed competence shows a strong association with influence strength in all three stages; integrity and likeability do so in stage; trustwortiness and likeability in stage II; and trustworthiness, availability, and reliability do so in stage III. A possible explanation for this could be that PV decision makers employ different evaluative criteria in successive stages of the decision making process. In this case, decision makers appeared to employ emotional criteria early in the decision making process and rational criteria later in the decision making process, as also found by Scheller et al. (2020) and Scheller et al. (2021).
Future research on stakeholder dynamics in the energy transition could build upon the present study by developing research designs that account for and mitigate respondent-induced bias: for example, faulty memory and social desirability bias. While this is a fundamental limitation in nearly all empirical social research, it can be particularly problematic when the variables under investigation are subjective, as in the case of perceived attributes and influence strength. To establish a more systematic and reliable understanding, future research should verify the elicited subjective accounts of stakeholder dynamics using a variety of methods. One promising possibility could be behavioral experimentation.
Acknowledgment
This study was financed by the Saxony State Government out of the state budget approved by the Saxony State Parliament within the framework of project SUSIC no. 100378087. Fabian Scheller also received funding from the European Union’s Horizon 2020 program under Marie Sklodowska-Curie grant agreement no. 713683 (COFUNDfellowsDTU).