I. INTRODUCTION
The price of crude oil has emerged as a highly influential variable in the global stock market. It has considerable significance for the macroeconomic performance of both oil-exporting and oil-importing countries. A lower oil price induces lower production costs and stabilizes inflation in oil-importing countries, whereas it has an adverse effect on the revenue of oil-exporting countries. There is a well-established negative correlation between oil prices and stock prices in general, while there is a positive relation between oil prices and clean energy stocks. However, this relation could differ due to the effects of substitution motives on investor reactions. There is also a strong and positive correlation between technology stocks and clean energy stocks. Higher technology stock returns are observed to induce positive sentiment for clean energy stocks,[1] which helps in clean energy production. However, such relations can differ during extreme market conditions, such as the COVID-19 pandemic, since it has caused significant disturbances in the global supply chain, widespread lockdowns, and reduction in aggregate demand. There has been a global stock market meltdown and a sharp reduction in oil prices. The pandemic has also significantly disrupted clean energy investment and slowed the speed of technological innovation in advancing clean energy use. Firms can meet the regulatory limit of environmental pollution as they reduce production, while they have favorable incentives and an excellent opportunity to make eco-friendly changes. Hence, it is seen that technological and clean energy stocks could provide an opportunity for portfolio diversification. The role of clean energy stocks in an optimal portfolio is contingent on the dynamic connectedness with other closely linked stocks.
Earlier studies contend that the impact of oil price volatility on clean energy stocks could differ with substitution motives and investor sentiment regarding future expectations (e.g., Kumar et al., 2012). While technological development thus plays a crucial role in clean energy, research examining the price of crude oil and clean energy stocks also includes the stocks of advanced technology firms. The empirical literature finds strong causal links and volatility spillovers between clean energy stocks, oil prices, and technology stocks (Inchauspe et al., 2015; Managi & Okimoto, 2013; Reboredo, 2015).
The hedging capacity of clean energy stocks has been examined by considering their dynamic conditional correlation (DCC) with technology stocks and oil prices (Ahmad, 2017; Sadorsky, 2012). Studies have shown that the time-varying connections between crude oil and stock markets depend on the nature of financial shocks (Zhang, 2017). However, studies present mixed results on the impact of oil prices on aggregate stock markets. The reasons behind the mixed results differ, depending on the characteristics of the firms in the stock markets in terms of oil dependence (Smyth & Narayan, 2018).
During periods of financial and economic crisis, the behavior of investor sentiment changes. The uncertainty due to COVID-19 has caused enormous volatility in the clean energy market. The behavior of COVID-19 uncertainty on the clean energy stock volatility is of considerable interest to policymakers, and it can help design better policy to promote clean energy investment. Empirical studies suggest a significant relation between economic uncertainty and clean energy investment (Liu et al., 2021). Different indicators of economic uncertainty are used in the literature. A news-based index has emerged to capture market sentiment. The uncertainty caused by COVID-19 is different, since it is external to the market. Therefore, a pandemic-induced uncertainty index has been developed. Recently, Narayan et al. (2021) have developed a news-based measure of COVID-19 uncertainty that captures sentiment from newspaper articles globally. It also captures different dimensions of the COVID-19 pandemic through six indexes: the COVID index, a medical index, a vaccine index, a travel index, an uncertainty index, and an aggregate COVID-19 sentiment index.
During the COVID-19 pandemic, widespread fluctuations have been observed in the market. Studies have examined the oil–stock market nexus, but only a few have examined the effect of the COVID‑19 outbreak on the clean energy market (Eroğlu, 2021; Liu et al., 2021). There is a gap in the literature examining the dynamic connectedness between crude oil, clean energy stocks, technology stocks, and COVID-19 sentiment during the peak and post-peak COVID-19 periods. This paper applies a new dataset for the news-based COVID-19 uncertainty index developed by Narayan et al. (2021). It provides fresh insights into the hedging potential of clean energy stocks during the COVID-19 pandemic. It documents the degree of connectedness between these stocks and tests whether a positive co-movement exists between the clean energy and oil markets during COVID-19.
II. DATA AND METHODOLOGY
Daily data are obtained for the period from January 2, 2020, to November 8, 2020. This period is based on the availability of COVID-19 aggregate index (COVI) data of Narayan et al. (2021).[2] Oil price data are proxied by West Texas Intermediate spot prices (WTI), obtained from the US Energy Information Administration. Data on the WilderHill Clean Energy Index (ECO) and the NYSE Arca Technology Index (PSE) are obtained from Yahoo! Finance. For the empirical analysis, all series are converted into logarithmic returns, except for the COVI variable.
We then implement the DCC generalized autoregressive conditional heteroskedasticity (GARCH) model proposed by Engle (2002) to calculate time-varying correlations. The M-dimensional multivariate GARCH(1, 1) model is given as follows:
yt= δ0+ δ1yt−1+ εt, εt ∼ (0, Ht)
Ht=πt∖Rtπt
π1=diag {√h11,t,√h22,t, . . . , √hMM,t}
h11,t=wi+ β1hii,t−1+γiε2i,t−1, i=1, 2,.. ., M
Rt=(diag{Qt})−1/2 Qt(diag{Qt})−1/2
Qt=(1−α−β)¯Q+ αut−1u′t−1+βQt−1
where and are M × 1 vectors, is a conditional covariance matrix of the random vector is a vector with standardized values of is the matrix of correlations varying over time, is a positive definite and symmetric matrix, is the unconditional variance matrix of and are scalers, with and for the positive definiteness of the conditional correlation matrix. The time-varying component of the DCC, is defined as
ρij,t= qij,t√qii,t,qjj,t
where is the (i – j)th element of
III. EMPIRICAL FINDINGS
Table 1 reports the descriptive statistics of all the variables. The variable COVI has the highest standard deviation, since it is a nonlogarithmic index, followed by oil returns (R_OIL). Technology stocks have the least variation. All series have excess kurtosis, which means a fattier tail than for the normal distribution, which is a regular phenomenon in financial time series.
Table 2 shows the month-wise DCCs between different pairs of variables.[3] Except in February, there is a strong positive co-movement between clean energy stocks and oil prices since July, while the co-movement between oil and technology stock is relatively weak but positive. There is a strong positive correlation between technology and clean energy stocks. The correlation between oil prices and COVI is strong during April, May, and June, while it is negative in April, which means a higher COVI value is associated with lower oil prices. However, during May and June, this correlation is positive. Afterward, the correlation is strong and almost positive, meaning that both oil prices and COVI move in the same direction. There is thus less scope for portfolio diversification.
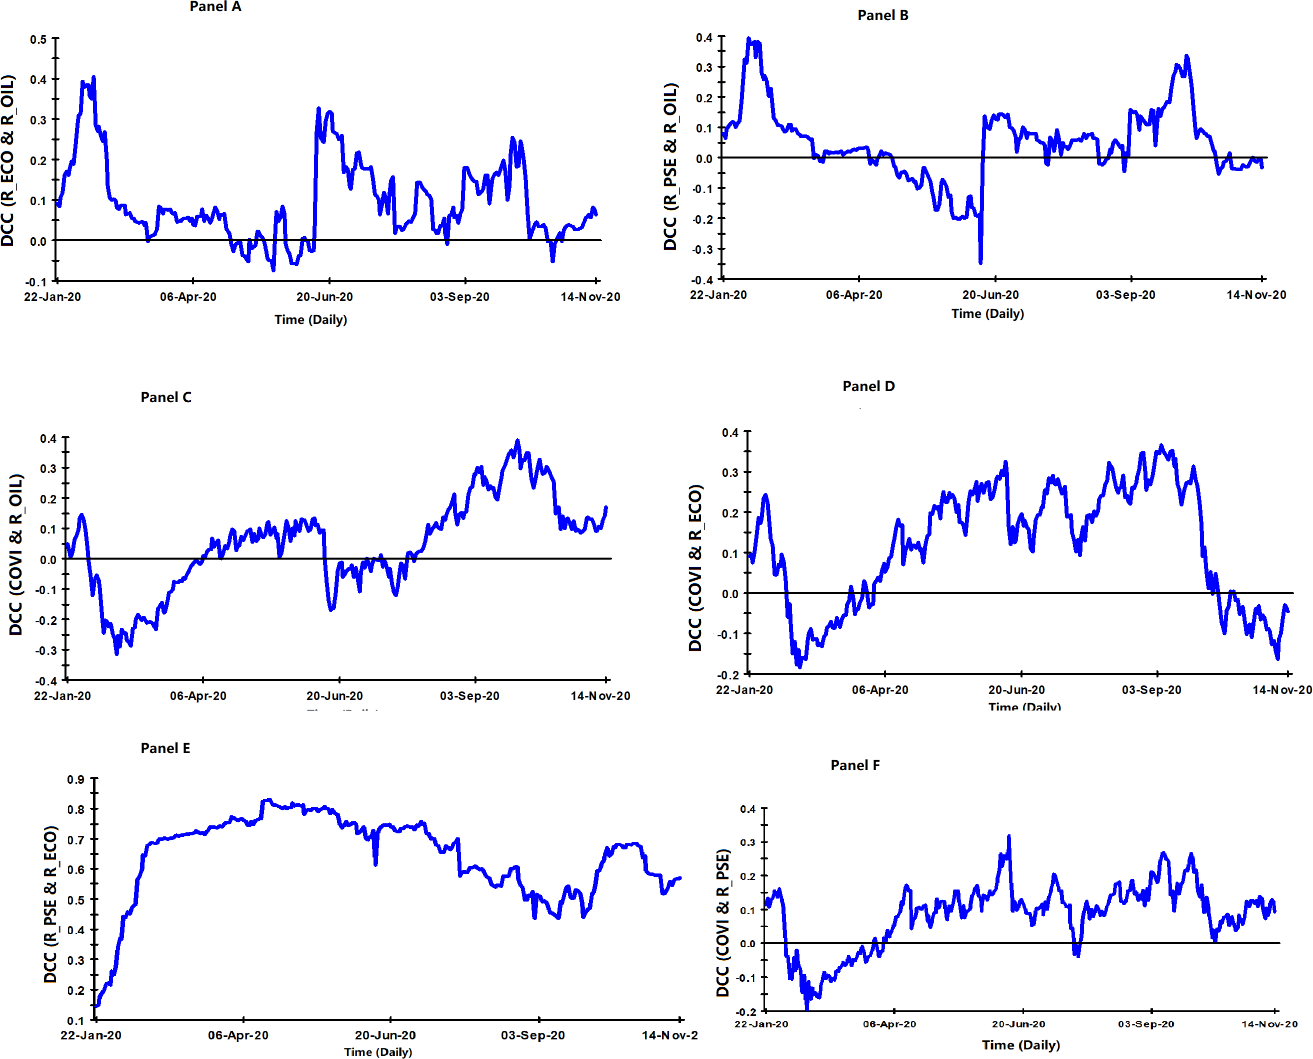
The time series plot of correlations is shown in Figure 1. The DCCs between R_ECO and R_OIL are mixed and vary significantly over time, ranging from -0.07 to 0.40 (Panel A). There is a positive but very weak correlation during the peak period of COVID-19 (March to May). During successive months, there is an upward trend in the correlation that remains mostly positive. Hence, higher oil prices provide better opportunities for clean energy investment. However, oil prices remain highly volatile during the peak of the COVID-19 pandemic. Declines in oil price signal deficient aggregate demand across sectors and a lower demand for clean energy. The correlation between R_PSE and R_OIL shows a different trend from that between R_ECO and R_OIL, as the correlation remains negative during the peak of COVID-19 (Panel B). The correlation values range from -0.34 to 0.39. The correlation has low values over the post-peak period, providing better scope for portfolio diversification during this period. Hence, technological firms’ stock have relatively higher significance in the market during the oil sector’s worst performance period. A similar visualization is provided by the plot of daily DCC values between all pairs of variables (Figure 1).
A negative DCC between COVI and R_OIL is observed during the peak COVID-19 period, as shown in Panel C of Figure 1. During this period, the higher COVI index is associated with lower oil prices, since COVI generates a negative demand shock. The variable COVI is negatively associated with oil returns from mid-June to mid-August, with both moving in opposite directions, reflecting the negative contagion effect of COVID-19 sentiment on the fossil fuel market.
During the peak COVID-19 period, the DCC between R_COVI and R_ECO is negative (Panel D of Figure 1), after which the correlation between COVI and R_ECO increases. The clean energy market recovers, as depicted by a positive correlation after mid-April. This result shows that a higher level of COVID-19 uncertainty is associated with a higher ECO return. This is similar to the case of technology stocks (Panel F of Figure 1). Clean energy investment seems to initially be negatively affected by COVID-19, but subsequently stabilizes investor sentiment and improves. Hence, there is a push in the stock returns of clean energy and technology after the post-peak period.
The DCC between clean energy and technology stocks is positive throughout the study period and almost greater than 0.5 (Panel E of Figure 1). There is an increasing trend in the correlation during the peak COVID-19 period, which then starts to decline. This result points out the low likelihood of portfolio diversification between these two stocks. The result documents the deep connection between these two stocks, which becomes stronger during the crisis period.

IV. CONCLUSION
This paper investigates the time-varying correlation between clean energy stocks, technology stocks, oil prices, and COVID-19 sentiment. It confirms the weaker positive association between oil and clean energy stock returns. Hence, COVID-19 has weakened the relation between the oil and clean energy markets. Technology stocks even moved in the opposite direction of oil price returns during the peak COVID-19 period and documented better performance. The correlation between COVID-19 and clean energy changed from weak and negative during the peak COVID period to positive and relatively high during the post-peak period. The results show the relatively better position of clean and technology stocks during the post-peak period. Hence, there is a need to emphasize investment in the clean energy stock market and to maintain continuous efforts on the technological front and government support. This will build better confidence among investors and reduce volatility.
Acknowledgement
The authors acknowledge helpful comments and suggestions from an anonymous reviewer and the editor of this journal. Errors or omissions, if any, are our own responsibility.
Here technology stocks mean the stocks of technology-related companies in various industries, such as computer hardware, software, electronics, aerospace and defense, telecommunications, semiconductors, and biotechnology and healthcare equipment.
More details can be obtained from Narayan et al. (2021).
Due to the rolling window technique, data from January are submerged during the estimation procedure; therefore, the DCC-GARCH correlations are presented from February to November 2020.