
I. Introduction
The outbreak and spread of COVID-19 have affected the health sector and other sectors of the economy (Strzelecki, 2020). The direct effect is visible in unemployment and growth, whereas indirect effects are spread across different sectors (Atkeson, 2020). Most economies adopted temporary or complete economic lockdowns, creating financial disasters to reduce the spread of the disease. The trade-off is between reducing the spread and economic growth (Fetzer et al., 2020). This impact on the economy is different from that in earlier experiences of recessions, since it influences both the supply and demand sides. In this context, the debate between debt financing and helicopter money is an essential policy discussion based on demand-side management and supply-side constraints (Baldwin & di Mauro, 2020).
The Indian economy is highly vulnerable due to its population density, sizable informal markets, and infrastructure issues. To reduce the spread of COVID-19, the Indian government initiated a strict lockdown on March 25, 2020. This led to an economic slowdown and loss of employment, especially for migrants in the informal sector. Comprehensive studies document the impact of the pandemic on various sectors of the Indian economy; however, the literature on the energy sector is scanty. As one knows, energy is an essential factor of production that contributes to an economy’s growth. Research focusing on the impact on the energy sector is thus crucial (Rath and Akram, 2020).
We analyze the power sector of the Indian economy during the pandemic. We use data on the power sector from the Power System Operation Corporation Limited (POSOCO) from March 23, 2020, to September 24, 2020. We use the region and zone definitions of POSOCO.[1] From these daily data, we see that the power supply increased, and the energy shortage was minimal. Fossil fuel contributes to maximum power generation, followed by hydropower and other renewable energy sources. Fossil fuel dependency is a concern; however, there is scope for investment opportunities in the renewable sectors. On a positive note, coal production decreased to three percentage points during six months, compared to one month prior to lockdown. A significant increase in hydropower is also noted (> 4%) during the same time.
The general assumption is that the energy demand should have been lower during the lockdown period; however, the residential energy demand increased, primarily due to work-from-home activities. Further, energy demand increased in hospitals and infrastructure related to quarantine centers, increasing energy demand. Except in Kerala, Sikkim, and Telangana, the average energy supply increased for all states in six months, compared to the one month after the lockdown. States that registered many confirmed cases had a higher energy demand, such as Maharashtra, Tamil Nadu, and Telangana. It is also important to note that these states’ gross state domestic product (GSDP) is also high. At the same time, states such as Jammu and Kashmir (J&K), Assam, and Uttar Pradesh (UP) experienced significant power shortages. In these cases, the energy supply is positively correlated with maximum energy demand (0.99), and energy storage is positively correlated with the energy shortage (0.92). During this time, Nepal, Bhutan, and Bangladesh turned into leading economies in the energy transition, along with India.

A regional analysis of the energy transition at the state level for the Indian economy explains that the southern region is an importer of energy within the Indian economy. Whereas the northern and northeast regions were net importers for one month after the lockdown, the rest were net exporters. This calls for a robust state energy policy at the state level, particularly for the southern and northern regions. At the national level, an energy outage of approximately 36% was recorded during the lockdown period, whereas an energy outage of 64% was estimated at state levels. As one of the largest economies in South Asia, India’s energy security is crucial. Energy trade can help understand this issue. We can observe that India imports from Bhutan and exports to Nepal and Bangladesh. Imports from Bhutan have consistently increased, whereas exports to Bangladesh diminished. Figure 1 illustrates the trend of energy trade for Bhutan, Nepal, and Bangladesh during the study period.
The next section explains the impact of the COVID-19 pandemic on the Indian power sector, and Section 3 concludes with a discussion and policy suggestions.
II. Impact of the COVID-19 Pandemic on the Power Sector
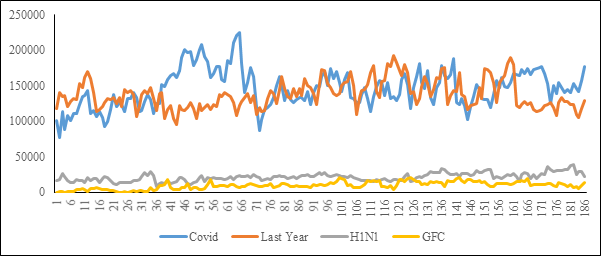
There are multiple ways to describe the impact of the COVID-19 pandemic on the power sector. First, we explain it from the investor perspective, using data from the Indian Energy Exchange (IEX). First, we present the market-clearing volume in Figure 2 and market-clearing prices in Figure 3 for various periods. The periods of our analysis include the COVID-19 lockdown and the lagged year series during the H1N1 pandemic and the global financial crisis (GFC) of 2007–2008. We use post six month data on COVID-19, H1N1, and GFC. Data are collected from March 24 to September 24, 2020, for the current lockdown and from the previous year, 2019. For the H1N1 pandemic, data are collected from September 1, 2009, to March 5, 2010; for GFC, information is collected from July 1, 2008, to January 2, 2009. From Figure 2, we can conclude that the market-clearing volume was much lower during the H1N1 pandemic and the GFC than during the current pandemic and the lagged year.
.png)
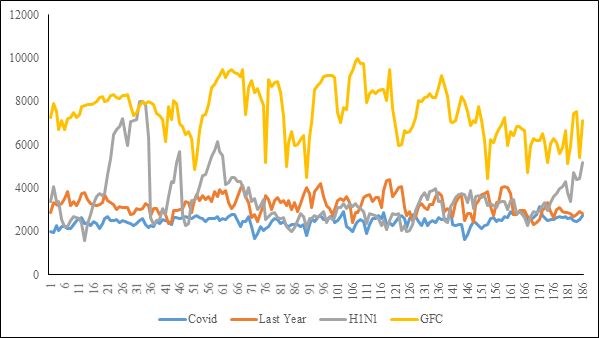
Similarly, Figure 3 confirms that the market-clearing price was much higher during the H1N1 pandemic and the GFC than in the previous year or during the 2020 lockdown. From the price point of view, this indicates a loss of investor confidence during the lockdown, which could be due to demand- and supply-side shocks in the Indian energy market. However, the collapse of the demand side (e.g., industrial and production-related demand) had a substantial effect. Therefore, energy policies must focus on demand-side measures apart from liquidity flow.
One significant barrier in this regard can be transmission and distribution (T&D) losses. This is the second parameter used to understand the impact of the COVID-19 pandemic on the power sector of India. We collected weekly data for T&D losses from POSOCO. We estimate the growth rate of 27 consecutive weeks (covering six months), starting on March 23, 2020, to capture the weekly change. The T&D losses were much lower during the initial weeks of the lockdown, but have increased significantly since then. Despite the pandemic, one good sign is that the volatility spread is smaller than in the previous year.
.png)
We further investigate the T&D losses at the regional and subregional levels, essential for a decentralized energy policy. Using data for 27 weeks at the regional level, we confirm that maximum volatility is found for the northeastern regions, followed by the western, eastern, southern, and northern regions. However, the northeastern regions were comparatively stable in terms of T&D loss for the first month of the lockdown. On the contrary, the eastern region initially had higher losses, which diminished over the next few months, but not consistently. The western and northern regions exhibited an adverse change in the initial phase. Though the northern region reduced volatility to a tolerable level, the western region experienced severe fluctuations. The southern region experienced growth in the initial weeks and performed better than the other regions, except the northern region, in the six months. The eastern region initially experienced losses, with the losses continuing over the six months.
Finally, we estimate the losses at the subregional level and present them in Table 1, with an average for all nine zones. Due to postponements, concessions, and the closure of several industrial firms, the northern zone experienced the highest losses, followed by the western, southern, northeastern, and eastern regions. This was true for the initial weeks, and the result remained consistent after the sixth month. For all the regions, zone I experienced the maximum loss, with a gradual decrease for the subsequent zones. All the zones for the eastern regions had a smaller T&D loss. The gap between the T&D losses for the northeastern and southern regions is marginal. There is a wider gap between the western and northern zones compared to the overall T&D loss. Except for the northern region, T&D losses increased after six months compared to the first month of lockdown. Higher T&D losses are a matter of concern and call for strategic policy support at both the aggregate and regional levels.
III. Factors Determining the Energy Supply in the Indian States
Several factors due to pandemic influenced the power supply, including the closure of the production market, with the power supply mainly confined to household, commercial, and hospital use. We derive the factors influencing the energy supply across states using the following econometric specification:
ESit= β0+β1EEDit+β2ICUit+β3CCit+β4GSDPit+β5L.ESit+uit
where ES is the energy supply, EED is the excess energy demand, ICU is the inability of capacity utilization,[2] and CC is the number of COVID-19 cases.
We use a balanced panel for the Indian states and union territories. The data are obtained from POSOCO and the Reserve Bank of India[3] for the first six months from March 23, 2020. We estimate four models to determine the factors responsible for the energy supply across the Indian states. In model (1), we estimate ES as a function of energy indicators; in model (2), we introduce the number of COVID-19 cases; in model (3), the GSDP is further introduced; and model (4) allows for lagged values. Based on the Hausman test, we accept the fixed effect estimates. The results in model (1) are in line with our hypothesis. The variable EED has a positive effect in driving up ES, whereas ICU has an adverse impact on ES. Model (2) shows that a higher number of COVID-19 cases positively affects ES. This is because the power supply in hospitals and nursing homes massively increased. Model (3) shows the higher-income states having higher ES values. Further, in model (4), we observe that a one-day lag positively influences ES. The variables are robust and significant across all the models (Table 2).
IV. Conclusion
Analysis from the investor’s perspective using daily market clearing volumes and market clearing prices confirm that, during the COVID-19 pandemic, the market clearance in terms of volume and price was lower than during the H1N1 pandemic and after the GFC of 2007–2008, indicating a negative impact on investor sentiment. This result is due to both demand- and supply-side factors in the economy related to the lockdown. Further, we analyze the T&D losses at the aggregate and regional levels of India. The results show heterogeneity in T&D losses at the aggregate and regional levels. These differences require clear guidelines and policy support at both the aggregate and disaggregate levels. Overdependency on fossil fuels is one of the major bottlenecks of the energy security of the Indian economy. Hence, investment incentives should be given priority when designing future energy policies on renewable energy sources. Further, we conclude that the energy supply is influenced by multiple factors, such as excess energy demand, capacity utilization, the number of COVID-19 cases, and higher income.
For details, see https://posoco.in/reports/daily-reports/.
The ratio of the energy supply shortage during its peak and the maximum energy demand at peak hours of the day.
We collected the GSDP data for 2018. For the convenience of the empirical estimate, we transform the time components by weighting with the number of days.