
I. INTRODUCTION
The electricity market is crucial to all sectors of an economy, because of power consumption and mitigating production functions. The residents need electricity to mitigate their power demand at home. Similarly, the producers that manufacture the electricity also supply the electricity market to mitigate the energy demand. The supply and demand for electricity are guided by the spot electricity price in India (Girish et al., 2018). However, the current COVID-19 situation poses a significant threat to the electricity market, since the electricity demand has decreases due to the slowdown in economic activities (Rath & Akram, 2020). For instance, electricity use in India shows a decrease of 10.4% in May 2021 compared to April 2021.[1] This is attributed to the state-wise lockdown introduced in various states in India during the second wave of COVID-19; hence different industrial, commercial, and service operations are not running during this time at their full capacity. This indicates that the electricity market in India is very vulnerable to the second wave of COVID-19. Moreover, the electricity consumption pattern also changed during the COVID-19 pandemic, increasing household electricity consumption. Therefore, changes in the electricity consumption pattern are problematic for the discovery of the spot electricity price, since the COVID-19 pandemic has generated positive and negative shocks in terms of electricity demand.
Against this backdrop, the study aims to model the asymmetric impact of COVID-19 on the spot electricity price in India. The positive shock of COVID-19 on the electricity market shows the increasing electricity demand of households as people stay at home due to complete lockdown. The spot electricity price will therefore increase. Similarly, the negative shock of COVID-19 can influence the electricity market through fewer industrial and service sector operations, thereby reducing the demand for the electricity market, as reflected by a decrease in the spot electricity price. Therefore, it is possible to argue that the COVID-19 pandemic has had an asymmetric impact on the spot electricity price in India.
However, Rath & Akram (2020) argue that the ongoing coronavirus pandemic will disrupt the electricity market across India if it is not effectively managed. No study is yet available that empirically examines the asymmetric impact of the second wave of coronavirus on the Indian spot electricity market. Therefore, our study attempts an empirical investigation using the average daily spot electricity price during the second wave (i.e., February 1, 2021, to May 15, 2021). The estimated nonlinear autoregressive distributed lag (NARDL) model shows that both positive and negative shocks from COVID-19 have reduced India’s long-run spot electricity price. Surprisingly, the negative shock of the COVID-19 pandemic outweighs its positive shock while reducing the spot electricity price in India. These findings show our significant contribution to the literature.
The remainder of the study is organized in the following fashion. Section II provides the details of the data and methodology. Section IV discusses the results. The final section concludes the paper.
II. DATA AND METHODOLOGY
A. Data
This study employs daily data on the spot electricity price and the second wave of the COVID-19 pandemic. According to a report by the Indian Council of Medical Research, the second wave started in February.[2] The data for spot electricity price from February 1, 2021, to May 15, 2021, were obtained from the India Energy Exchange (IEA), while the numbers of confirmed positive COVID-19 cases during this period were obtained from World Health Organization data, the most reliable data for COVID-19 cases for India at present.
B. Theoretical Framework and Methodology
The spot electricity price and COVID-19 framework introduced by Rath & Akram (2020) are used as a baseline theoretical framework for the construction of the model of the positive and negative shocks of COVID-19 on the spot electricity price. For instance, a negative shock arises when there is a leftward shift in the electricity demand due to complete, partial, and weekend lockdowns; investors in the power exchange thereby suffer a loss. In contrast, a positive shock of COVID-19 causes a rightward shift in the electricity demand, due to the rise in electricity demand from the household sector, health care, and other public institutions. Our study further conducts a Brock–Dechert–Scheinkman (BDS) nonlinearity test, proposed by Brock et al. (1996), for the variables, before introducing the nonlinear empirical model. The evidence indicates nonlinearity in the series. Therefore, the asymmetric impact of the COVID-19 pandemic on the spot electricity price can be captured by the NARDL approach proposed by Shin et al. (2014).
Since nonlinearity is present in the data series, the following equation is presented:
EPt=τ0+τ1COVID_19+t+τ2COVID_19−t+μt
where EP is the spot electricity price, indicates a positive COVID-19 shock, and represents a negative COVID-19 shock. We chose two variables in our model (Ahmed & Ozturk, 2018), because our main aim is to investigate the asymmetric impact of COVID-19 on the spot electricity price. Since the study aims to detect the asymmetric impact of COVID-19 on the spot electricity price, the COVID-19 variable undergoes decomposition as an increase and decrease in the variables of the following equations, respectively:
COVID_19+t=t∑j=1ΔCOVID_19+j=t∑j=1max(ΔCOVID_19+j, 0)
COVID_19−t=t∑j=1ΔCOVID_19−j=t∑j=1max(ΔCOVID_19−j, 0)
where indicates the variations in the COVID-19 values and is the change in the spot electricity price, as follows:
ΔEPt=ρ0+p∑k=0ρ1ΔEPt−k+p∑k=0ρ2COVID_19+t+p∑k=0ρ3COVID_19−t+φ0EPt−1+φ1COVID_19+t−1+φ2COVID_19−t−1+μt
where the existence of short-run asymmetry can be confirmed by testing the equality = while the long-run asymmetry can be tested by the equality An asymmetric impact can be confirmed when we find evidence against this condition. The error correction term (ECT) is specified in the following equation:
ΔEPt=ρ0+p∑k=0ρ1ΔEPt−k+p∑k=0ρ2COVID_19+t+p∑k=0ρ3COVID_19−t+γ0ECTt−1+μt
The restriction of this model is that the maximum integration order of the variables considered should not go beyond the first-difference stationarity. The cointegration was confirmed after validating the integration order by testing the null hypothesis against the alternative hypothesis If the estimated F-statistic is far from the tabulated value, then we can confirm the asymmetric cointegration among the series, and vice versa. Subsequently, the long- and short-run coefficients are also estimated using equations (4) and (5), respectively.
III. RESULTS
Table 1 presents the descriptive statistics and correlations. The COVID-19 average is higher than the EP value. In terms of standard deviations (SD), EP is less volatile, because the SD is below the average, while COVID-19 has high volatility, because the SD is above the mean value. The estimated correlation indicates a negative and significant correlation between EP and the COVID-19 variable, meaning that these variables move opposite each other. Specifically, an increase in the COVID-19 value leads to a decrease in EP, and vice versa. This study uses the nonlinearity BDS test introduced by Brock et al. (1996). A statistically significant BDS statistic is found, evidencing the nonlinearity in the data (Panel III of Table 1). Thus, the nonlinear model is ideal for our estimation.
To conduct an estimation of the NARDL model, this study assesses the unit root property. Table 2 (Panel 1) reports the outcome of unit root tests, that is, the augmented Dickey–Fuller (ADF) and Phillips–Perron (PP) tests. The results indicate that all the variables are nonstationary in levels and stationary in first differences at the 1% level of significance.[3] Hence, we can conclude that the variables considered in the unit root tests are found to be nonstationary in levels and also provide first difference stationarity. Further, a cointegration test is conducted on the decomposed series to establish the long-run relation. The outcomes of the cointegration test are reported in Table 2 (Panel II), where we find that the estimated value surpassing the F-bounds at the 1% level of significance. Hence, we conclude that there is asymmetric cointegration between COVID-19 and the spot electricity price (EP).
Table 3 shows the long- and short-run results of the NARDL model. The long-run results in Panel I indicate that both positive and negative shocks of COVID-19 significantly reduced the spot electricity price in India. However, the negative shock arising from COVID-19 had a dominant impact in reducing the spot electricity price in India. The possible economic rationale could be the dramatic decline in electricity consumption from the service and industrial sectors due to the lockdown, and limited operations can lead to a decrease in the electricity demand, thereby decreasing the spot electricity price in India. Moreover, the state-level lockdown measures during the second wave of COVID-19 in India probably reduced the state-level electricity demand in the industrial and service sectors, thereby decreasing the spot electricity price.
In the short run, the results presented in Panel II of Table 3 indicate that the positive shock of the COVID-19 pandemic reduced the spot electricity price. This could be due to the short-term government assistance to the electricity market as a part of pandemic-related aid, and the electricity suppliers could thereby have reduced their prices. However, the negative shocks arising from COVID-19 positively influence EP. The possible inference is that the negative shocks of COVID-19 that arose took time to influence the electricity prices in the short run in India. Moreover, the error correction term, that is, the speed of adjustment to the long-run equilibrium, represents the disequilibrium correction of 53% to attain the long-run equilibrium.
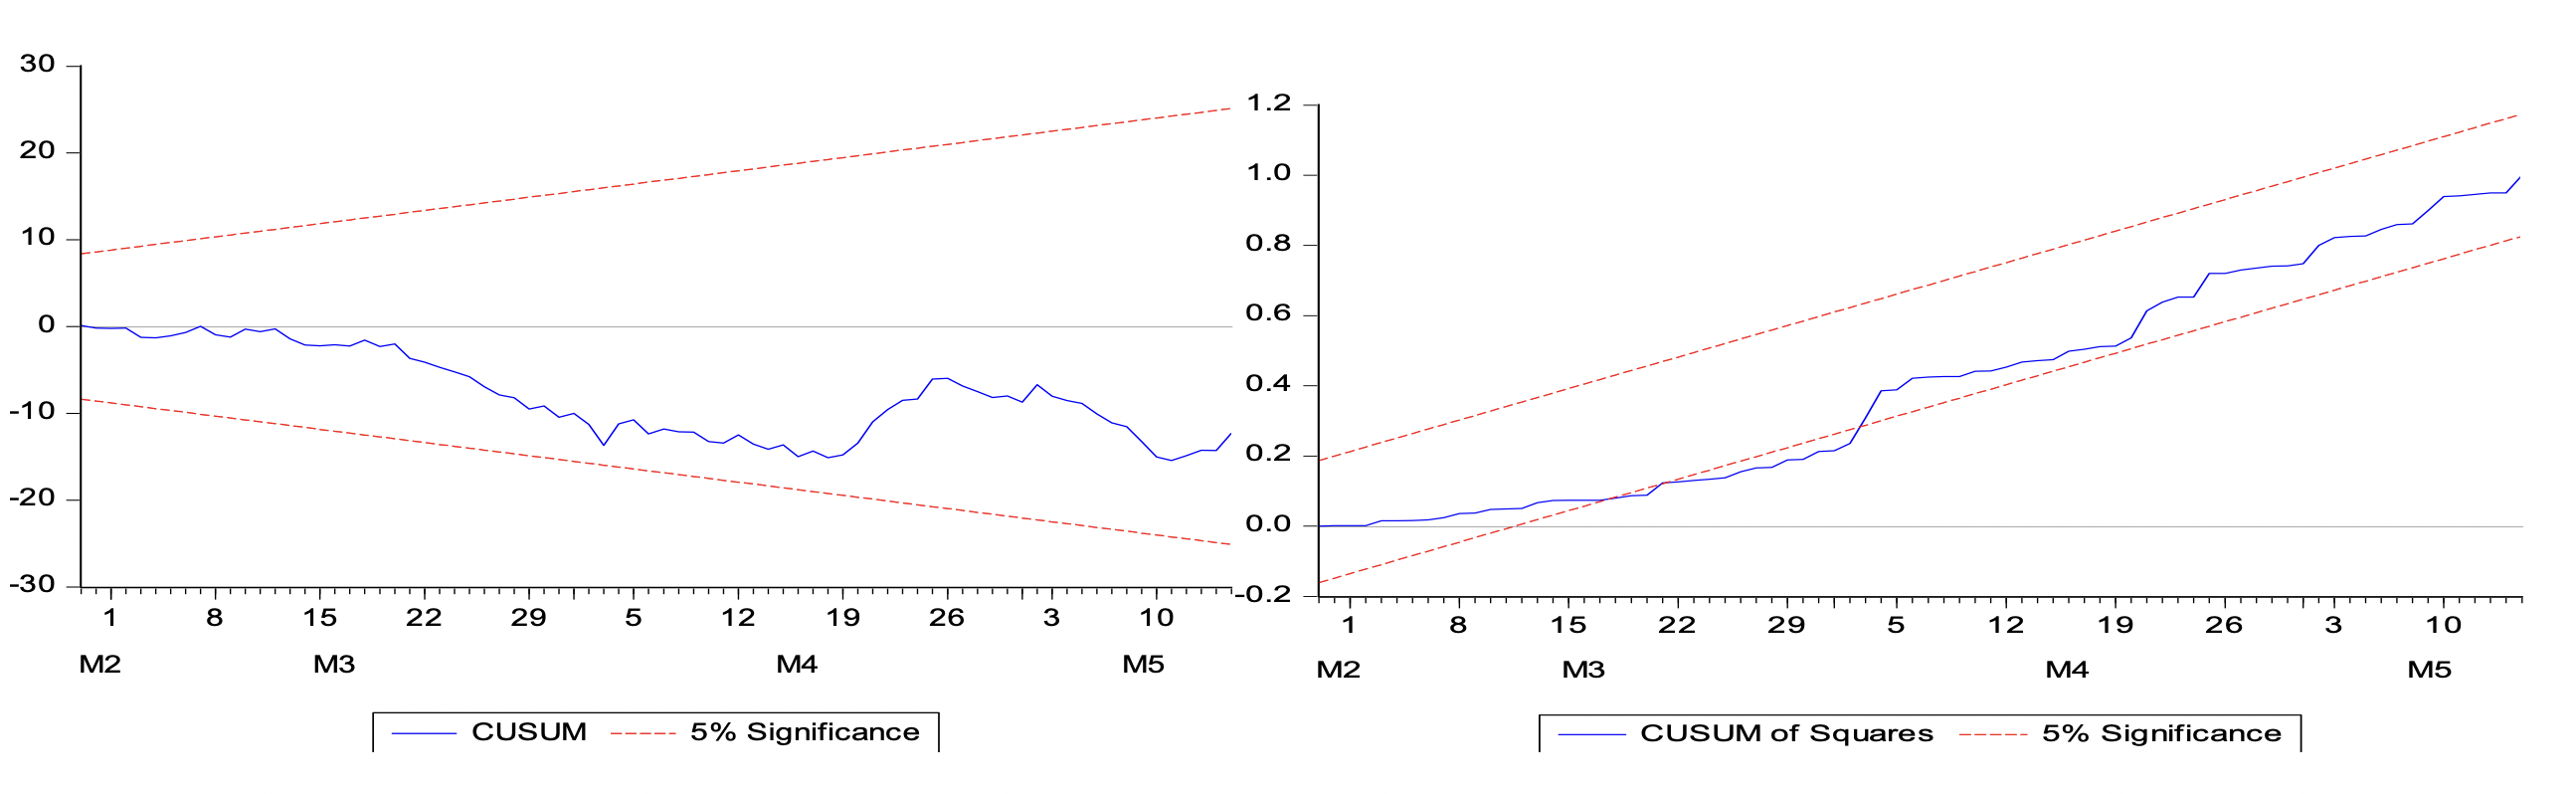
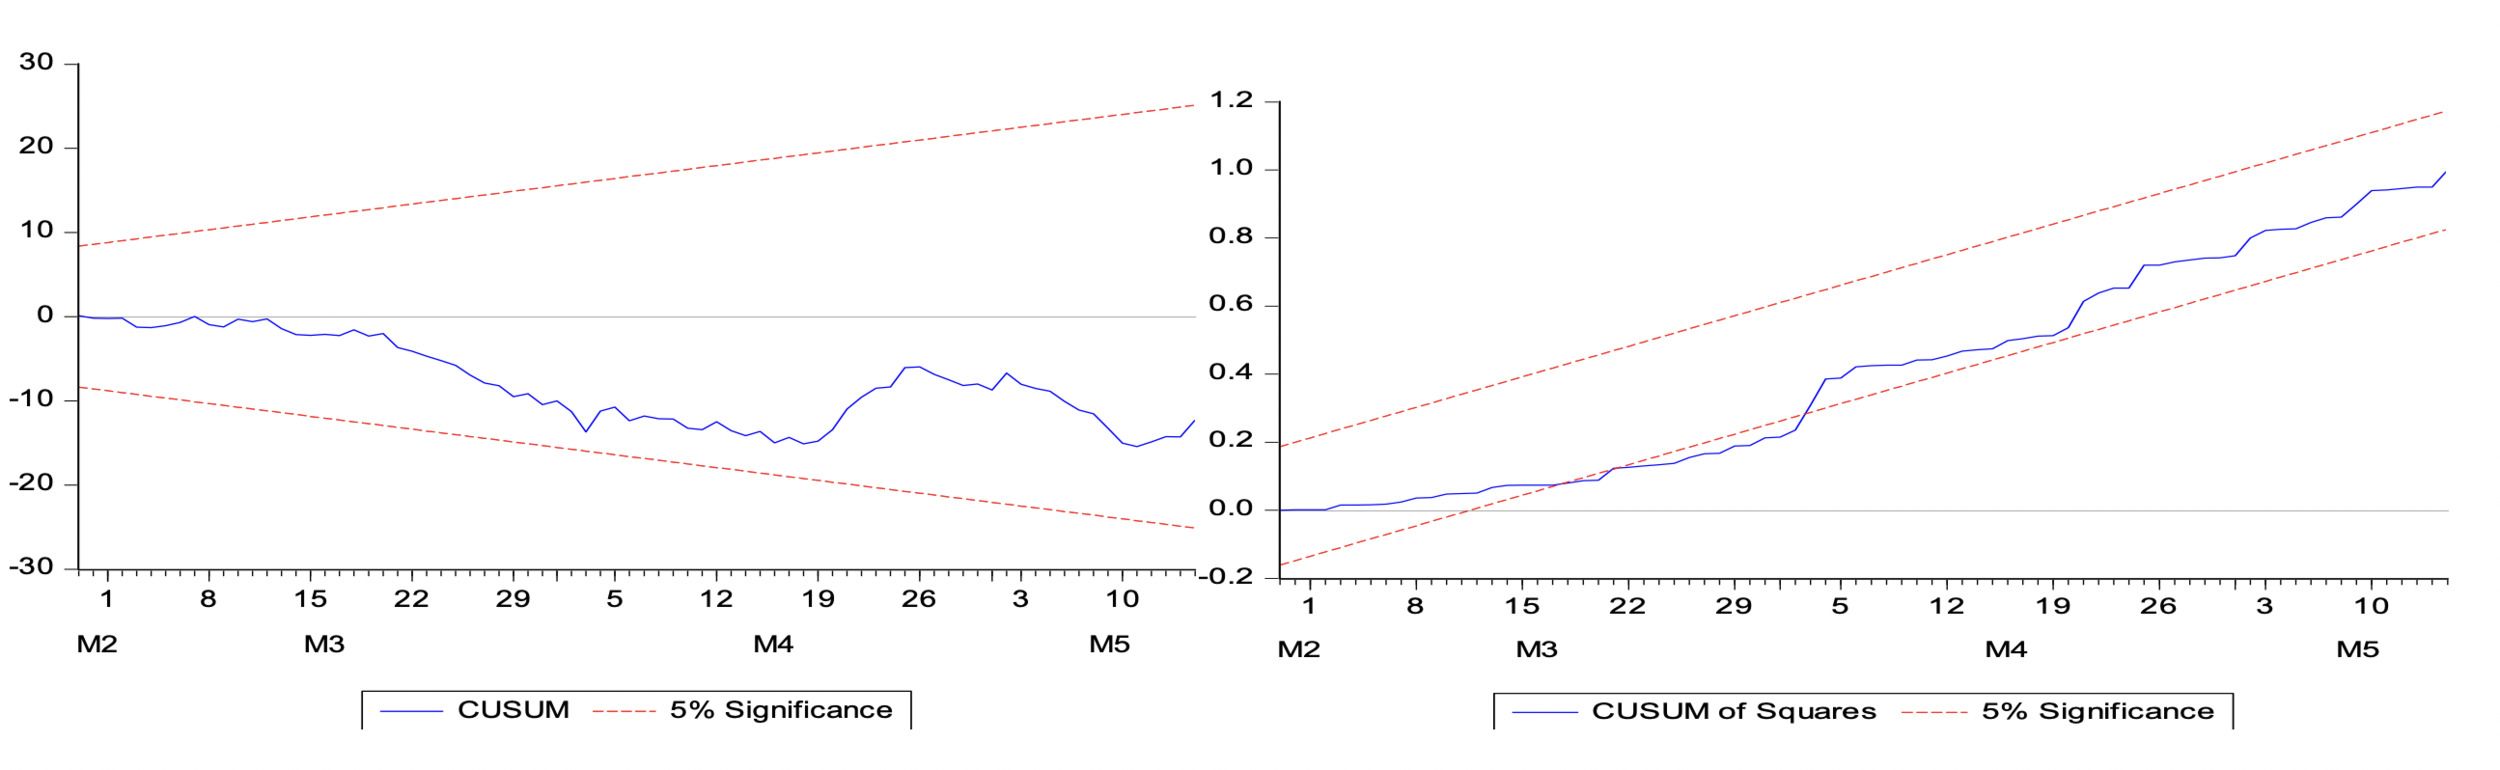
Similarly, the adequacy of the model was tested by using different approaches. First, the model is stable, since CUSUM and CUSUMSq (Figure 1) fall at the 5% level of significance. Second, the model has reasonable coefficients for the determination (R2 = 35%), meaning that the positive and negative shocks of COVID-19 jointly determine 35% of the spot electricity price in this period, and the rest variation of the Indian spot electricity price is explained by other exogenous factors that are not considered in our bivariate model. This finding indicates the crucial role of COVID-19 in the Indian electricity market. Third, the model is free from serial correlation, autocorrelation, and non-normality. Finally, the asymmetric dynamic multiplier in Figure 2 indicates that the information associated with the spot electricity price (EP) involves COVID-19. It also shows that a 1% increase in the negative shock of COVID-19 influences EP more than a 1% increase in the positive shock of COVID-19. Similarly, this study confirms long-run asymmetry, while there is no evidence of short-term asymmetry.

IV. CONCLUSIONS
We explore the asymmetric impact of the COVID-19 pandemic on India’s electricity spot price. The estimated NARDL model shows that both positive and negative shocks from COVID-19 reduced the long-run spot electricity price. Surprisingly, the COVID-19 negative shock outweighs its positive shock while reducing the spot electricity price in India.
In line with the above findings, it can be argued that people in India found it hard to travel and producers also shut down their business activities due to the COVID-19 restrictions imposed during the first and second waves. Therefore, the electricity demand was lower during COVID-19 outbreaks, which further lowered India’s spot electricity price. Eventually, India’s electricity supply was also affected by the lack of a favorable spot electricity price. If the negative shock of COVID-19 tended to be overlooked by policymakers in their policy decisions in the electricity market, the ability of the Indian economy to achieve excellent electricity production in the long run will have been weakened. Therefore, our findings highlight the possibility of including the COVID-19 outbreak as one of the crucial determinants in making electricity policy decisions worldwide.
More details are available at https://economictimes.indiatimes.com/news/india/covid-19-trajectory-similar-to-feb-when-second-wave-began/articleshow/84278260.cms?from=mdr.
We note that the higher the more positive or least negative values of both the unit root tests, the greater the presence of the unit root (i.e., nonstationarity), and vice versa for making the stationary decision. We are very thankful to the reviewers for having raised this important issue.