I. INTRODUCTION
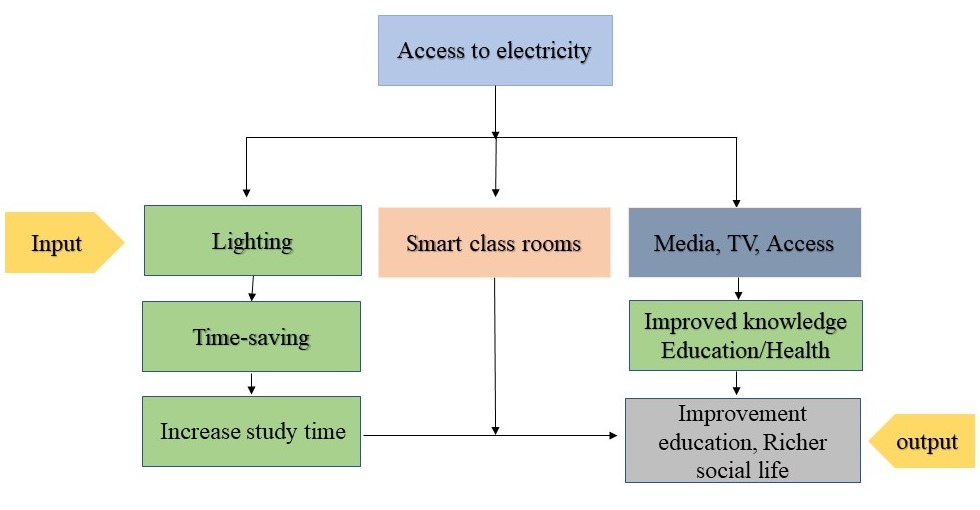
The main of aim this study is to investigate the causality between access to electricity and the education of pupils, because, in the case of BRICS (Brazil, Russia, India, China and South Africa) countries, it is believed that educational institutions with access to the power provide a better way of life, thereby improving the literacy, quality of education, and educational system through the provision of computers education and smart classrooms. A detailed theoretical framework is displayed in the Figure 1.

According to the Economic Survey of India, it is noted that states that have greater access to electricity have higher literacy rates. However, more still needs to be done in the area of electrification in India. Similarly, in the case of South Africa, based on a recent survey done by the World Bank and United Nations Educational, Scientific and Cultural Organization (UNESCO), around four of every five primary and secondary schools in Africa lack access to electricity, along with almost three-quarters of village schools in India. Moreover, data from Ritchie and Roser (2019) for the year 2016 show that 100% of the population in Brazil, Russia, and China have access to electricity, whereas 84.25% of the population in South Africa and 84.35% of the population in India do. In a nutshell, access to electricity is seen as a key variable affecting economic, social, and human development, particularly in BRICS countries, with some countries having 100% access and some having below 100% access. Similar variation is noted in the primary and secondary education levels of the pupils.[1] This issue gained more attention when President Obama promised USD 7 billion to establish the electrical infrastructure in sub-Saharan Africa in 2014. Further, Obama stated that that electricity is “the lifeline for families to meet their most basic needs and it’s the connection needed to plug Africa into the grid of the global economy.”
Against this backdrop, the present study contributes to the literature in the following manner. First, the majority of studies have emphasized the link between access to electricity and education in the case of African countries at the regional level, but studies in the case of BRICS countries as panels and at the individual level are scanty. Addressing this issue in the case of BRICS countries is important, because countries such as India and South Africa have less than 100% access to electricity. Further, the literature does not provide any consensus on the link between access to electricity and education. For instance, Khandker et al. (2013, 2014) and Kennedy et al. (2019) find a positive association between access to electricity and education attainment, while Bensch et al. (2011) find no effect. Lipscomb et al. (2013) note conflicting findings. Further, Dang and La (2019) investigate the impact of electricity on welfare and economic decisions. Akram et al. (2020a, 2020b) examine the link between human capital and energy consumption. Ahmad et al. (2014) find a link between household electricity access and human well-being in the case of India. Although these studies examine the link between electricity and education attainment, human capital, and welfare and economic decisions, they further motivate an examination of the causality between access to electricity and education.
Second, although the majority of the literature consider school attendance, education attainment, and the hazards of dropping out, this study considers the primary and secondary education of pupils as better proxies for education attainment. As discussed above, access to electricity helps pupils by improving literacy, the quality of education, and the quality of the educational system through providing computers education and smart classrooms. This study thus uses the primary and secondary education of pupils in BRICS countries for more policy insights. Further, this study considers aggregate education by taking the average of the primary and secondary education indexes. To attain the above objectives, this study applies the widely used Granger causality test for each country and the Dumitrescu–Hurlin (2012, D-H hereafter) test for the panel of five BRICS countries. The results find Granger causality from access to electricity to education for Brazil and China. For the panel of five countries, causality is also found from access to electricity to education.
The remainder of the paper is organized as follows. Section II describes the methodology; Section III discusses the empirical results. Section IV concludes the paper.
II. METHODOLOGY AND DATA
A. Methodology
This study implements both time series causality, that is, Granger (1969) causality, and a panel causality (D-H) panel approach. There might be an issue of cross-sectional dependency (CD) when all the countries are converted into the panel. Therefore, CD is first tested by applying the Pesaran (2007) CD test. Therefore, the D-H test is used, which is superior to the panel Granger causality test in accounting for the cross-sectional dependency. The following equations are used to test the D-H causality between access to electricity and the education of pupils:
ACSELi,t=K∑k=1α(k)iACSELi, t−k+K∑k=1β(k)iEDUPSi, t−k+εi,t
EDUPSi,t=K∑k=1θ(k)iEDUPSi, t−k+K∑k=1γ(k)iACSELi, t−k+εi,t
where and stand for access to electricity and the education of pupils, respectively; refers to the lag length; and α, β, θ, and γ are the autoregressive parameters that need to be estimated. One can reach to conclusion of causality if the tabulated value is greater than the critical value. In other words, the null of no causality running from one variable to the other can be rejected if the tabulated value is greater than the critical value.
B. Data
Data on access to electricity and the primary and secondary education of pupils are collected from the World Development Indicators published by the World Bank. The sample period is considered from 1993 to 2018, based on data availability. Unlike the access to electricity index, the index for the education of pupils is not provided by the World Development Indicators. Hence, to create the education index, this study uses the relative distance method. This methodology was developed by the United Nations Development Programme to build the human development index to rank countries, and it normalizes the series on a scale from zero to 100 (Dholakia, 2005), as follows:
Education Indexk=[Ymax−YkYmax−Ymin]×100;Ymax{Yk}∀k, Ymin{Yk}∀k
where k indicates the countries (k = 1, …, 5), the values of the indices lie on a scale between zero and 100, and Y refers to the education series.
III. EMPIRICAL RESULTS
This section starts with a discussion of the cross-sectional dependency results. The results in Table 1 for the panel of five BRICS countries suggest evidence of cross-sectional dependency among the variables, except for the primary education of the pupils.
In the second stage, a time series causality test is conducted, with the results in Table 2 (Panel A). Given these results, it can be stated that access to electricity (ACSEL) is causing the aggregate education (AGG) of the pupils in Brazil and China, while, in the case of Russia, India, and South Africa, we find no evidence of causality between ACSEL and AGG. The reason could be the low access to electricity in Russia, India, and South Africa (Ritchie and Roser, 2019). Further, this study considers education at the primary level (PIM) and secondary level (SEC) to determine the causal relation with ACSEL. Further, for China, ACSEL is causing both PIM and SEC, whereas, in the case of Brazil, Russia, and South Africa, no causality is found from ACSEL to PIM and SEC. The reason behind the causality running from ACSEL to AGG, PIM, and SEC in the case of China is that 100% of the population there have access to electricity, whereas less than 100% do in South Africa and India.
Next, we construct the panel of five BRICS countries to test the overall causality between ACSEL and AGG, PIM, and SEC. The D-H results are presented in Table 2 (Panel B) and show that causality runs from ACSEL to AGG, PIM, and SEC. This suggests that access to electricity is a vital indicator of educational attainment.
IV. CONCLUSION
This study examines the causality between access to electricity and the education of pupils across BRICS countries for the period 1993–2018. To do so, Granger and D-H causality tests are implemented. The results derived from the Granger causality test show evidence of unidirectional causality running from access to electricity to education in the case of Brazil and China, whereas, in the case of India, Russia, and South Africa, no causality running from access to electricity to education is found.
Given these findings, it is therefore recommended that India, South Africa, and Russia pay more attention to access to electricity for the betterment of the education sector. These countries can learn strategies from Brazil and China in terms of providing access to electricity to the entire population. Providing access to electricity will not only help the education sector, but also provide a better way of life, thereby improving literacy.
Acknowledgements
The authors gratefully acknowledge the valuable suggestions received from the Guest Editor Prof. Badri Narayan Rath and anonymous referees on the earlier draft of this paper which substantially improved the paper. The usual disclaimer applies.
See the World Bank database.