I. Introduction
Energy is the material basis and guarantee for human survival and economic development. Therefore, fluctuations in the energy market will have a profound impact on the global economy (Li & Wei, 2018). In particular, with the accelerating urbanization and industrialization in China, oil, as a major energy source, plays an important role in the Chinese national economy. In this regard, international oil price fluctuations will have an influence on China’s energy industry and even the macroeconomic environment.
As a barometer of the national economy, the stock market can reflect the dynamic effects of international oil prices on the real economy to some degree. With the increasing relevance between oil prices and financial markets, a number of studies have been recently carried out on the impact of oil price shocks on stock markets. In terms of research subjects, studies have been conducted on both global stock markets (Escobari & Sharma, 2020; Maghyereh & Abdoh, 2021) and specific countries and regions (Alamgir & Amin, 2021; Diaz et al., 2016), and there are also relevant studies from the perspective of oil-importing and exporting countries (Youssef & Mokni, 2019). Regarding research methods, a series of studies have been conducted using vector autoregression (VAR) models (Cunado & Perez de Gracia, 2014), quantile regression methods (Joo & Park, 2021; Mokni, 2020), nonlinear autoregressive distributed lag models (Alamgir & Amin, 2021), and generalized autoregressive conditional heteroskedasticity (GARCH) models (Diaz et al., 2016).
Most studies are now focusing on the impact of international oil price fluctuations on the overall stock market, with less research on the energy stock market. Several studies examine the impact of oil prices on the returns of companies in different industries and find that the oil price–stock return relation is characterized by asymmetric effects. Based on that, we specially pay attention to the energy market (Narayan & Sharma, 2011; Phan et al., 2015). A combination of VAR and dynamic conditional correlation (DCC) GARCH models are used in this paper to examine the impact of international crude oil prices on Chinese energy stock prices. The results show a one-way mean spillover effect and time-varying conditional correlation between international crude oil returns and Chinese energy returns. The limitation of this paper is that this claim is not further tested using a different methodology. We leave this matter to future studies.
Our study contributes to the literature in two ways. First, we supplement the literature on the impact of international oil prices on financial markets from the perspective of the Chinese energy market and the VAR-DCC-GARCH approach. Second, we provide theoretical and empirical evidence for Chinese energy enterprises to successfully cope with external shocks and allow investors to more easily and rationally construct portfolios for risk diversification (Awartani & Maghyereh, 2013). The remainder of this article is organized as follows. Section Ⅱ presents the data and methods. Section III discusses the results. The concluding remarks are provided in the final section, Section IV.
II. Data and Methodology
A. Data
This study uses the price of West Texas Intermediate oil (WTI) as a benchmark for international oil prices, since it is commonly used as a reference price to reflect the current international oil market. We obtain WTI price data from the US Energy Information Administration. In addition, we select the CSI Energy Index to describe the volatility of the Chinese energy market, since it is reflective of the overall performance of a company’s stocks in the sector. We use the bilateral exchange rates issued by the Federal Reserve System for exchange rate conversion.
Our final sample covers a time series of 806 observations from January 1, 2018 to June 31, 2021, as shown in Panel A of Table 1. We define daily returns as the logarithmic difference between two consecutive prices, as follows:
Rt=lnPtPt−1=lnPt−lnPt−1
B. Vector Autoregressive Model
To capture the autocorrelation and correlation between the oil and energy stock markets, we adopt a VAR model, with each return series expressed by VAR(p), as follows:
Rt=c+p∑i=1ϕiRt−i+εt
εt|Ωt−1≈N(0,Ht)
where is a two-dimensional random vector representing the percentage change of price, denoted as is a two-vector of constants; is a time-invariant 2×2 matrix indicating serial correlation and spillover effects; and is a two-vector of error terms conditional on past information at time t - 1.
C. DCC-GARCH
We use the DCC specification to obtain dynamic correlations (Engle, 2002; Tse & Tsui, 2002). To estimate the DCC model, we first need to calculate the parameters.
The conditional variance–covariance matrix, can be written as follows:
Ht=DtRtDt
where is the 2×2 diagonal matrix of the dynamic standard deviation and is a matrix of dynamic correlation coefficients given by
Rt=[diag(Qt)−1/2]Qt[diag(Qt)−1/2]
The positive definite matrix with conditional heteroscedasticity, is denoted as
Qt=(1−θ1−θ2)Q′+θ1(vt−1v′t−1)+θ2Qt−1
where represents the 2×2 unconditional variance matrix of standardized residuals and is the standardized residual. The coefficients and of the DCC model denote the conditional correlation effects.
Second, we further explore dynamic conditional correlation, which can be expressed as
ρ12,t=q12,t√q11,tq22,t
III. Results and Discussion
A. VAR model estimation
Based on the Akaike (1974) information criterion, the Bayesian information criterion (Schwarz, 1978), and Hannan–Quinn (1979) information criterion, we select a bivariate VAR model with a lag of one to examine the relation between the international crude oil market and China’s energy sector. The results are shown in Panel B of Table 1.
The VAR(1) results show serial correlation in the international crude oil market. Specially, for every 1% increase in returns in China’s energy sector in the last period, international oil market returns will fall by 0.16% in the current period. However, China’s energy market has no influence on the international crude oil market.
We find no serial correlation for China’s energy market. Moreover, the international crude oil market has a significant positive impact on the Chinese energy market, which is in line with realistic expectations. Specifically, when the oil returns in the previous period rise by 1%, China’s energy returns in the current period are expected to rise by 0.04%.
In conclusion, the international crude oil market has a positive one-way mean spillover effect on China’s energy stock market.
B. DCC-GARCH model estimation
We first use the GARCH(1,1) model to fit the volatility of international crude oil returns and China’s energy returns and find that all estimated ARCH coefficients and GARCH coefficients are positive and significant and, in particular, the value of is less than one, which suggests pronounced autocorrelation in dynamic volatility. In turn, we proceed to the dynamic parameter estimation in the next step. Table 2 reports the parameters we obtain.
For the DCC results, the estimates for the first parameter, and the second parameter, are positive and significant at the 5% and 1% levels, respectively. Thus the conditional correlation between international crude oil returns and China’s energy returns can be considered to be time varying. Furthermore, the sum of these estimated coefficients is less than unity, confirming the persistent volatility of the conditional correlation.
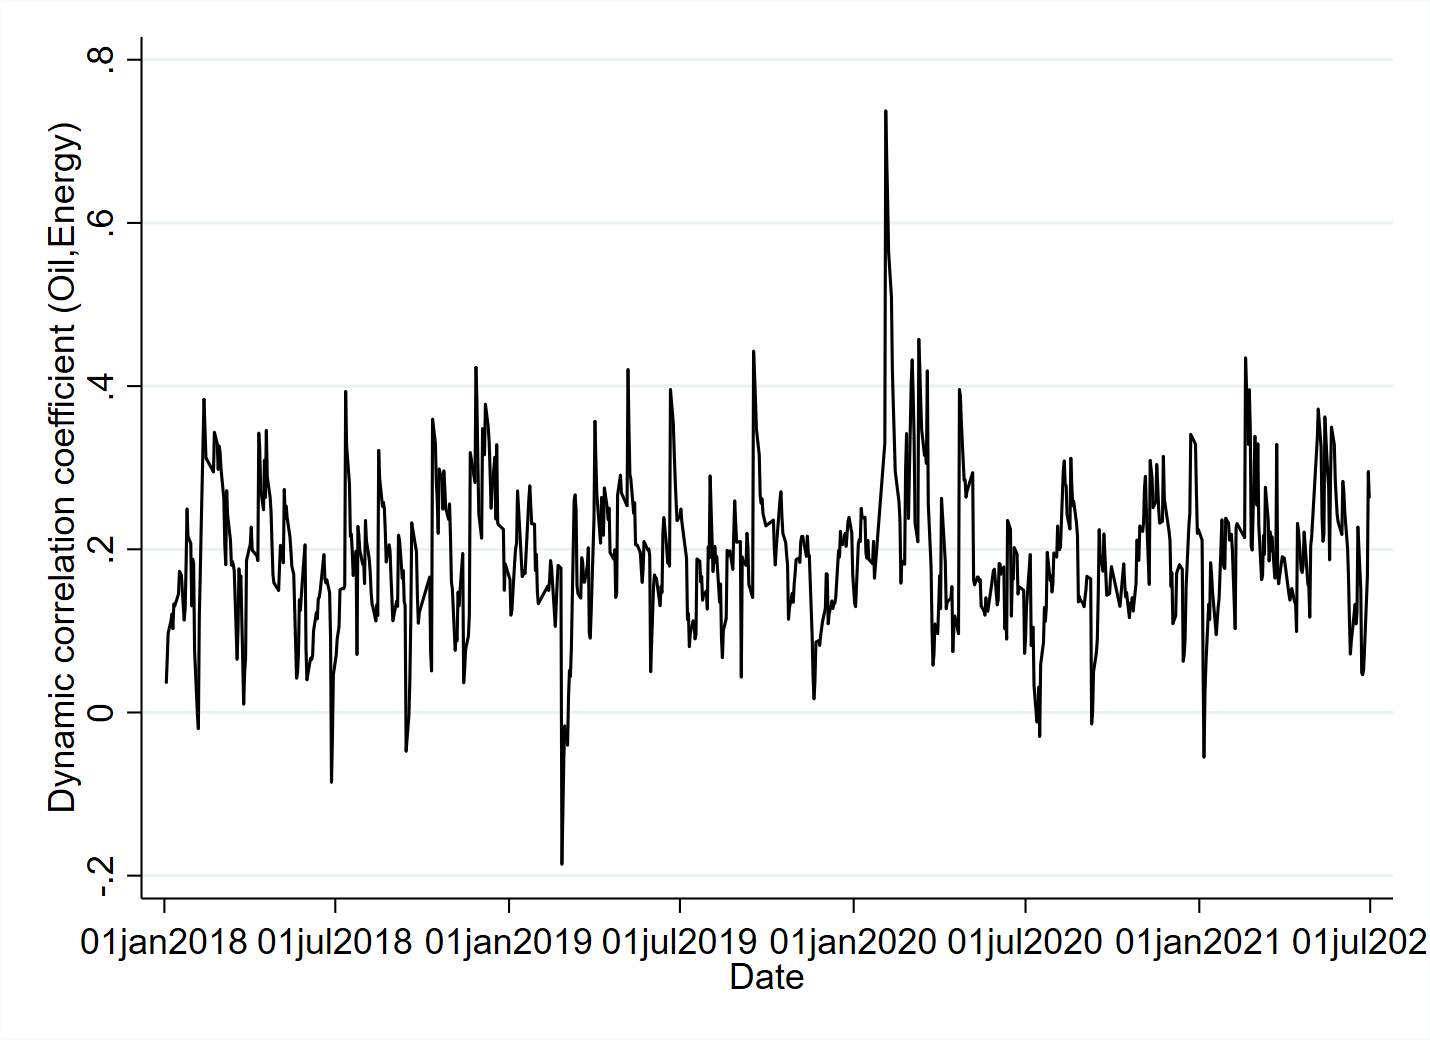
Figure 1 shows the dynamic correlation coefficient. As shown, the correlation between international crude oil returns and Chinese energy returns is volatile, with a largely positive dynamic correlation coefficient. The correlation weakens significantly in the first quarter of 2019; in contrast, it strengthens significantly in the first quarter of 2020, with a dynamic correlation coefficient of 0.7. These changes are due to the large shocks to the international oil market during those two periods.

IV. Conclusion
This paper empirically analyzes the spillover effects between international crude oil prices and Chinese energy stock prices, using a combination of a VAR model and a DCC-GARCH model. Our findings suggest that energy stock returns have a positive one-way mean spillover effect on changes in international crude oil prices. In addition, there is a significant and somewhat persistent time-varying correlation between Chinese new energy stock returns and international crude oil futures returns. To some extent, these findings indicate that the international crude oil market has a significant impact on the Chinese energy sector. Therefore, further improvements to the Chinese stock market are needed, and the government should strengthen the disclosure of information to avoid panic among retail investors during frequent oil price fluctuations.