
I. Introduction
COVID-19 has had a dramatic impact on international capital markets (Salisu & Vo, 2020; Yousaf & Ali, 2021; D. Zhang et al., 2020). This vast impact also includes disruption of the oil import market, which sharply lowered the price of crude oil on the international market, from US$58 on January 15, 2020, to US$20 on April 15, 2020.
With the growing complexity of the global economy and financial markets, the volatility of oil and stock markets can have greater consequences on the interaction between the global oil and financial markets (Bai & Koong, 2018). However, the severe global economic challenge posed by the COVID-19 pandemic has raised questions for oil-importing economies: will the breakdown in international oil prices have more serious consequences for their financial markets? Given the COVID-19 outbreak, it is necessary to reconsider traditional hypotheses and confirm what will be different during this turbulent period.
In their study on the impact of international crude oil prices on the return of energy stocks, Jin and Jin (2010) use a GARCH model and concluded that the international crude oil price has a significant positive impact on China’s natural gas and petroleum industry. Zhou and Guo (2014) use a Baba–Engle–Kraft–Kroner GARCH model and found the international crude oil market to have a one-way spillover effect on the Chinese stock market. However, the relations between markets are becoming increasingly complex, such that early studies cannot demonstrate dependence or volatility (Bekiros & Uddin, 2017), especially during the COVID-19 pandemic.
Current related research on COVID-19 focuses on the oil market and its impact on various economic factors (Kartal, 2020). Recent studies also focus on the relation between oil prices and the stock exchange (Narayan, 2021; Prabheesh et al., 2020; W. Zhang & Hamori, 2021). They show that the COVID-19 outbreak has altered the way oil connects to stock markets. Despite numerous studies, there is no consensus on the impact of COVID-19 on the relation between the oil and stock markets. Narayan (2021) estimate that the strength of the relation between oil prices and equity performance in the Japanese market decreased during the COVID-19 outbreak, although others conclude differently for the Asian market (Prabheesh et al., 2020). While energy market research in relation to the COVID-19 pandemic is also currently popular (Iyke, 2020; Narayan, 2021), it is also important to explore the effect of oil prices on energy stock prices during the pandemic.
We use WTI futures to measure WTI, which is the benchmark for international crude oil prices and has significant influence other markets (Bekiros & Diks, 2008). In addition, we analyze the stock market of China, which could well represent emerging economies (Liu et al., 2019).
Our results contribute to the literature in two ways. First, we supplement the literature on the impact of the COVID-19 pandemic from an energy market perspective (for an overview of these studies, see Narayan, 2021). Second, this study contributes to the research on the Chinese energy market. We examine the effect of international crude oil prices on Chinese energy stock prices during the COVID-19 pandemic and conclude that COVID-19 significantly reinforces their correlation.
The remainder of the article is organized as follows. Section II describes the data. Section III presents the methodology and results. Section IV draws our conclusions.
II. Data
A. Sample
We use the forward price of West Texas Intermediate (WTI) to measure the price of crude oil and collect daily performance data on the Shenzhen Exchange’s energy index. The data cover the period between January 1, 2019, and December 31, 2020.[1] The missing data are interpolated, for a total of 484 observations over a total of 487 trading days. The WTI data are from the US Energy Information Administration website, and the daily performance data for the energy index are from the China Stock Market & Accounting Research database. We use the logarithms of the data and specify two variables: the WTI future price return and the stock price index return, respectively, as follows:
rwtit=ln(wtitwtit−1)∗100
rindext=ln(indextindext−1)∗100
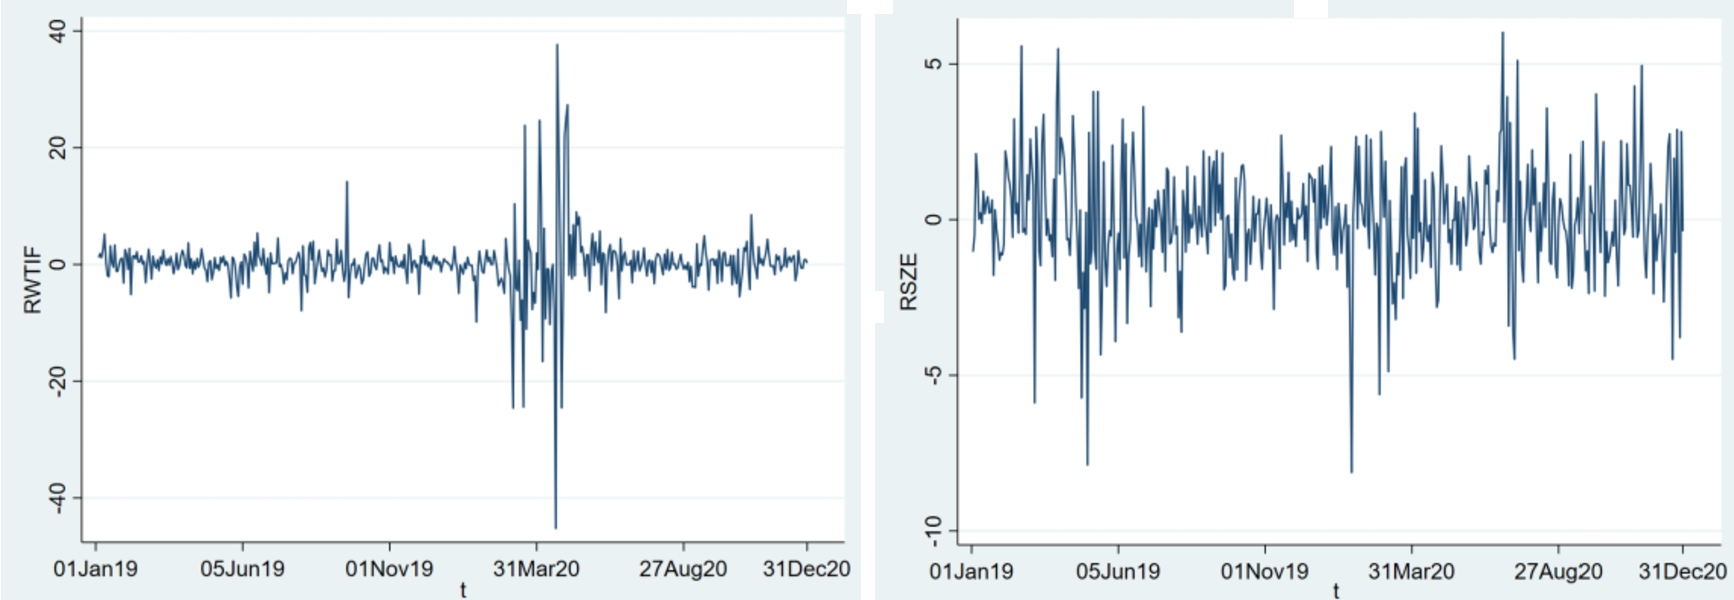
where is the daily rate of return of WTI oil futures prices and is the daily rate of return for the energy index, both in logarithmic form and multiplied by 100. In subsequent sections, the variable RWTIF is used to refer to the daily yield on the futures price of WTI oil, and the variable RSZ is used to refer to the daily energy index yield rate.
B. Descriptive Statistics
The following describes the baseline statistics of the time series. Figure 1 presents the basic features of the fluctuation in the rate of return of the time series. Regarding the time series of daily returns, we can see that both the WTI crude oil and energy stock price index returns are highly volatile, and the yield volatility of WTI crude oil futures is higher than that of the stock index. During the COVID-19 pandemic, the volatility of the WTI crude oil futures yield increased abnormally, whereas the stock performance index did not change as much.

III. Methodology and Empirical Results
A. DCC-GARCH Model
Engle (2002) proposes a dynamic conditional correlation (DCC) GARCH model based on previous models. This model assumes that the residual term of the rate of return series follows a normal distribution with a mean of zero, as well as a covariance matrix The complete DCC template can be formulated as follows:
Ht=(hij,t)=DtRtDt
Dt=diag(h1211t...h12NNt)
Rt=diag(q−1211,t...q−12NN,t)
Qt=(1−α−β)¯Q+αμt-1μ′t-1+βQt−1
qij,t=(1−α−β)¯qij+αμi,t-1μj,t-1+βqij,t-1
In the DCC-GARCH model, the conditional correlation coefficient is determined by the geometrically weighted average of standardized disturbances and changes over time. From the perspective of the model’s economic significance, the value of the dynamic correlation coefficient is
ρ12,t=αμ1,t−1μ2,t−1+βq12,t−1(1−α−β)¯q12√αμ21,t−1+βq11,t−1+(1−α−β)¯q11
The sum of the coefficients represents the persistence of the varying fluctuations. In the DCC-GARCH model, the DCC coefficient is a vital reference factor for measuring the existence of dynamic correlation among the variables. The higher the value of this coefficient, the stronger the dynamical correlation.
B. Test of Stationarity and the ARCH Effect
In this paper, we use an augmented Dickey–Fuller (ADF) test to test the time series. An ARCH effect for the sequence is also required to use the DCC-GARCH model, and we therefore use a Lagrange multiplier test to verify the ARCH effect. The results of the ADF test and the ARCH effect test of the RWTIF and RSZ sequences are presented in Panel A of Table 1.
The ADF test shows that the time series for WTI crude oil futures and the energy stock index are both stationary with an ARCH effect, indicating that the DCC-GARCH model is suitable for analyzing the dynamic correlation between these time series.
C. DCC-GARCH Analysis
We use the estimated parameters of the DCC-GARCH model to calculate the dynamic correlation coefficient between the return on WTI crude oil futures contracts and the energy inventory return index. Table 1 shows the estimated results. We can see that which indicates that the model is credible. The coefficients and are significant at the 5% and 1% significance levels, with values close to one, indicating that the dynamic correlation coefficient between the yields on the WTI crude oil futures and on the energy stock price index is highly influenced by the previous dynamic correlation coefficient, and the changes are more persistent. Panel B is a diagram of the dynamic correlation coefficient, showing the dynamic correlation between the WTI futures return and the return on the energy stock index.
Figure 2 illustrates the dynamic correlation coefficient between the WTI crude oil futures return and the return on the energy stock index. In most cases, the dynamic correlation coefficient is above the zero axis, with an average of 0.219, demonstrating a positive dynamic correlation between the yield on WTI crude oil futures and the yield on the stock price index under normal conditions. When the price of WTI futures increases, the energy stock index will outperform. However, the depth of the dynamic correlation coefficient intersects the zero axis and becomes negative to some extent, which shows that the dynamic correlation between WTI crude oil futures and the energy stock index is not completely stable. During the COVID-19 pandemic, this positive dynamic correlation fluctuated violently, and it rose rapidly at the beginning of February 2020. The dynamic correlation coefficient then surpassed 0.7, a high level that was maintained until late March, reflecting the significant impact of COVID-19 on the spillover effect between WTI crude oil futures and the energy stock index. This result also reflects the fact that oil-importing countries are vulnerable to the impact of global oil price volatility. As the domestic epidemic in China was gradually brought under control, the spillover effect of volatility gradually returned to normal levels around August 2020.
.png)
IV. Conclusions
This paper uses a DCC-GARCH model to investigate the effect of international crude oil futures price spillovers on the price of China’s energy shares. We find that the COVID-19 epidemic has exacerbated energy stock price volatility, which had a dramatic impact on China’s energy stock market at the beginning of the epidemic. However, this impact did not last as the domestic epidemic in China was brought under control.
Our findings offer practical value to governments and crude oil investors. Coping with black swan events such as the COVID-19 pandemic, governments can be proactive in preventing major risks from transferring from one market to other related markets, maintaining macroeconomic stability. On the other hand, investors should enhance their ability to judge and predict volatility in international crude oil prices and establish a reasonable investment portfolio to reduce the resulting investment risk.
Further development of this research is still required. Considering the impact of international oil price movements on the return of energy stocks, this paper addresses only the impact of WTI on the Chinese energy market, and the scale of the research is thus a quite weak. In addition, this paper takes into account only the impact of international oil prices and the energy stock market as a whole and does not fully consider many other potentially influential factors. This limitation can be improved by future studies.
Because the price of WTI futures became negative for the first time in history on April 20, 2020 (US$-37.63), we exclude it from the analysis.