
I. Introduction
The novel coronavirus (COVID-19) pandemic has exerted tremendous pressure on the global economy, especially for the stock market. For example, from February to March 2020, the U.S. and Japanese stock markets lost approximately 30% of their value (Takahashi & Yamada, 2021). Shehzad et al. (2020) document that the impact of COVID-19 on stock market volatility in the United States, Germany, and Italy is greater than that of the global financial crisis. In particular, the COVID-19 pandemic leads to strong negative sentiment, which affects the stock market (Iyke & Ho, 2021). The ongoing COVID-19 pandemic has resulted in an explosion of news coverage due to the swift propagation of information, thereby generating intense panic and increasing volatility in the equity markets (Haroon & Rizvi, 2020). More specifically, Sun et al. (2021) provide evidence that the negative effect of COVID-19 on stock markets cannot be explained by real losses, but, rather, by investor sentiment.
However, firms and sectors react to COVID-19 heterogeneously. COVID-19 has had negative effects on the traditional industries of China but has introduced opportunities to high-tech industries. More specifically, the transportation, mining, electricity and heating, and environment industries have suffered adverse effects from the pandemic, whereas the manufacturing, information technology, education, and health care industries have been resilient to the pandemic (He et al., 2020). Even in the oil-related industry, integrated and production firms have been strongly affected, compared to the services and equipment subsectors (Lv et al., 2020). The effect of COVID-19 on the energy sector could thus differ from the effect on the overall stock market.
However, while large studies have focused on the effect of COVID-19 on the overall stock market, its effect on the energy stock market has not been fully explored (Iyke, 2020). Energy, as a production factor, is crucial to economic development and social progress. Large energy firms suffered losses in stock value following the COVID-19 outbreak (Gerlagh et al., 2020). In particular, as energy prices fall, they exacerbate pessimistic investment sentiment volatility in the energy stock market (Lee et al., 2002), which is not conducive to rational resource allocation. Given the important role of energy in the economy and society, this paper focuses on the energy stock market and explores the relation between COVID-19 shocks and energy stock prices.
In line with Narayan, Iyke, and Sharma (2021), we employ a comprehensive measure of COVID-19 with five dimensions to capture the pandemic sentiment, namely, COVID-19, vaccines, medical progress, travel, and uncertainty. We also adopt the structural vector autoregressive (SVAR) model to examine the relation between the COVID-19 epidemic and the Chinese stock market and energy stock market. Using a sample of Chinese energy stocks between December 31, 2019, and April 28, 2021, this study demonstrates a negative relation between COVID-19 and energy stock prices. In particular, the negative COVID-19 sentiment captured by newspaper article is associated with a decline in energy stock prices. Moreover, the energy stock market has a linkage to the overall Chinese stock market.
This study contributes to the literature in several ways. First, we add to the growing stream of research that examines the economic consequences of COVID-19. Large studies document that COVID-19 has had adverse effects on business operations, investment, and financing, such as the increase in the cost of equity capital (Ke, 2021) and reductions in performance (Hu & Zhang, 2021). In this study, we focus on the stock market and provide evidence that COVID-19 has a negative effect on stock prices. In particular, we focus on the world’s largest emerging economy, China, which has experienced both the rapid spread and effective prevention and control of COVID-19.
Second, we contribute to studies related to the energy stock market. There is no consensus on the effect of COVID-19 on different sectors. Mugaloglu et al. (2021) state that structural shocks related to the global oil price, that is, brought on by COVID-19, have a weaker effect on oil and gas stock returns. However, Liu et al. (2020) explore the interactions between the COVID-19 pandemic and the crude oil and the stock markets and find that the COVID-19 pandemic has a significantly positive effect on crude oil returns and stock returns. More importantly, few studies directly examine the impact of COVID-19 on the energy stock market. In this study, we empirically test the relation between COVID-19 and energy stock prices and find a significant decrease in energy stock prices in response to COVID-19 pandemic shocks.
The remainder of this paper is organized as follows. Section II provides the data and methodology. Section III presents the empirical results, and Section IV concludes the paper.
II. Data and Methodology
A. Data and Variables
We obtain Chinese stock market indices and energy sector indices from the Shanghai Stock Exchange and Shenzhen Stock Exchange, and COVID-19 indices from Narayan, Iyke, and Sharma (2021). Our sample consists of 321 observations from December 31, 2019, to April 28, 2021.
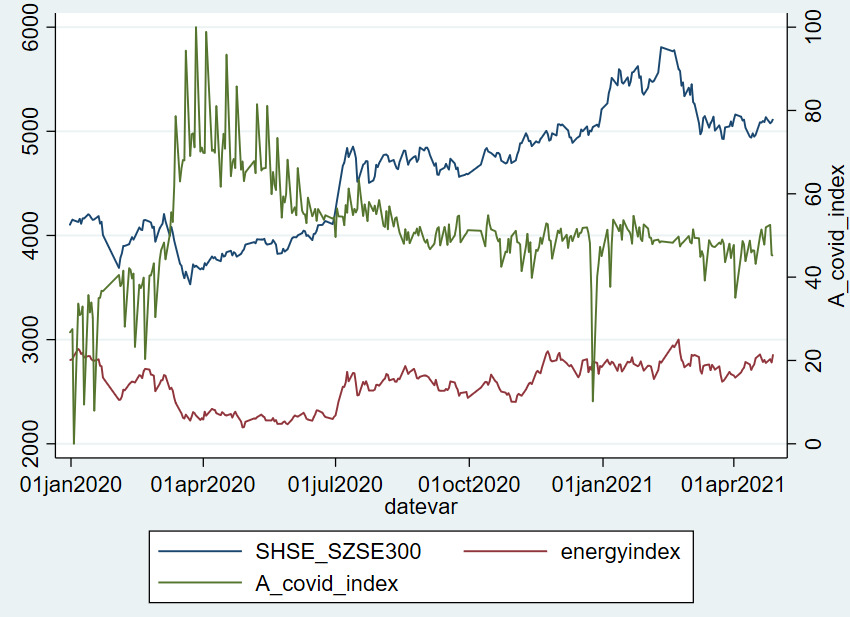
Specifically, we follow Narayan, Iyke, and Sharma (2021) and employ a composite measure, namely, A_COVID_Index, as the proxy for the COVID-19 index. The measure A_COVID Index is obtained by searching for keywords in international newspapers that best represent the ramifications of the COVID-19 pandemic, which consists of events related to COVID-19, vaccines, medical progress, travel, and uncertainty. Thus, A_COVID_Index captures the COVID-19 pandemic sentiment. Moreover, we employ the China Stock Index 300 (CSI300) from the Shanghai Stock Exchange and Shenzhen Stock Index and energy sector indices (Energy_Index) from the Shenzhen Stock Exchange.
B. Empirical Strategy
Figure 1 shows the time series plots of A_COVID_Index, CSI300, and Energy_Index. There is strong comovement between the Chinese stock market and the energy stock market, and we note that the trend of Energy_Index is opposite that of A_COVID_Index.
The SVAR model, which captures the structural relations of variables, is widely used to study the effect of shocks on stock markets. In line with Wei and Guo (2017) and Mugaloglu et al. (2021), we adopt the SVAR model to test the effect of COVID-19 on the energy stock market. The specification is as follows:
Yt=p∑i=1AiYt−i+Aut
AUt=Bԑt
where denotes a vector of three variables, including changes in A_COVID_Index, CSI300, and Energy_Index; is the unknown coefficient matrix to be estimated, and and are forecast errors and structural shocks for respectively.
Following Wei and Guo (2017), below, we assume that none of the variables are affected by the variables subsequently cited, whereas any given variable is affected by all the previously cited variables. In this study, we consider COVID-19 an exogenous shock. Moreover, the energy stock market reacts to COVID-19 and the stock market. Therefore, COVID-19 is ordered before the stock market, which is ordered before the energy stock market. Then the structural model with restrictions in the A and B matrices can be written as follows:
[100a2110a31a321][A_COVID_IndexCSI300Energy_index]=[b11000b22000b33][ԐA_Covid_IndexԐCSI300ԐEnergy_index]
A_COVID_Index=b11ԐA_COVID_Index
CSI300=−a21A_COVID_Index+b22ԐCSI300
Energy_index=−a31A_COVID_Index−a32CSI300+b33ԐEnergy_index
The main coefficient of interest is and a positive (negative) coefficient for indicates that COVID-19 has a negative (positive) effect on energy stock prices. Moreover, implies the effect of CSI300 on Energy_Index, and implies the effect of A_COVID_Index on CSI300. Given that the SVAR model requires all the variables to be stationary, we take the first-order difference of A_COVID_Index and CSI300.
III. Empirical Results
A. Variables and Descriptive Statistics
Table 1 summarizes descriptive statistics for all the variables. The variable A_COVID_Index has a mean of 51.434 and a standard deviation of 12.014, suggesting that the COVID-19 pandemic receives widespread media coverage. The variable dA_COVID_Index has a mean of 0.058 and a standard deviation of 8.182, further providing evidence that the COVID-19 epidemic changes greatly day by day. For China’s stock market, CSI300 has a mean of 4598.087 and a standard deviation of 563.718, and Energy_Index has a mean of 2578.002 and a standard deviation of 205.184. Compared to the overall stock market, the volatility of energy stock prices is relatively low.
B. Estimation Results
The lag order is important to determine in constructing the SVAR model. We select lagged rank by the fixed prediction error (FPE), the Akaike information criterion (AIC), the Hannan-Quinn information criterion (HQIC), and the Bayesian information criterion (SBIC). Given that the first-order lag is best, according to the HQIC and SBIC, and the fourth-order lag is best according to the FPE and the AIC, we adopt lags (1 to 4) that include both the first and fourth lags in the SVAR model.
Table 2 presents the results of the SVAR model examining the relation between the COVID-19 epidemic and the Chinese stock market and energy stock market. The coefficient of is positive and significant at the 5% level, indicating that COVID-19 has a negative effect on energy stock prices. Energy stock prices declined following the outbreak of COVID-19; the negative sentiment associated with the pandemic, such as the panic and anxiety report in newspaper reports, negatively influences the energy stock price. Moreover, the coefficient of is negative and significant at the 1% level, providing evidence of a linkage between the entire Chinese stock market and the energy stock market. Finally, we find that the coefficient of is positive but not significant, implying that, though COVID-19 has a negative effect on the overall stock market, it is not significant.
We further explore the relation between the COVID-19 epidemic, global oil prices, and the Chinese energy stock market. Following Mugaloglu et al. (2021), we employ Brent as the proxy for global oil prices. As shown in Table 3, the coefficient of is positive and significant at the 5% level, indicating that COVID-19 has a negative effect on energy stock prices, consistent with the results in Table 2.
IV. Conclusion
Drawing on a sample of Chinese energy stocks from December 31, 2019, to April 28, 2021, we empirically test the relation between the COVID-19 pandemic and energy stock prices. We use Narayan, Iyke, and Sharma’s (2021) database and employ a composite measure of COVID-19 articles in international newspapers. Using the SVAR model, we find that COVID-19 has a negative effect on energy stock prices, providing evidence that negative pandemic sentiment results in a decline in energy stock prices. We further find that the energy stock market has a positive linkage to the overall Chinese stock market. Finally, we find that COVID-19 has a negative but nonsignificant effect on China’s overall stock market.