I. Introduction
With the extensive penetration of information and communication technologies (ICT) in economic and social activities, the global economy is embracing a new round of the technological and industrial revolution. The industrial revolution brought about by ICT investment has led to prosperity and the development of a digital economy, and the new phenomenon of industrial digital transformation has emerged in the economy and society (Wang et al., 2021). The kinds of opportunities and challenges this revolution brings to the economy and society are important. Despite certain economic benefits and social dividends, the impact of industrial digital transformation on energy consumption and environmental sustainability remains uncertain (Wen et al., 2021).
In this study, we are interested in the relation between industrial digital transformation and energy intensity in China’s manufacturing sector. As the largest manufacturing country in the world, China is also the second largest country in terms of digital economy, with rich practices in the integration of digital technologies and manufacturing. Industrial digitalization—the increasing permeation of ICT or digital technologies throughout industrial economic activities—has significantly influenced the value chain of products and the role of energy factors in production (Škare & Soriano, 2021). In the process of digital transformation, lean production and agile manufacturing consume more energy. Moreover, the circulation of physical and market information needs support of high–energy consumption equipment. Besides, improvements in production efficiency can save energy, and digital technologies can be used to design sustainable products.
Our hypothesis is that the digitalization of the manufacturing sector has uncertain or nonlinear effects on energy intensity. The uncertain or nonlinear relation proposed in this study is primarily motivated by the research of Lange et al. (2020), who categorize the impact of digitalization on energy demand into four aspects: a direct effect, a scale effect, a technological effect, and a structural effect. Most studies claim that the direct and scale effects tend to increase energy demand, while the technological and structural effects decrease it (Ren et al., 2021).
This study employs a panel data set consisting of 25 two-digit coded industries in China’s manufacturing sector during the period from 2003 to 2019. We find that digital transformation increases the energy intensity in the manufacturing sector, but decreases it when digitalization reaches a higher level. This paper provides a measure of the digital transformation of China’s manufacturing sector and the full-caliber statistics of input–output indicators. We also contribute to the literature in the following two aspects. On the one hand, this study reveals the regularity of energy consumption for the manufacturing sector in the era of the digital economy. Manufacturing is the foundation of the modern economy and the most important sector from the energy demand point of view. Accordingly, related studies focus on regions (Ren et al., 2021) or other sectors (Noussan & Tagliapietra, 2020), whereas we focus on the manufacturing sector. On the other hand, our study proposes an inverted-U–shaped relation between industrial digitalization and energy intensity and finds that the digitalization of most industries in China’s manufacturing sector has not reached the inflection point. This finding implies that digital transformation will drive growth in energy demand, which is the challenge for sustainable development posed by the digital economy.
II. Measurement Results and Analysis
A. Measurement Method of Digitalization and Energy Intensity
The data contained in this study are full-caliber statistics, including data on enterprises above and below a designated size, respectively, according to the National Bureau of Statistics of China. This study uses the panel data of 25 subindustries in China’s manufacturing sector, adjusted to full-caliber statistics by using data from economic censuses (2004, 2008, 2013, and 2018) and China’s Industrial Statistical Yearbook.
In this paper, the World Input–Output Database (2000–2014) and the China Input–Output Table (2012, 2015, 2017, and 2018) are used to calculate the digital input of ICT equipment, ICT services, and audiovisual digital services in various manufacturing industries. Industrial digitalization is defined as the ratio of digital input to the number of employees, where the higher the value, the greater the degree of industrial digitalization. Energy intensity is defined as the ratio of energy consumption to industry value added.
B. Descriptive Analysis of Trends and Differences
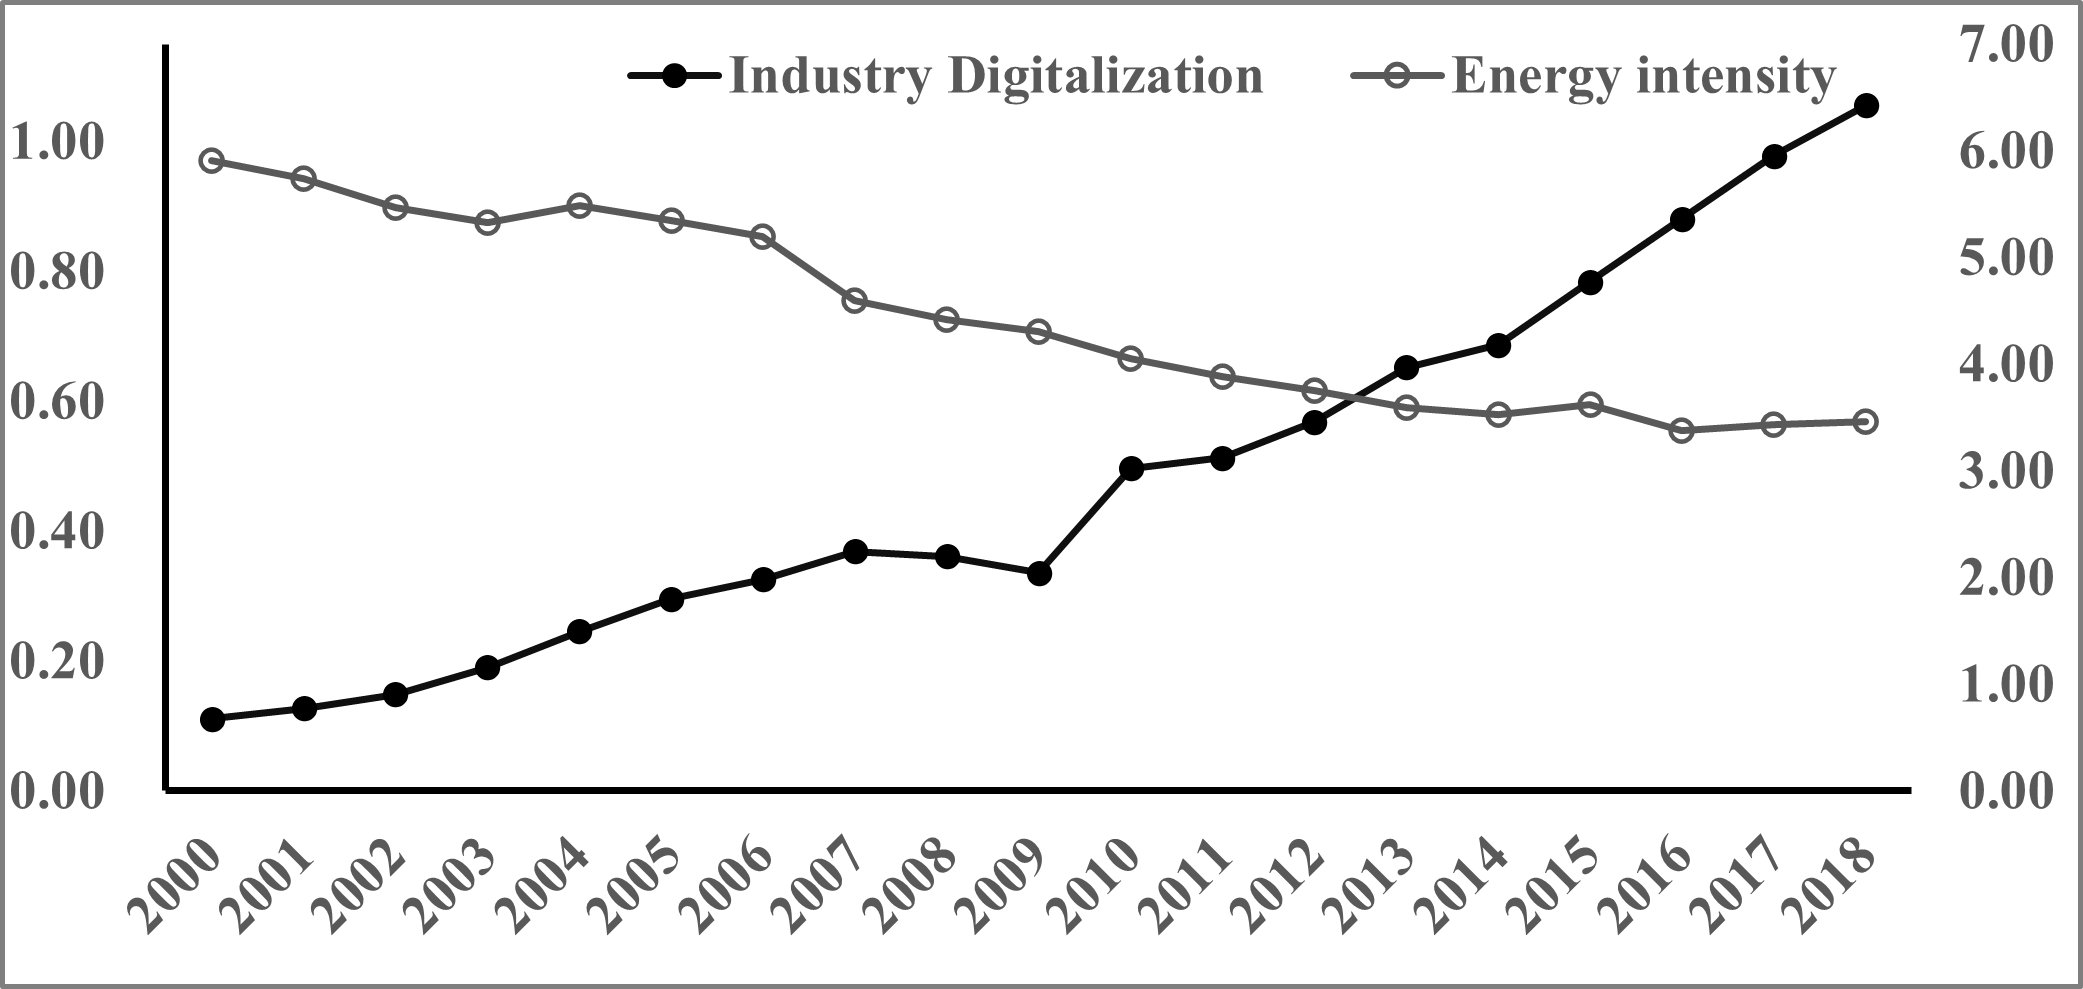
Figure 1 shows the trends of industrial digital transformation and energy intensity in China’s manufacturing sector. It shows that the manufacturing sector in China has been in the process of digital transformation over the past 20 years. The index of the digital transformation of the manufacturing industry increased from 0.111 in 2000 to 1.056 in 2018, an increase of nearly 8.5 times. The digital economy that has attracted wide attention in recent years is not a new economic form that suddenly appeared, but, rather, it has gradually formed over the past two decades. Conversely, the energy intensity of the manufacturing sector has been on a downward trend. It is easy to find that energy intensity is negatively correlated with industrial digitalization, as the empirical results of Ren et al. (2021) show.

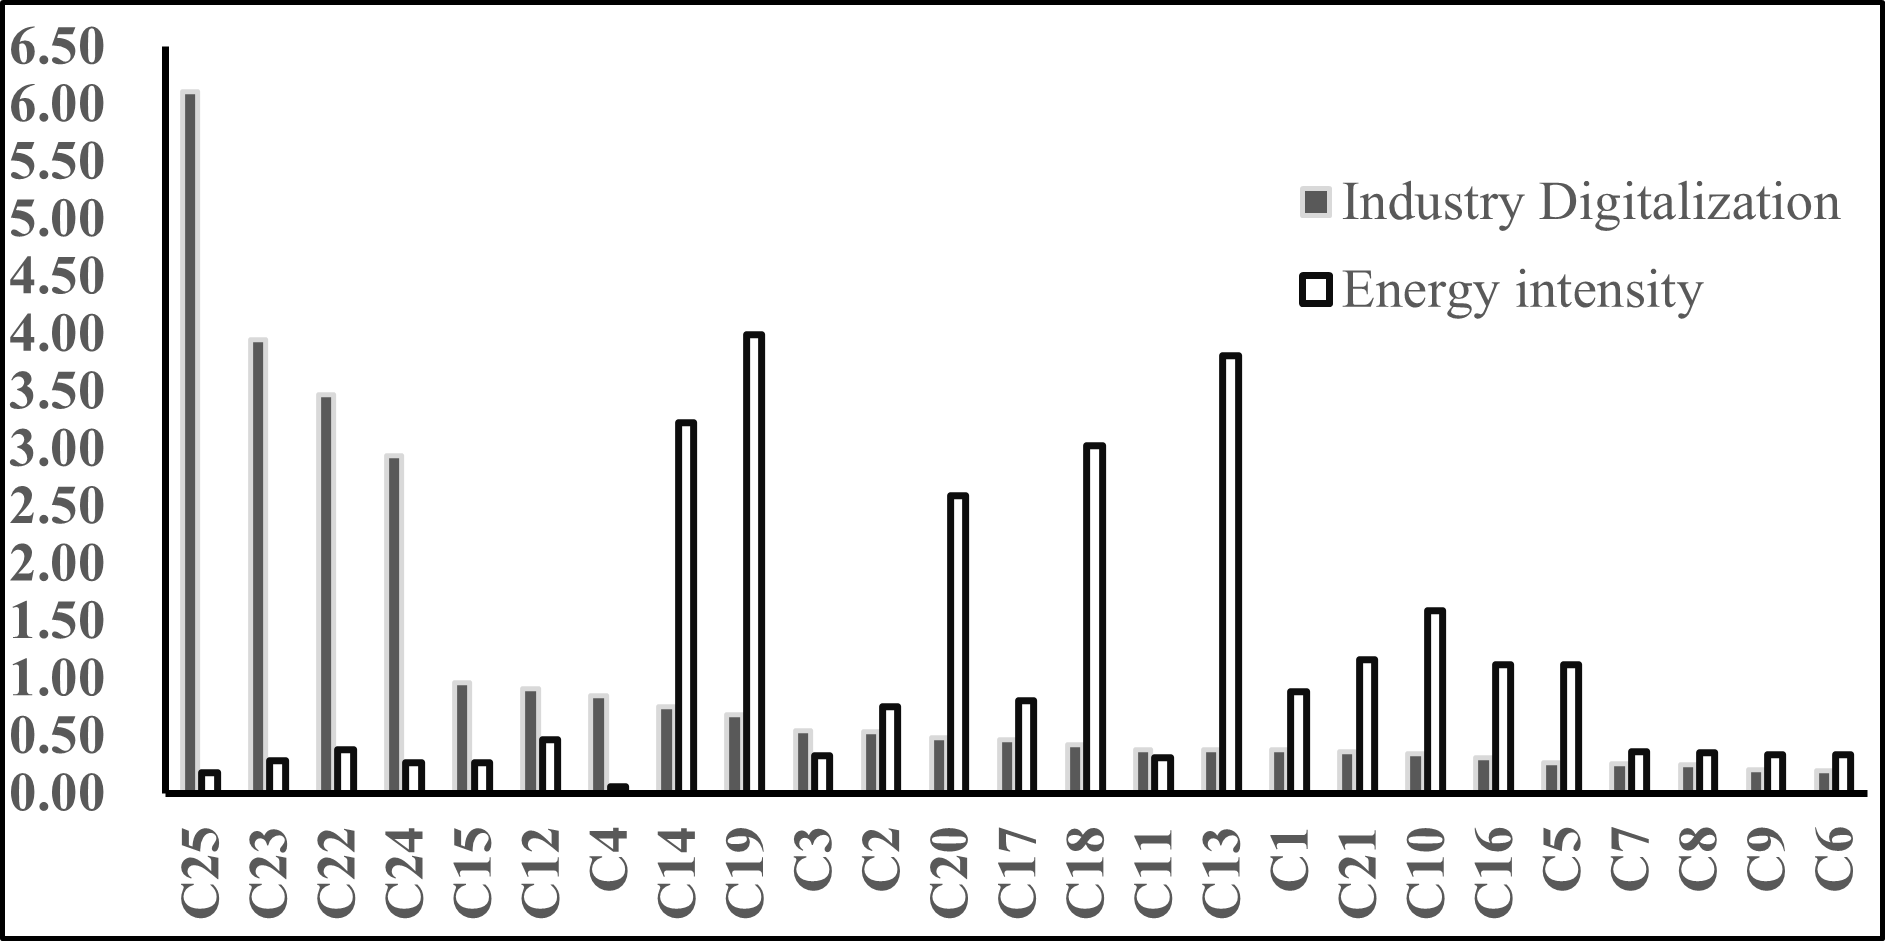
Figure 2 shows the industry differences in industrial digitalization and energy intensity in China’s manufacturing sector. It is also clear that digitalization is negatively correlated with energy intensity. However, this negative correlation does not imply causation, because industries with high levels of digital transformation are emerging industries with a low demand for energy. The differences in industry characteristics could be an important reason for the negative correlation.

III. Introduction of the Regression and Analysis of the Results
A. Data and Empirical Model
In this section, a panel regression model is used to identify the impact of digital transformation on energy intensity. The empirical model can be represented as follows:
EIit=α+β1Digitalit+β2Digital2it+Controlitγ+λi+Yeart+εit
where refers to the energy intensity of industry i in year t, which is defined as the proportion of energy consumption and industrial added value; is the digital transformation of the manufacturing industry and the core explanatory variables; and refers to the control variables for industry characteristics. We also control for industry fixed effects and year fixed effects Using Equation (1), we test the overall effect and the nonlinear relationship by reducing and increasing the quadratic terms of To capture the time continuity of the energy technology path, we also control for the dynamic lag term of energy intensity as a robustness test.
The control variables in this study include the industry market structure, the industry ownership structure, and the financing, technology, and factor endowment structure and other characteristics of manufacturing industries. The industry market structure is selected to represent the average size of enterprises in the industry (lnSize) and the profitability of the industry (Profit). The ownership structure is represented by the proportions of foreign-funded enterprises (FDI) and of state-owned enterprises (SOE), measured by the proportion of the net fixed assets of foreign enterprises and state-owned enterprises in the fixed assets of the industrial industry, respectively. Technology is measured by the logarithm of the number of industry patent applications (lnTech) and the logarithm of cross-border mergers and acquisitions (lnMA). Financing is measured by the average leverage ratio (Lev), and factor endowment is measured by the logarithm of the capital–labor ratio (lnKL).
Table 1 presents the descriptive statistics of the related variables, including a correlation analysis and a unit root test. The unit root test of Levin et al. (2002) shows that the variables covered in this study are all stationary or trend stationary, indicating no interference of pseudo-regression and that the panel regression can be used to test the relation as depicted in Equation (1). The correlation analysis shows that these variables are correlated with energy intensity. We see that industrial digitalization is negatively correlated with energy intensity.
B. Empirical results and analysis
Although energy intensity is negatively correlated with digitalization in terms of the time trend of the variables, industry variation, or the correlation between variables, it does not prove causality. Table 2 displays the results of the regression of energy intensity on industry digital transformation and provides more robust evidence of the causality. Columns (1) to (4) show the overall effect, while columns (5) to (8) show a nonlinear relationship.
The coefficients of Digital are significantly positive at the 5% level in columns (1) to (4), indicating that industrial digital transformation has led to an increase in the energy intensity of the manufacturing sector. Since only time effects and individual fixed effects are controlled for in column (1) of Table 2, digitalization increases energy intensity, even when considering various indirect effects. Columns (2) to (4) show that digitalization directly increases energy intensity. Columns (4) to (8) show an inverted-U–shaped relationship between energy intensity and digital transformation, especially for direct effects. Machines and equipment embedded with physical information or market information processing capacity need to consume energy, inducing the development of the manufacturing industry and energy consumption. However, the higher development of digitalization induces an energy-saving effect and sustainability dividends of digital transformation. By 2019, only four industries had reached the tipping point of digitalization, including general purpose machinery, special purpose machinery, transportation equipment, and electrical machinery and apparatuses.
IV. Conclusion
The economy and society are undergoing digital transformation (or digitalization), and the digital economy is playing an increasingly important role in the global economy. Using full-caliber statistical data and a panel regression model for 25 industries in China’s manufacturing sector during the period from 2003 to 2019, this study finds that industrial digital transformation has significantly increased the energy intensity of the manufacturing sector. We suggest that the negative correlations observed in time trends and cross-sectional negative correlations are misleading. In addition, the relation between energy intensity and digital transformation has an inverted-U shape, but the degree of digital development of most industries in China has not yet reached the inflection point. In the era of the digital economy, China still faces the challenge of increasing energy demand due to the digital transformation of manufacturing industries.
Funding
Project supported by Youth Program of National Social Science Foundation of China (grant no. 20CJY031).
Declaration of Interest
The authors declare that they have no conflict of interest.