
I. Introduction
Mitigating climate change and achieving carbon neutrality are common goals and challenges of the world today. Therefore, breakthrough low-carbon technology innovation has attracted great attention (Bongers, 2020). Carbon capture and storage (CCS) is a technology for capturing carbon dioxide from the atmosphere, for either production or permanent storage, and it is considered key technology for achieving near-zero emissions (Kang et al., 2021). Academic research has therefore been paying increasing attention to CCS technology. Some scholars focus on the effects of the emission reduction of the CCS technology and affirm its emission reduction potential (International Energy Agency, 2016; Zhu et al., 2015). Some discuss the development path and technology diffusion of CCS technology (Bae et al., 2020; Míguez et al., 2020). Other research has focused on the characteristics of transnational cooperation in CCS technology (Yin et al., 2020).
Despite the level of interest, few studies have examined the developmental stages of global CCS technology from a life cycle perspective. A dynamic technology growth curve model is used to describe the development of technology, also called the S-curve model (Nieto et al., 1998). The S-curve model can judge the current development stage of the technology and predict the time required to reach the saturation state. It is often applied to technology development research and is an appropriate method for investigating the growth curve and predicting emerging technologies (Bengisu & Nekhili, 2006).
The contribution of this paper lies in its empirical research and prediction of the development stage of global CCS technology based on the S-curve model, as well as its comparative analysis at the national level. It thus expands research that has only focused on the status quo of technology development and emission reduction effects. Our study enriches CCS technology development theory, to provide guidance in global CCS technology development and planning. Further studies will be able to build on the work in this paper.
II. Data and Methodology
A. S-Curve Model
The technology life cycle is a model of technology growth theory. Scholars often use two growth models to deduce the growth of technology: the Gompertz curve model and the logistic curve model (Ryu & Byeon, 2011). The main idea of these two growth curve models is to reflect the projection of technological evolution and predict the future based on historical data.
This paper considers that CCS technology is in the growth stage of its life cycle. To avoid a fitting curve with a large slope and cause errors in the simulation results for the technology growth period, the logistic model is selected for empirical fitting. The logistic model is representative of a symmetric growth curve and is consistent with the Fisher–Pry curve in terms of mathematical expression, which is as follows:
y=L1+α⋅exp−βt
The S-curve model assumes that the time series is the dependent variable. The model has three parameters: Y represents the cumulative characteristics of the technology, and this value is usually the cumulative number of technical patent applications or publications; represents the slope of the technology growth curve; and is the inflection point (also called the midpoint) of the S-curve, which represents the curve’s turning point and is also where the technology grows fastest. The S-curve is a symmetrical model about the inflection point. The variable L represents the saturation value of the technology’s growth (saturation), that is, the limit value of the cumulative characteristics of the technology. The parameters and determine the shape of the technology’s life cycle curve. If is defined as the growth stage of the technology, then a stage less than corresponds to the introductory period of the technology life cycle, and a stage greater than corresponds to the maturity and decline period of the technology life cycle.
B. Data Sources
This article uses the incoPat database to collect global patent data on CCS technology. The incoPat database covers the patent records of more than 100 countries. The CPC-Y02 system jointly promulgated by the European Patent Office and the United States Patent and Trademark Office defines the global low-carbon technology classification, with CPC-Y02C representing CCS technology (Pigato et al., 2020). The search term in this article is therefore (CPC = (Y02C)) AND (PD = [19000101 TO 20191231]). Based on the above search conditions, 70,694 global CCS technology-related patents were obtained for the period from 1900 to 2019. The CCS technology patent can be traced back to 1914 at the earliest. The number of patents from 1900 to 1979 is very small. From 1980 to 1998, the number of patents continues to be small, with slow growth. The number of patents then rose rapidly and peaked from 1999 to 2013, remaining relatively stable from 2013 to 2019.
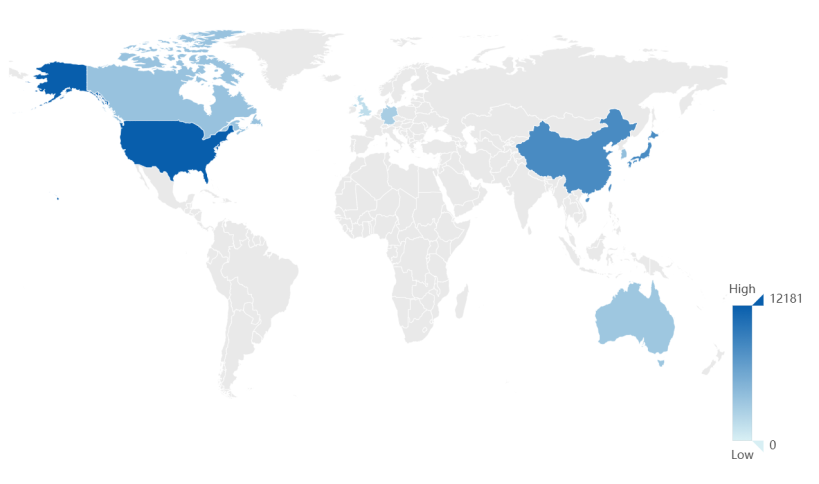
Figure 1 shows the global distribution of CCS technology patents by country. The United States has 12,181 CCS technology patents, accounting for 17.2% of the total, followed by China with 8,393 CCS technology patents, Japan with 8,342, South Korea with 4,016, Canada with 3,754, and Australia with 3,373. These six countries have a total of 40,059 CCS technology patents, accounting for about 56.6% of the total number of patents. The United States is currently the leader in the field of CCS technology, followed by Japan and China. Other countries have fewer patents for CCS technology, and their development of CCS technology needs to be improved.

III. Empirical Results
Loglet Lab software was developed by Rockefeller University in 1994 to fit the logistic curve model. Logistic curve simulation can examine the stage and evolution period of technology growth, the speed of technology growth, and the corresponding technology life cycle stage. The software uses an iterative method to estimate the parameters of the logistic model; that is, the saturation value L, the growth period and the inflection point/midpoint are all estimated by the software. In terms of loading data into the software, X is a time variable and Y is the cumulative amount of CCS technology patents publicly granted.
The software automatically fits the results, as shown in Table 1. The empirical results show that, from a global perspective, the growth period of CCS technology is 38.6 years, and the inflection point occurs in 2022; that is, the time point for the fastest growth in CCS patents is in 2022. The growth period of CCS technology is from 2003 to 2041, 1914 was the first year of CCS-related patents were granted, and, from 1914 to 2002, CCS technology was in a breakthrough period, which is the budding period of the technology life cycle. The number of patent applications at that stage grew slowly, and there were only a few firms in the field, with risky companies making technological breakthrough innovations. In the second stage, the rapid growth of CCS technology patents, from 2003 to 2041, the CCS technology officially adopted a new technological trajectory. In 2042 and beyond, the CCS technology track will begin to stabilize, and the leading technology design will be determined.
The growth curve demonstrates the development stage of global CCS technology. Are the development stages of CCS technology in different countries consistent with each other? As the leader of CCS technology, at what technological development stage is the United States? How is CCS technology developing in China? The content of this section is mainly based on these questions. The United States, Japan, China, South Korea, Canada, and Australia have the largest numbers of patents in the world. Based on the cumulative amount of CCS technology patents granted in these six countries, this paper uses an S-curve model and the empirical fitting of Loglet Lab to obtain the results, as shown in Table 1.
The fitting results are analyzed in combination in Table 1 and Figure 2. Specifically, China’s CCS technology only grew in the last 19.8 years, the fastest growth rate of the six countries; at the same time, the fitting chart shows that the development speed of CCS technology in China is faster than that of the other countries. Although the United States is still in the leading position in global CCS technology and its saturation value is far behind that of other countries, its development speed is not the fastest. The advantage of the United States is that it entered the market early and has a good foundation for technological innovation. According to the predictions of this study, China will enter the mature period of CCS technology in 2033 at the earliest, that is, the earliest to complete the leading design of the technology. In addition, South Korea’s CCS technology is also developing rapidly, with a growth period of 27.8 years, and is expected to enter the mature period of technology development in 2035. In contrast, Canada and Australia have longer periods of technological growth and enter the technological maturity stage relatively late. In addition, the initial stages of CCS technology in South Korea and China are relatively short, 25 years and 27 years, respectively. CCS technology was introduced late in these two countries, but their ability to digest and absorb technology and carry out independent research and development is strong.

IV. Conclusion
CCS technology is a key technology in alleviating climate change. At present, global surveys and comparative studies on the development stage of CCS technology are still lacking in academia. This article uses the S-curve model to empirically demonstrate the global CCS technology development stages and conduct a comparative analysis of various countries. The results show that global CCS technology is currently in the growth stage, the technological track will stabilize in 2042 and beyond, when the leading technology design will be formed. In addition, the empirical findings based on the CCS technology patent data in various countries show that the technological advantage of the United States lies in its early entry time and good foundation for technological innovation; China and South Korea have the fastest CCS technology development; and Korea, China, and Japan have undergone a relatively short embryonic stage.
Acknowledgement
This research was supported by the National Natural Science Foundation of China (grant numbers: 71704069). We would also like to thank the anonymous referee and Editor for their valuable comments in improving this study.