

I. Introduction
The total number of coronavirus disease 2019 (COVID-19) cases in the U.S. stood at more than 30 million as of April 2021 according to the Centers for Disease Control and Prevention.[1] This number corresponds with a substantial drop in U.S. economic activity as individuals voluntarily practiced social distancing to fight the COVID-19 pandemic. In addition, several layers of government in the U.S. have implemented stay-at-home orders starting from March 2020. The reduction in economic activity has resulted in higher unemployment rates and thus lower overall expenditure by individuals (see Curdia, 2020). Accordingly, demand for both crude oil and gasoline declined dramatically, whereas supply shocks due to OPEC disagreements starting from March 2020 have further contributed to turmoil in crude oil prices around the globe.
As gasoline is by far the most important form of energy consumed in the U.S., it is important from a consumer welfare point of view to understand gasoline price volatility. Since crude oil is the main input in the production of gasoline and its price is determined globally, investigating the implications of oil price changes on gasoline prices is essential to government policy, especially for financially vulnerable populations amid COVID-19.
Based on strong volatility in oil and gasoline prices due to the COVID-19 crisis, this paper investigates the pass-through of crude oil prices into U.S. gasoline spot and gasoline retail prices. This is achieved via a structural vector autoregression (SVAR) model, as introduced in such studies as Bernanke (1986) and Sims (1986), where weekly percentage changes of daily endogenous variables are used for crude oil prices, gasoline spot prices, and gasoline retail prices. Weekly percentage change in daily total number of COVID-19 cases in the U.S. serves as an exogenous variable in this framework.
This paper contributes to the literature in several dimensions. The main contribution is to consider COVID-19 case numbers as an exogenous variable, which helps identify oil price pass-through into gasoline prices due to the COVID-19 pandemic. Another contribution is use of daily data, as conditions have changed quickly, especially at the beginning of the COVID-19 pandemic. Finally, this paper contributes by measuring the pass-through of crude oil prices into gasoline prices through the cumulative impulse response of gasoline prices divided by the cumulative response of crude oil prices. Although this approach is similar to that used in such studies as Ha et al. (2020) in the context of exchange rate pass-through, and in H. Yilmazkuday (2019) in the context of oil price pass-through, to our knowledge, the present paper is the first to use it to investigate oil price pass-through into gasoline prices caused by the COVID‑19 pandemic.
The empirical results based on Brent crude oil price data provide evidence for complete pass-through of crude oil prices into gasoline spot prices. In particular, a 1% weekly increase in daily crude oil prices results in a 1.1% weekly increase in daily gasoline spot prices in the U.S. after 1 week, 1% after one month, and again 1% after 2 months. The results also suggest that the pass-through of oil prices into gasoline retail prices in the U.S. is incomplete, both in the short run and the long run. Specifically, a 1% weekly increase in daily crude oil prices results in a 0.15% weekly increase in daily gasoline retail prices after 1 week, 0.29% after one month, and again 0.29% after 2 months. The empirical results remain highly similar when West Texas Intermediate (WTI) crude oil price data are used.
These findings are in line with the literature, including Borenstein et al. (1997), who provide evidence for complete oil price pass-through into gasoline spot prices, and Meyler (2009), Blair et al. (2017), and H. Yilmazkuday (2019) who provide evidence for incomplete oil price pass-through into gasoline retail prices. However, differing from these studies, the present paper investigates oil price pass-through into gasoline prices caused by changes in the number of COVID-19 cases in the U.S. using data at daily frequency.
This paper proceeds as follows. Section II introduces the methodology and data set. Section III describes the empirical results. Finally, Section IV sets forth the conclusions.
II. Estimation Methodology and Data
The main objective is to estimate oil price pass-through into gasoline spot and gasoline retail prices. These pass-through measures are estimated via the SVAR model represented as based on daily data from the U.S., where represents percentage change in crude oil prices, represents percentage change in gasoline spot prices, and represents percentage change in gasoline retail prices.[2]
A. Estimation Methodology
In formal terms, the SVAR model is given by:
Aozt=a+7∑k=1Akzt−k+ΦΔct+ut
where the percentage change in daily total COVID-19 cases in the U.S., is included as an exogenous variable, and is the vector of serially and mutually uncorrelated structural innovations. For estimation purposes, the model is expressed in reduced form as follows:
zt=b+7∑k=1Bkzt−k+ΦΔct+et
where for all and The number of lags (of 7) is determined by minimizing the Deviance Information Criterion across alternative lags (between 1 and 14); details are given in Figure 1. The model variables are confirmed to be stable as none of the roots lie outside the unit circle. It is postulated that the structural impact multiplier matrix has a recursive structure such that the reduced-form errors can be decomposed according to where the sizes of shocks are standardized to unity (i.e., the identification is by triangular factorization).

The recursive structure imposed on requires an ordering of the variables used in the estimation; we use the one already given in In particular, crude oil prices are assumed to affect both gasoline spot and gasoline retail prices contemporaneously, and gasoline spot prices are assumed to affect gasoline retail prices contemporaneously, whereas gasoline retail prices cannot affect gasoline spot prices contemporaneously. The motivation behind this ordering comes from crude oil prices being determined globally, while gasoline spot and gasoline retail prices are determined within the U.S., as suggested in Borenstein et al. (1997). Similarly, gasoline spot prices are determined nationwide in the U.S., whereas retail prices are determined based on several other factors, including refinery-related costs, local taxes, and local distribution costs (see D. Yilmazkuday & Yilmazkuday, 2016, 2019; H. Yilmazkuday, 2017). Block exogeneity is used to ensure that neither gasoline spot prices nor gasoline retail prices can affect crude oil prices at any time following a shock, since crude oil prices are determined globally.
The estimation is achieved via a Bayesian approach with independent normal-Wishart priors. This corresponds to generating posterior draws for the structural model parameters by transforming each reduced-form posterior draw. In particular, for each draw of the covariance matrix from its posterior distribution, the corresponding posterior draw for is constructed using triangular factorization so that the sizes of shocks are standardized to unity. In the Bayesian framework, a total of 2,000 samples are drawn, where a burn-in sample of 1,000 draws is discarded. The remaining 1,000 draws are used to determine the structural impulse responses necessary for estimating oil price pass-through into gasoline spot and retail prices.
B. Data
For crude oil prices (to construct daily series of Brent spot price measured in US dollars. In robustness tests, the West Texas Intermediate spot price (in US dollars) is used. Daily gasoline spot prices (to construct are proxied with the New York Harbor Conventional Gasoline Regular Spot Price (freight on board, measured in dollars per gallon). All data are obtained from the U.S. Energy Information Administration. Daily gasoline retail prices (to construct are proxied by the “Regular Unleaded Gas Prices” obtained from http://fuelinsights.gasbuddy.com/. Daily total cases of COVID-19 in the U.S. (to construct are obtained from the web page of Opportunity Insights Economic Tracker.[3]
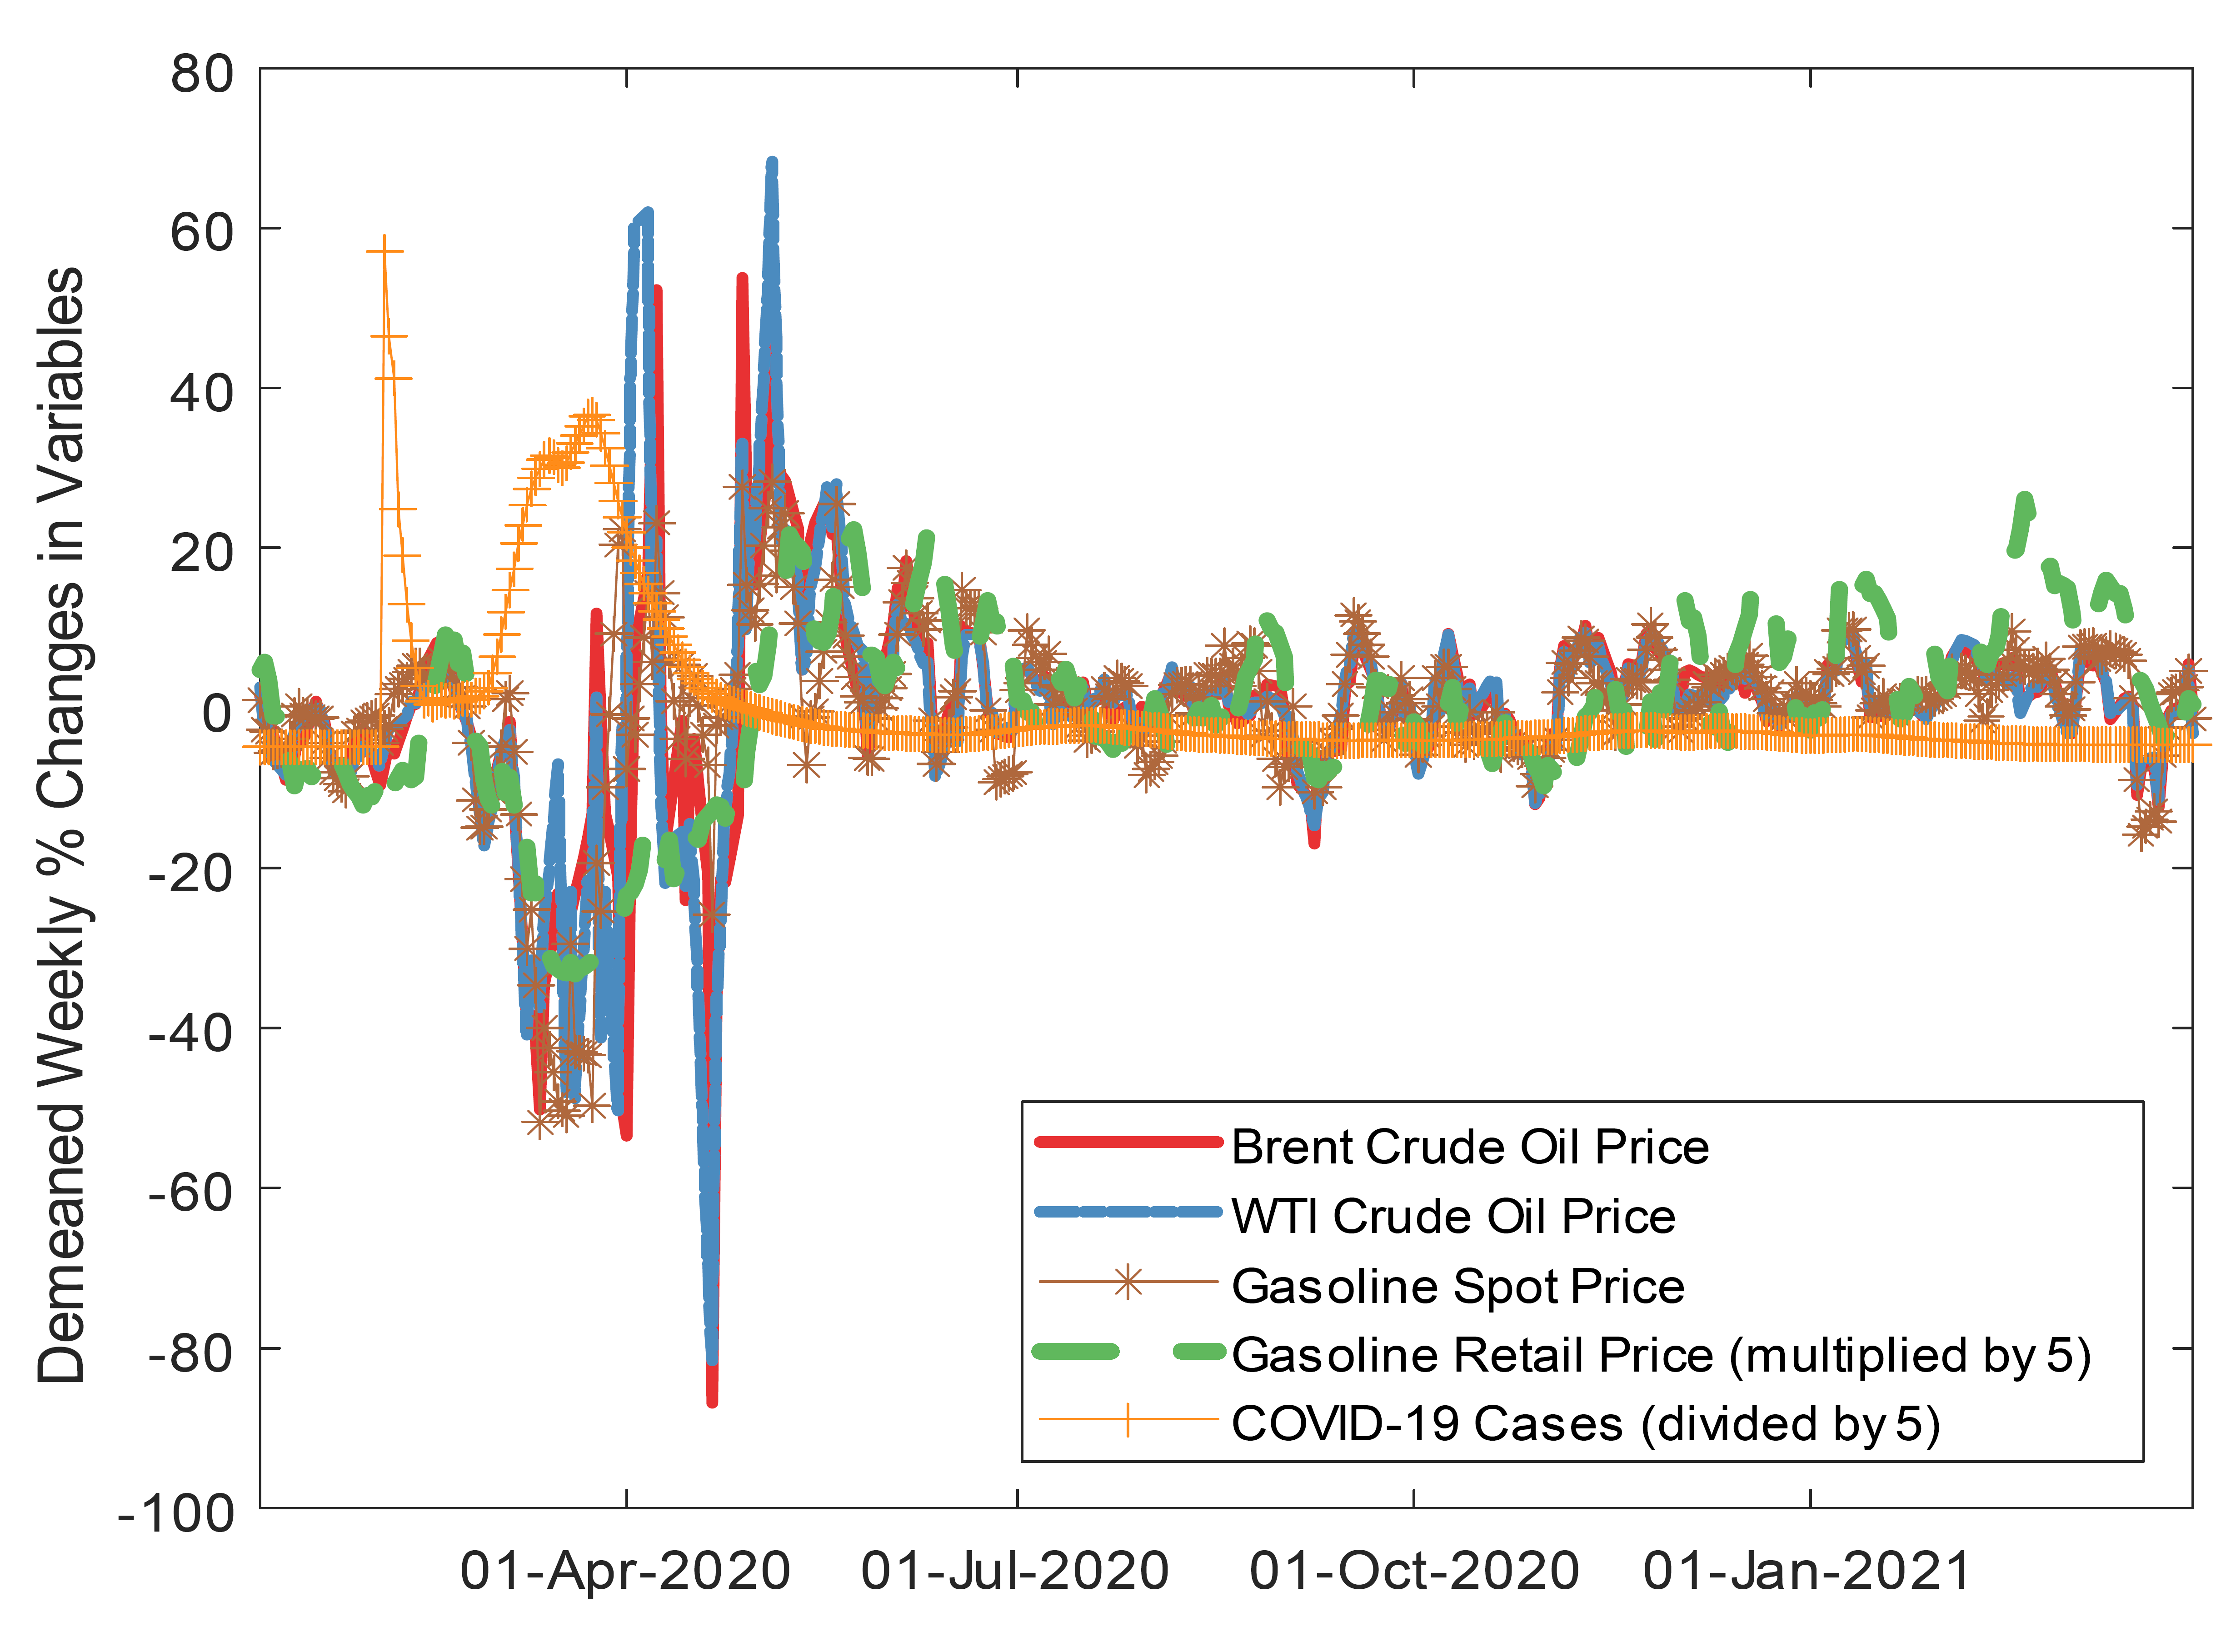
The sample covers the daily period December 31, 2019 to March 31, 2021. All daily series are converted into weekly percentage changes (by taking their log difference) so that they are robust to any seasonality concern by construction. The corresponding series that enter the estimation are given in Figure 2, where crude oil prices and gasoline prices are highly correlated. The increase in COVID-19 cases in the U.S. is negatively correlated with other series, especially during March 2020.

C. Measurement of Pass-Through
Oil price pass-through into gasoline spot prices (denoted by is defined as the ratio of the cumulative impulse of gasoline spot prices divided by the cumulative response of oil prices:
PS=Cumulative Response of Gasoline Spot PricesCumulative Response of Oil Prices(3)
which can be calculated for any period after the shock. Similarly, oil price pass-through into gasoline retail prices (denoted by is defined as the ratio of the cumulative impulse of gasoline retail prices divided by the cumulative response of oil prices:
PR=Cumulative Response of Gasoline Retail PricesCumulative Response of Oil Prices(4)
This approach (of using ratios of cumulative responses) is similar to those in studies such as H. Yilmazkuday (2019), and Ha et al. (2020), who estimate exchange rate (or oil price) pass-through measures using the cumulative response of consumer prices (or gasoline prices) divided by the cumulative response of exchange rate (or oil prices), both following a common shock.
III. Estimation Results
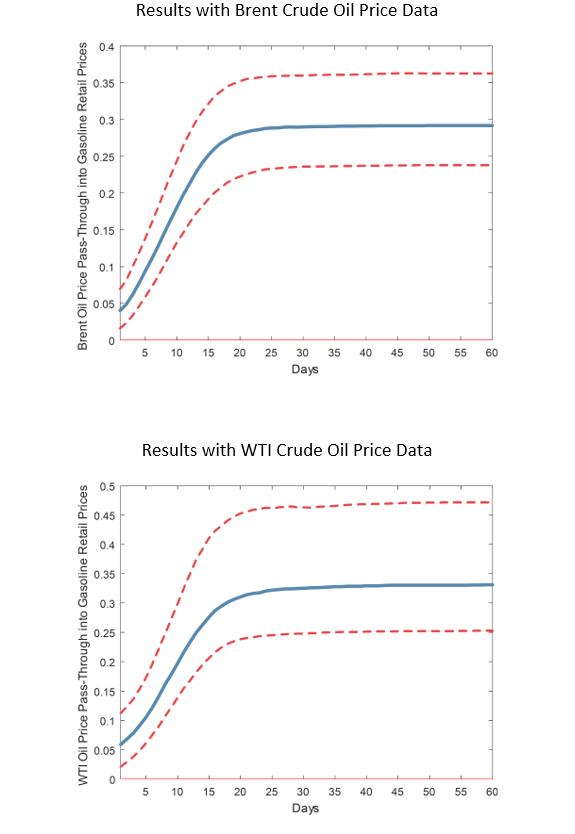
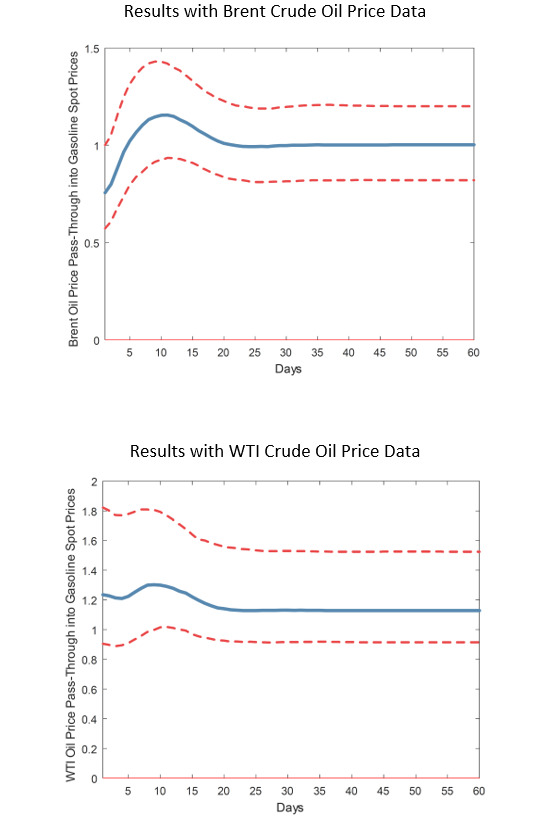
In the Bayesian estimation, the right-hand sides of Equations 3 and 4 are calculated for each of the 1,000 draws. While the median of each distribution is considered the Bayesian estimator of oil price pass-through, the 16th and 84th quantiles of distributions are used to construct the credible interval (which is the standard credible interval considered in the Bayesian literature). The corresponding oil price pass-through estimates are given in Table 1 as point estimates, and the corresponding continuous estimates are given in Figures 3 and 4.

Based on the empirical framework, it is expected that crude oil prices affect gasoline spot prices and gasoline retail prices positively (i.e., positive pass-through measures of and are expected). The main reason behind this expectation is that crude oil is the main input used in the production of gasoline. Despite this well-known expectation, the main objective here is to measure the magnitude of the positive effect that crude oil prices have on gasoline spot prices and gasoline retail prices. As it may take a period of time for the effects of crude oil prices to appear in gasoline spot prices and gasoline retail prices (e.g., due to price stickiness as in Davis & Hamilton (2004)), we consider alternative horizons following changes in the number of COVID-19 cases.
According to Table 1, when “Brent Spot Price FOB (Dollars per Barrel)” is used as a measure of crude oil prices, is 1.1 after 1 week, about 1 after 1 month, and about 1 after 2 months. Considering the way the data series is constructed, these numbers suggest that a 1% weekly increase in daily crude oil prices results in a 1.1% weekly increase in daily gasoline spot prices after 1 week, about a 1% weekly increase in daily gasoline spot prices after 1 month, and about a 1% weekly increase in daily gasoline spot prices after 2 months. Therefore, based on the corresponding credible intervals, there is evidence for complete pass-through of oil prices into gasoline spot prices in the long run. It is important to emphasize that all results are based on percentage change in U.S. COVID-19 cases according to Equation 3.
In addition, according to Table 1, is 0.15 after 1 week, 0.29 after 1 month, and again 0.29 after 2 months. Considering the way the data series is constructed, these numbers suggest that a 1% weekly increase in daily crude oil prices results in a 0.15% weekly increase in daily gasoline retail prices after 1 week, a 0.29% weekly increase in daily gasoline retail prices after 1 month, and a 0.29% weekly increase in daily gasoline retail prices after 2 months. Therefore, based on the corresponding credible intervals, there is evidence for incomplete pass-through of oil prices into gasoline retail prices, both in the short run and the long run. These results are based on percentage change in U.S. COVID-19 cases according to Equation 4.
Note from Table 1 and Figures 3 and 4 that the results remain highly similar when “Cushing, OK WTI Spot Price FOB (Dollars per Barrel)” is used as the measure of crude oil prices. These estimates are in line with the literature, including Borenstein et al. (1997), who provide evidence for complete oil price pass-through into gasoline spot prices, and Meyler (2009), Blair et al. (2017), and H. Yilmazkuday (2019), who show evidence for incomplete oil price pass-through into gasoline retail prices. However, differing from these studies, the present paper investigates oil price pass-through into gasoline prices caused by change in the number of COVID-19 cases in the U.S. using data at daily frequency.
IV. Conclusion and Policy Implications
The COVID-19 pandemic has acted as both a negative supply and a negative demand shock on economic activity. Based on a structural vector autoregression model, this paper investigates the corresponding implications on crude oil price pass-through into gasoline spot and gasoline retail prices in the U.S. using daily data. Oil price pass-through is measured as the cumulative impulse response of gasoline spot or retail prices divided by the cumulative impulse response of oil prices.
The results suggest evidence for complete pass-through of oil prices into gasoline spot prices in the long run. In particular, a weekly increase in daily crude oil prices results in a weekly increase in daily gasoline spot prices in the U.S. after 1 week, about after 1 month, and again about after 2 months. The results also suggest that pass-through of oil prices into gasoline retail prices in the U.S. is incomplete, both in the short run and the long run. Specifically, a weekly increase in daily crude oil prices results in a weekly increase in daily gasoline retail prices after 1 week, a weekly increase in daily gasoline retail prices after 1 month, and again a weekly increase in daily gasoline retail prices after 2 months.
As gasoline is by far the most important form of energy consumed in the U.S., the results have several policy implications regarding consumer welfare. In particular, decreased crude oil prices in the early period of the COVID-19 pandemic (April 2020) was partly reflected in lower gasoline retail prices, supporting household budgets in financially vulnerable populations. However, as crude oil prices began increasing significantly after April 2020, policy makers could protect financially vulnerable populations by providing longer unemployment assistance, more direct deposits through COVID-19 stimulus packages or higher tax breaks regarding gasoline consumption.
Acknowledgements
The author thanks the editorial team and an anonymous referee for their helpful comments and suggestions. The usual disclaimer applies.
This information is obtained from https://covid.cdc.gov/covid-data-tracker/#cases_totalcases.
Percentage changes are used to ensure that no root lies outside the unit circle. Accordingly, the estimated SVAR model satisfies the stability condition.
The web page address is https://www.tracktherecovery.org/.