
I. Introduction
One of the climate policy measures discussed in the European green deal is a Carbon Border Adjustment Mechanism (CBAM) (European Commission [EC], 2019). The CBAM is aimed at protecting domestic industries, creating incentives for other countries to adopt carbon taxes, avoiding carbon leakage, and limiting the reallocation of the EU-based industries to countries with less stringent climate regulations. Compatibility of the CBAM with the World Trade Organization rules could be considered as one of the key obstacles (Krenek et al., 2020). However, if introduced, this policy measure could have sizeable economic implications for the EU trading partners. Literature suggests that while border carbon adjustment can effectively reduce leakage and protect domestic producers, its main effect is the shift of the emission reduction burden to non-abating countries (Babiker & Rutherford, 2005; Böhringer et al., 2012).
Governments of many EU trading partners have raised concerns about possible implications of the CBAM for their economies. Several recent studies have provided an assessment of the CBAM, though mostly focusing on the economic and environmental impacts for the EU (Chen et al., 2020; Krenek et al., 2020; Kuusi et al., 2020).
Ukraine, a country with less stringent climate regulations than the EU, could face adverse impacts of the CBAM implementation. As of 2019, the EU accounted for over 41% of Ukraine’s total commodity exports, including energy-intensive goods such as metals, mineral products and aluminum (State Statistics Service of Ukraine [SSSU], 2020). These trade patterns make the Ukrainian exporters especially vulnerable to the CBAM implementation.
In this paper, we explore how potential imposition of the CBAM could impact Ukraine’s producers and consumers. We also extend our analysis to the other EU trading partners. The rest of the paper is organized as follows. Section II discusses the methodological framework. Section III provides an overview of the Ukraine-EU trade patterns. Section IV discusses policy scenarios and provides an overview of the CBAM impacts on Ukraine. Section V provides an assessment of the CBAM policies for other EU trading partners. Finally, Section VI concludes.
II. Methodology
To provide an assessment of the possible implications of the EU CBAM on Ukraine, we rely on the computable general equilibrium (CGE) model, namely the GTAP-E (McDougal & Golub, 2007) and the Global Trade Analysis Project (GTAP) 10 Data Base (Aguiar et al., 2019). The GTAP 10 Data Base represents a snapshot of the world economy for 121 countries and 20 aggregate regions for the 2014 reference year, while the economy of each region is represented by 65 sectors. All regions in the GTAP Data Base are linked with bilateral trade flows, including trade in goods and services. The GTAP-E, on the other hand, is a static multi-region CGE model, which incorporates carbon accounting framework. For the current analysis, we aggregate data to the 20 countries/regions and 22 sectors.[1]
To provide an accounting of the CO2 emissions embodied into bilateral trade,[2] we follow an approach outlined in Peters (2008): country-specific CO2 emissions per unit of output by sector are used to estimate emissions associated with bilateral trade flows. For every commodity, total CO2 emissions associated with fossil-fuels combustion and embodied in trade flows from region to region are estimated as:
frs=Fr(E−Ar)−1ers,
where is a vector of region-specific CO2 emissions per unit of output by industries; is an identity matrix; is the technological matrix, which represents the industry requirements of domestically produced products in region and corresponds to the bilateral trade flow from region to region
III. Overview of the EU-Ukraine trade
For the CBAM impact assessment, we assume that sectors covered by the EU emissions trading system (ETS) are those that face the tax. In 2014, Ukraine exported over US$5.6 billion of commodities corresponding to the EU ETS sectors. Around 70% of this value (US$4.0 billion) corresponds to exports of ferrous metals, which constitute over 20% of total domestic metals production. Chemical products are the second largest category of Ukraine’s exports to the EU (valued at US$0.9 billion).
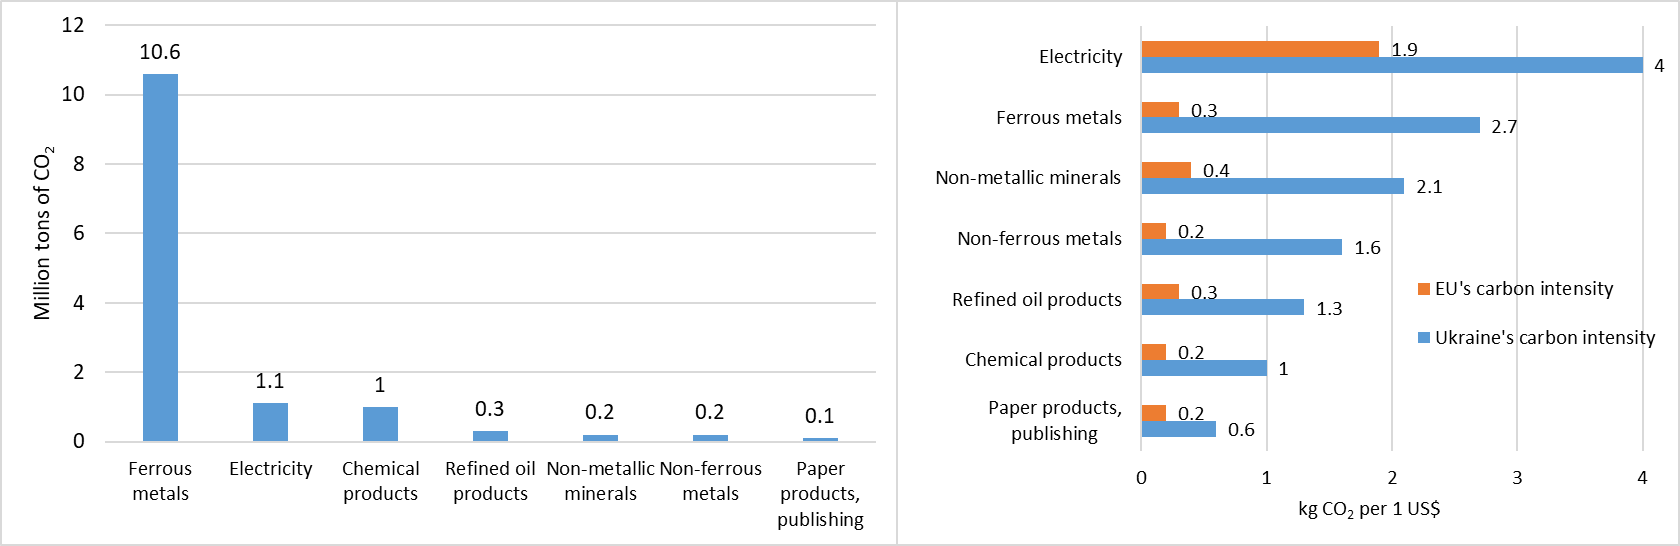
In terms of emissions embodied into exports, ferrous metals represent by far the largest group (Figure 1). Although the value of electricity exports is the lowest among analyzed commodity groups, due to the high carbon intensity of electricity generation, it is the second largest commodity group in terms of emissions embodied into Ukraine’s exports to the EU.

Due to the differences in technologies and composition of the analyzed commodity groups in Ukraine and the EU, carbon intensities of production significantly differ between these two regions. While in the case of electricity, Ukraine’s carbon intensity is only twice higher than in the EU, in the case of ferrous metals the difference is ninefold, with Ukraine’s production being more carbon intensive. Depending on whether Ukraine’s or EU’s carbon intensity is used for the CBAM, corresponding ad valorem equivalent rates would largely vary. We consider both these options in the paper.
IV. Policy scenarios and CBAM impacts on Ukraine
For the CBAM policy assessment, we assume that the EU imposes tax on imports from all countries and regions. The only exceptions are the UK and the European Free Trade Association (EFTA) countries, which do not impose or face the CBAM. The tax is imposed in the form of an ad valorem equivalent on imports of commodities. To calculate the corresponding tax rate, the average ETS tax for 2019 was estimated and converted to the 2014-dollar value (equivalent to US$26/tCO2). The ad valorem equivalent import tax is estimated based on the emissions embodied into trade. We consider two options for the carbon content assessment: exporters and EU’s carbon content.
Depending on the choice of the carbon content option, corresponding import taxes vary significantly. The CBAM tax rates range from 1.5% (paper products) to 10.3% (electricity) under Ukraine’s (exporter’s) carbon intensity and from 0.4% (chemical and non-ferrous metals) to 5% (electricity) if EU’s carbon intensity is adopted. For the key sector of interest – ferrous metals – the CBAM tax is 6.6% under Ukraine’s carbon intensity and 0.7% under EU’s carbon content.
Modelling results suggest that on the trade side, electricity, ferrous metals, petroleum products and chemicals suffer the most (Figure 2). While in the case of electricity, total exports fall by up to 12%, this does not significantly impact electricity producers due to the low share of electricity exports in total output. On the contrary, in the case of ferrous metals, reduction in total exports of up to 5.1% translates to a 4% reduction in output under the Ukraine’s carbon content case.
_and_output_(b)_by_sectors.png)
Reduction in output in the energy intensive sectors are almost fully compensated by increasing output in other manufacturing activities that do not face CBAM (Figure 2). The magnitude of impacts is on average 5-6 times lower under the EU’s carbon content compared to Ukraine’s.
While exports of ferrous metals to the EU suffer substantially – a reduction of 25.8% under Ukraine’s carbon content case, a significant redirection of exports is observed. Exports of the ferrous metals increase by 2.2% to 4.4% to other countries. As a result, under the case of Ukraine’s carbon intensity, around 29% of exports lost to the EU are reallocated to other destinations.
In terms of macro implications of the CBAM, estimates suggest there are moderate negative impacts, as under Ukraine’s carbon intensity assumption, per capita income falls by around 0.4%, while reduction in aggregate welfare is US$450 million.[3] Even smaller negative impacts are observed under the EU’s carbon content assumption – a reduction in per capita income of 0.07% and aggregate welfare change of US$74 million. Following the CBAM implementation, CO2 emissions in Ukraine fell by 0.7%.
V. Implications of the CBAM for other EU trading partners
Our estimates suggest very limited negative impacts of the CBAM on the other EU trading partners. Aggregate income of most EU trading partners barely changes (variations within 0.05%), even if the EU trade partners’ carbon content is used as a base for the border tax (Table 1). In this context, Ukraine with a reduction in per capita income of 0.4% loses by far the most, followed by the rest of Europe (-0.35%).
At the sectoral level, chemical products and iron and steel are among the most impacted sectors. Apart from the reduction in iron and steel exports from Ukraine (-5.1%) and India (-5.9%), there are large reductions in exports of chemicals from Russia (-4.3%) and China (-1.3%), and electricity from the rest of Europe (-29.9%).
Unlike in the cases of global border carbon tax assessment with larger sectoral coverage (Böhringer et al., 2012), we find limited negative impacts on large energy exporters. First, production of the primary fossil fuels is not covered by the EU ETS and thus does not face the CBAM under our assessment. Second, the European CBAM does not have any major impacts on the global energy demand and fossil fuel prices remain almost unchanged (-0.1%). As a result, exports of primary fossil fuels to the EU from such destinations like Russia even increase. The impact of CBAM on emission reductions outside the EU is also very limited (-0.05%).
VI. Conclusions
In this paper, we provide a preliminary assessment of the possible implications of the European CBAM on the EU trading partners. We considered a US$26/tCO2 tax, equivalent to the average 2019 EU ETS carbon price,[4] imposed on imports of commodities covered by the EU ETS, and explore impacts of such a tax under two carbon content assumptions – the EU average and country-specific content of imports’ origin.
Even under the case of exporters’ carbon content, we find limited negative impacts of the CBAM on most EU trading partners. Due to the high carbon intensity of iron and steel production and the EU being the key export destination for this commodity, Ukraine is the most impacted country, with a per capita income reduction of up to 0.4%. The rest of Europe is the second most impacted region (-0.35%), with a large reduction in electricity exports (-29.9%). At the sectoral level, chemical products, iron and steel are among the most impacted commodities. In addition to the reduction in iron and steel exports from Ukraine (-5.1%) and India (-5.9%), there is a reduction in exports of chemicals from Russia (-4.3%) and China (-1.3%).
We find limited negative impacts on large energy exporters, both because primary energy commodities are not covered by the ETS and due to the minor impact of the CBAM on global fossil fuel prices (-0.1%). At the same time, as other non-EU countries also face the CBAM there is a redirection of exports from the EU to these other destinations, which reduces potential export losses. Our analysis suggests minor impacts of the CBAM on emission reductions outside the EU.
Acknowledgments
The research and analysis was conducted as an analytical input to the technical assistance led by the Institute for Economics and Forecasting, National Academy of Sciences of Ukraine (IEF), sponsored by the European Bank for Reconstruction and Development (EBRD) and funded by SIDA to support the Government of Ukraine in its Second Nationally Determined Contribution (NDC) development. Any views, opinions, assumptions, statements and recommendations expressed in this paper are those solely of the author and do not necessarily reflect the official policy nor the position of the Government of Ukraine or others. The author would like to acknowledge valuable comments provided by the EBRD related author’s technical analysis. The author is also grateful for the helpful comments and suggestions from the Editor and referee of this journal.
The 20 regions include: Australia and New Zealand, China, Japan, rest of East Asia, Southeast Asia, India, the rest of South Asia, the USA, Canada, the rest of North America, Latin America, the EU-27, the UK, the EFTA, the MENA, Sub-Saharan Africa, Ukraine, Russia, the rest of Former Soviet Union (FSU) and Rest of Europe.
The 22 sectors include: crops, livestock, forestry, coal, oil, gas, other extraction, refined oil products, processed meat, other food, paper products, chemicals, non-metallic minerals, ferrous metals, non-ferrous metals, other manufacturing motor vehicles, other machinery, electricity, trade, transportation services, and other services.Only CO2 emissions from fossil fuel combustion are considered in this study.
The change in welfare is estimated using the Hicksian Equivalent Variation.
Converted to the US$2014.