1. Introduction
Making crude oil accessible and energy supply sustainable are important because oil is an ingredient for sustainable economic growth. It follows that the determinants of oil prices are crucial information (see Ertuğrul et al., 2020; Narayan, 2020).
Recently, the COVID-19 pandemic has appeared as a significant challenge for the global economy. The pandemic has affected oil prices and their volatility (see Devpura & Narayan, 2020).
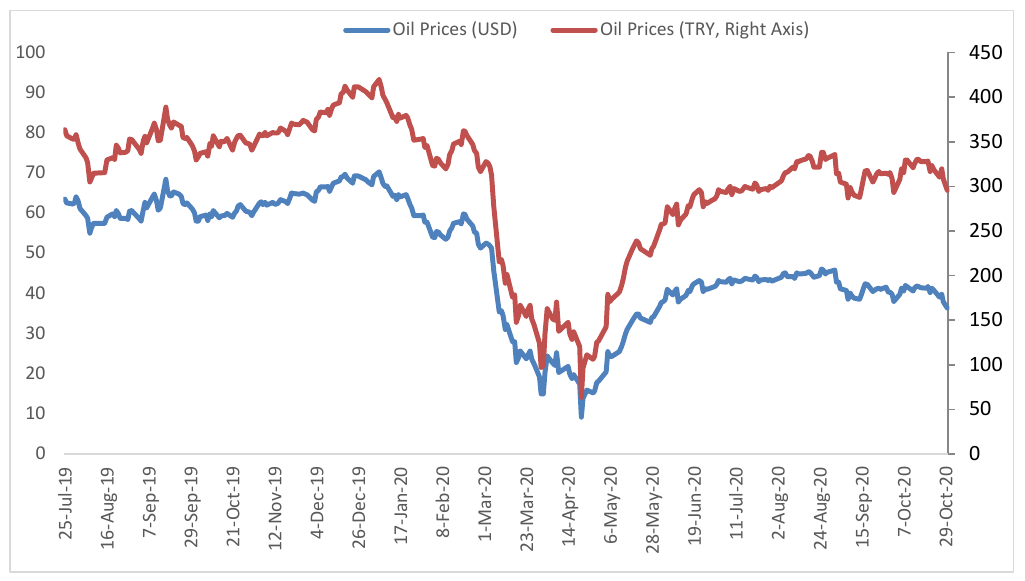
This study examines the reaction of oil prices to the pandemic by focusing on Turkey. This is important because local currency oil prices in Turkey have increased significantly since the beginning of the pandemic. The study hypothesizes that the pandemic has influenced the local currency oil prices in Turkey. This hypothesis is tested by using daily data from July 25, 2019 to October 30, 2020. Our sample includes both the pre-pandemic and the pandemic periods. We employ the multivariate adaptive regression splines (MARS) method. In addition, four local and global variables are considered as control variables. The empirical analysis offers the following findings. First, we find that the COVID-19 pandemic has a dynamic effect on the factors that influence local currency oil prices in Turkey. Second, we observe that the pandemic changes the power of the influential factors on the local currency oil prices. Third, the volatility index is the most important factor determining oil prices regardless of the sample period considered.
Although there are various studies that examine oil prices (see Narayan, 2020), our study is different because it contributes to the evolving literature concerning the effect of the COVID-19 pandemic on oil prices by applying the MARS method for the first time. This method offers additional insights on the behavior of oil prices. Moreover, we provide evidence on how oil prices have changed during the pandemic for Turkey.
The remaining of the study is organized as follows. Section 2 explains the variables, data, and methods. Section 3 presents empirical results, and the final section concludes.
2. Variables, Data, and Methods
2.1. Variables
Local currency Brent crude oil prices (OIL) per barrel are used as the dependent variable. The reaction of OIL to the pandemic is evaluated by accounting for the effect of the foreign exchange in influencing oil prices.
There are several variables used to examine oil price changes. Data for most variables are published on a quarterly or a monthly basis; however, this study focuses on the pandemic effect that requires working with daily data. For this reason, this study includes variables that are available at a daily frequency. In this context, the United States Dollar (USD)/ Turkish Lira (TRY) (USD/TRY hereafter) exchange rate variable, the credit default swap spreads (CDSS), the US Economic Policy Uncertainty Index (UNCERT), the volatility index (VIX) as a proxy of market volatility, are included.
The exchange rate is also included as an independent variable because studies (see Khan et al., 2019; Kirikkaleli & Doğan, 2020; Yılmaz & Altay, 2016) show that it affects oil prices. A positive relationship is expected between USD/TRY and OIL. In other words, OIL increases when USD/TRY increases.
Besides, CDSS is included because it reflects the default risk of countries (Hibbert & Pavlova, 2017). It is expected that local currency oil prices increase with CDSS; see Naifar (2020). We consider the 5-year sovereign USD CDSS of Turkey because this maturity has the highest liquidity (Hasan et al., 2016). A positive relationship is expected between CDSS and OIL.
Moreover, volatility and uncertainty are significant for global markets. Various studies, such as Kartal et al. (2020), consider volatility in their studies. With the beginning of the pandemic, global volatility and economic uncertainty have increased. Increasing volatility has a negative effect on financial markets (Liew et al., 2018). The VIX index, which is a very common indicator, is included as a volatility indicator. Besides, the UNCERT—an indicator of economic policies’ uncertainties, is included. A positive relationship is expected between VIX and OIL, and UNCERT and OIL.
2.2. Data
This study includes daily data from July 25, 2019 to October 30, 2020. This period is selected to include equal (i.e. 155) observations for the pre-pandemic and the pandemic sample periods. Data for the COVID-19 pandemic are gathered from the Ministry of Health of Turkey (2020) while data for all other variables are gathered from Bloomberg (2020). Moreover, the start of the pandemic in Turkey was identified on March 11, 2020; we, therefore, use this data to divide our full sample into pre- and post-COVID-19 sub-samples.
2.3. MARS Method
The MARS method is a nonparametric regression model that estimates the underlying functional relationship between variables introduced by Friedman (1991). The MARS method has no pre-assumptions whereas linear regression models have. In the MARS method, there are two steps. In the first step, the algorithm starts from a constant term that is the mean of the dependent values. In the second step, the piecewise linear segments, known as basis functions (BFs), are iteratively added to the model. The BFs are dependent on spline functions that are defined on a given segment and the end points of the segment are called knots. The forward step finds the potential knots to improve performance and leads to overfitting.
A general MARS model could be formulated as in Equation (1) below (Friedman, 1991):
Y=B0+K∑k=1anBn(Xt)+ε(1)
in which Y is the dependent variable and X represents independent variables; denotes the constant term; describes the basis function that is estimated by minimizing the residual sum of squares; and shows the coefficient of basis functions.
In the backward stepwise stage (pruning stage), redundant knots that have the least contribution to the complex model by using Generalized Cross-Validation (GCV) can be eliminated The best model is selected according to the highest coefficient of determination and the lowest GCV value (Hastie et al., 2009).
3. Empirical Results
3.1. Descriptive Statistics

Oil prices in Turkey have an increasing trend since the beginning of the COVID-19 pandemic. Although they are low in comparison to the pre-pandemic period, they are quite high since the beginning of the pandemic.
Table 1 summarizes the descriptive statistics of the variables used in the analysis. Descriptive statistics show that figures for variables vary according to the periods. We see, for example, that oil prices were both lower and more volatile in the pandemic period compared to the pre-pandemic period. Uncertainty was almost three time higher in the pandemic period. Similarly, we notice that the CDSS was much higher in the pandemic period.
3.2. MARS Analysis
As a result of MARS analysis, BF16 is determined as the best model in both periods. Besides, the importance of variables varies according to the periods as presented in Table 2.
The adjusted of the best MARS model is 0.894 for the pre-pandemic period and 0.946 for the pandemic period. These results imply that changes in the oil prices could be explained with the variables included in the analysis.
The results also reveal that the volatility index has the highest effect on oil prices in both periods. Moreover, uncertainty is determined as ineffective for the pre-pandemic period.
By considering these results, one proposal is that Turkey should deal with CDSS by reducing the spread, and making exchange rate stable so that the effect of these variables on oil prices can be less significant. The main reason behind this recommendation is that focusing on local factors (i.e. CDSS, USD/TRY) could be much more beneficial because local factors are either mostly or partially under the control of Turkey whereas volatility is not fully under the control of Turkey.
4. Conclusion
The study examines the reaction of the oil prices in Turkey to the pandemic using daily data between July 25, 2019 and October 30, 2020. The findings reveal that volatility has the highest importance on oil prices for both the pre-pandemic and pandemic periods and the effects of other variables vary according to the whether or not Turkey is in a pandemic. The results obtained are consistent with the literature. Considering the results, it is proposed that Turkey should focus on decreasing the negative effects of CDSS and USD/TRY on the oil prices because they are mostly or partially under the control of Turkey.