I. Introduction
China leads the world in energy consumption and carbon emissions. Its population of approximately 1.4 billion suggests that residential electricity conservation plays a critical role in China’s deep decarbonization efforts to achieve carbon neutrality by 2060 (Bataille et al., 2016). Hence, the goal of this paper is to propose an incentive scheme for residential electricity conservation in Shenzhen, China’s high-tech manufacturing hub with a population of about 17.8 million.
Our geographic choice reflects that Shenzhen is one of the four zones selected in 1978 for testing economic liberalization and market reform. If the scheme is effective in Shenzhen, it presents similarly promising prospects for other regions in China. In short, success in Shenzhen’s residential electricity conservation is essential for advancing China’s pathway to deep decarbonization.
To provide the contextual background for our paper, Table 1 presents Shenzhen’s residential tariff with inclining tier rates, whose design has been found to induce conservation (Liu & Lin, 2020; Orans et al., 2009). However, the rates for customers with usage levels below the Tier 2 threshold are lower than Section II’s estimate of Shenzhen’s marginal generation cost (MGC), which incorporates carbon pricing as suggested by Stavin (2008). Reducing this overconsumption through mandatory marginal cost pricing can trigger significant bill increases, inevitably prompting customer opposition (Woo et al., 2023). Hence, we propose an incentive scheme that encourages voluntary participation, thereby minimizing adverse bill impacts and customer opposition to residential conservation efforts.
The scheme is applicable to China’s other megacities like Beijing, Shanghai, and Guangzhou because (a) the residential inclining tier rate design was established nationwide in 2012 (Liu & Lin, 2020); and (b) these cities have marginal generation costs (MGC) like Shenzhen’s. As a result, our paper makes three noteworthy contributions. The first is methodological, as the proposed scheme’s design is unprecedented in the literature on China’s inclining tier rates. The second is empirical, demonstrated by the scheme’s estimated conservation effectiveness. The third is policy-related, as adopting the scheme would advance China’s pathway to deep decarbonization in pursuit of carbon neutrality.
The reminder of the paper is organized as follows. Section II provides a discussion on data and methodology used in this study, followed by discussion of main findings in Section III. The final section concludes the paper.
II. Data and Methodology
A. Data
This section seeks to estimate Shenzhen’s marginal cost (MC) of electricity end-use consumption, which is essential for efficient ratemaking (Woo et al., 2023). As outlined by Sreedharan et al. (2012), with MGC and MTDC denoting marginal generation cost and marginal transmission and distribution cost, respectively. The focus of this analysis is on Shenzhen’s MGC, as publicly available data for transmission and distribution expansion necessary to estimate MTDC is lacking.
The calculation of the MGC employs the following formula, which incorporates three components as presented on the right-hand side of Equation (1):
MGC=MEC+MCC+MKC
here, MEC refers to the marginal energy cost (CNY per MWh), MCC represents the marginal carbon emissions cost (CNY per MWh), and MKC denotes the marginal capacity cost (CNY per MWh). Each of these components is detailed below.
In consideration of China’s LNG imports[1], the MEC estimate of 688.39 CNY per MWh is derived by multiplying: (a) a 7 MMBtu per MWh heat rate (HR) for combined cycle gas turbines (CCGT); (b) an average line-loss factor of 1.05; (c) the monthly average LNG Japan/Korea Marker PLATTS futures price of 12.83 USD per MMBtu (covering February 2025 to January 2026, sourced from the CME Group[2] as of 19 December 2024); and (d) the prevailing exchange rate of 1 USD ≈ 7.30 CNY in December 2024.[3]
The MCC is estimated at 100.97 CNY per MWh, calculated by multiplying the average line-loss adjustment factor, CCGT’s HR, LNG’s CO2 content (0.212 tonne of CO2e per MMBtu)[4], and Shenzhen’s carbon price (64.80 CNY per tonne of CO2e in 2024, source https://carbonpricingdashboard.worldbank.org/). A projected 10% increase in Shenzhen’s carbon price for 2025 raises the MCC to 111.07 CNY per MWh,[5] which does not significantly affect the findings reported in Section III.
The MKC, roughly 87.5 CNY/MWh, is derived from a ~100,000 USD/MW-year estimate for new CCGT (PJM, 2018) divided by 8,760 hours, multiplied by the 1.05 line-loss factor and a 1 USD ≈ 7.30 CNY exchange rate (Dec 2024). This estimate sufficiently demonstrates per kWh incentive determination; moderate changes (±20%) do not materially alter results.
The preceding numbers indicate that MGC = 876.9 CNY per MWh, which is equivalent to 0.8769 CNY per kWh. Tier 1 and 2 rates in Table 1 (below 0.71 CNY/kWh) result in overconsumption, which could be addressed by mandatory marginal cost pricing (Woo et al., 2023). However, as this would greatly increase bills for low-use customers, we recommend a voluntary incentive scheme to encourage conservation without customer opposition.
B. Methodology
The proposed incentive scheme (“Scheme”) is modelled after BC Hydro’s electricity pricing for commercial conservation (Orans et al., 2010). Implementation involves a two-part billing process. The first component represents the electricity charges for a participant’s baseline consumption—what usage would have been in the absence of the Scheme. The second component comprises a bill reduction equal to the incentive payment for reduced consumption. The sum of these two components constitutes the participant’s total bill.
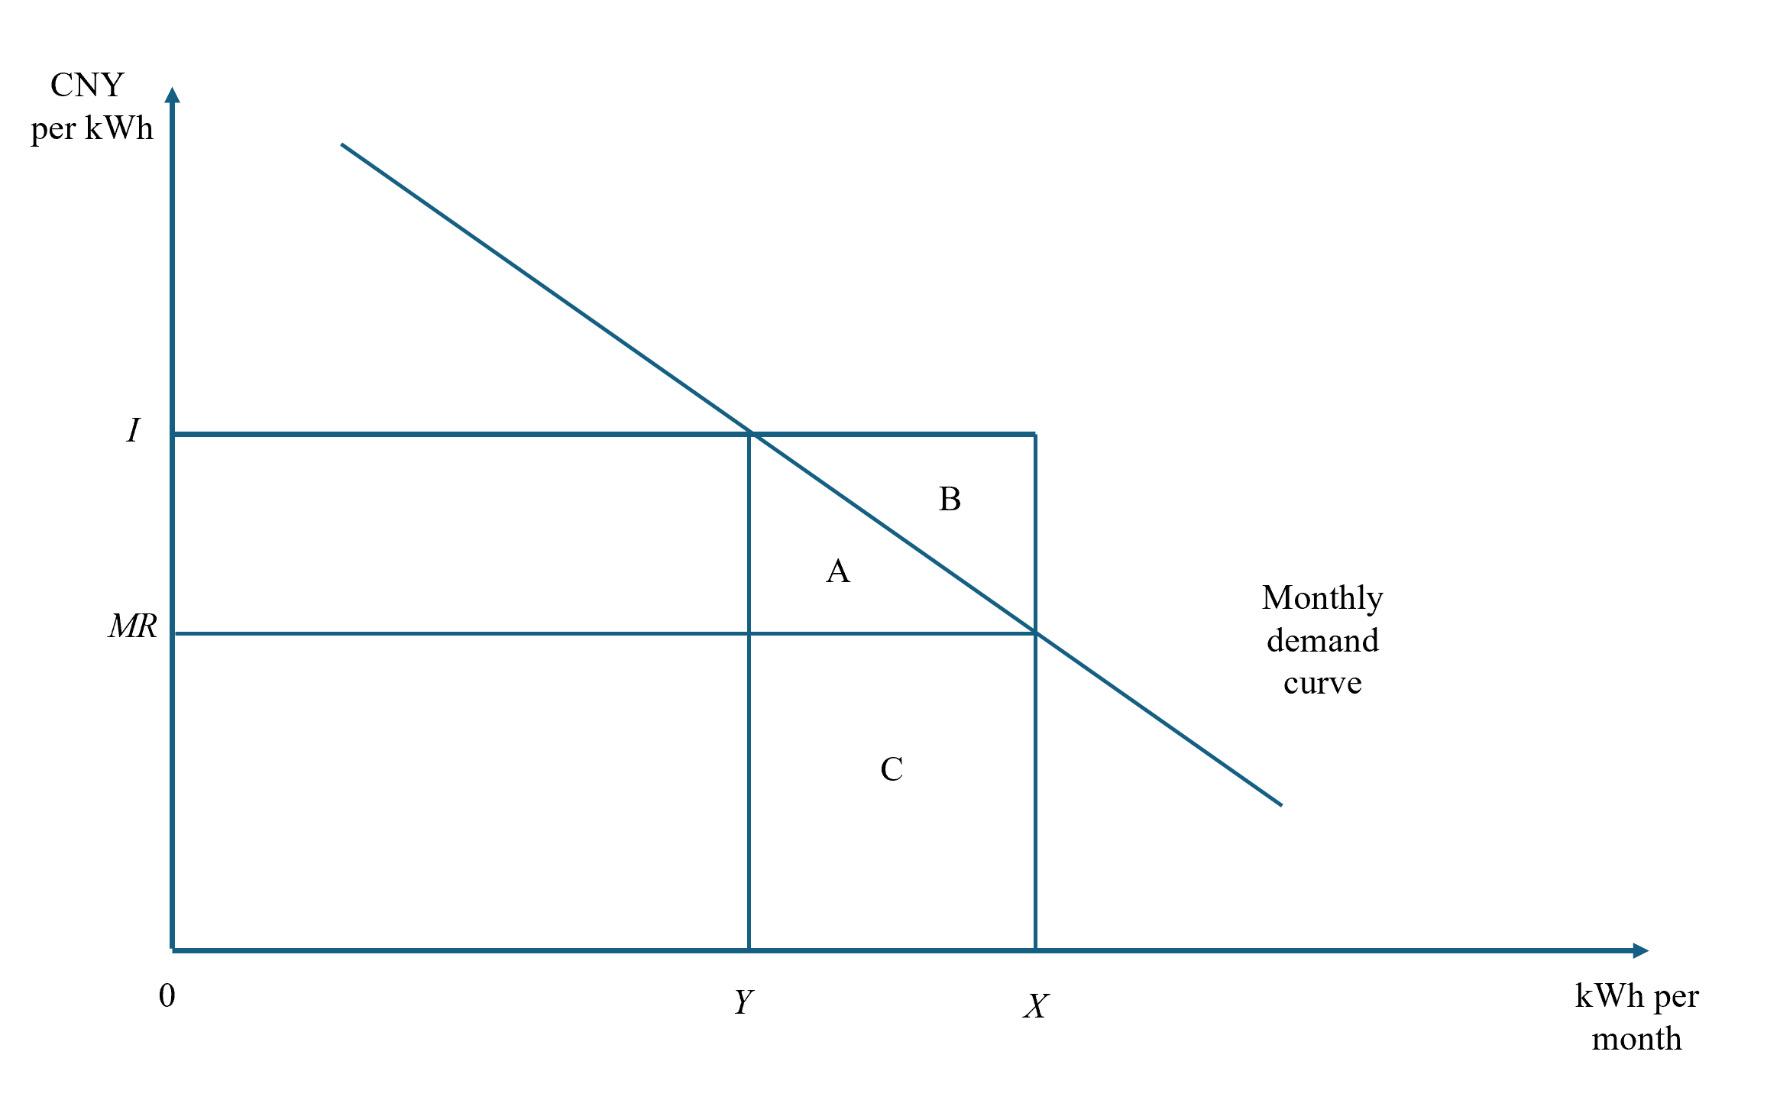
Given that the Tier 3 rate exceeds the MGC estimate, the following variables are employed to define the Scheme for eligible customers whose consumption falls below the Tier 2 threshold. The first variable is I (per kWh incentive), set as MGC to maximize conservation impact; if Shenzhen’s MTDC estimate were available, it would be included in this calculation. The second variable, MR, denotes the marginal electricity rate: for small customers with usage below the Tier 1 threshold, this is the Tier 1 rate, while for medium customers below the Tier 2 threshold, it is the Tier 2 rate. The third variable, X, reflects an eligible customer’s baseline consumption for a specific month (e.g., July 2025), excluding the per kWh incentive; it is measured as the metered consumption from the same month of the prior year (i.e., July 2024) (Orans et al., 2010). Provided there are no substantial interannual variations in weather or personal income, determining X based on historical consumption is reasonable, supported by methodologies used in North America for two-part real-time pricing mechanisms (Woo et al., 2014). The fourth variable, Y, captures actual metered consumption during the post-enrolment month (e.g., July 2025). The fifth, represents the reduction in electricity consumption attributable to the Scheme’s incentives.
Using these variables, the Part-1 bill for a participating customer is represented by Z for X kWh at the prevailing inclining tier rates. The Part-2 bill reduction is calculated as Thus, the customer’s final bill is (Z – R), which will be less than Z when and R > 0. If consumption Y surpasses X, then R becomes zero, and the customer’s final bill equals the amount for Y kWh billed at the applicable inclining tier rates.
III. Main Results
This section illustrates the Scheme’s Pareto superiority by demonstrating that its implementation can enhance participating customers’ welfare without disadvantaging the electric utility or other customers. The proof is based on the analysis of four possible scenarios:
Case 1: An eligible customer opts not to participate in the Scheme because (X – Y) < 0, resulting from anticipated increases in usage due to changes in family size or major appliances. This decision has no impact on the utility or other customers. Case 2: X > Y arises from a participating customer’s unforeseen increase in usage (e.g., additional air conditioning during an extended heatwave). As the customer’s final bill reflects Y kWh charged at the respective inclining tier rates, the Scheme does not negatively affect the customer, the utility, or other customers. Case 3: X = Y, indicating a price-insensitive participant. In this situation, the Scheme leaves the customer, the utility, and other customers unaffected. Case 4: X > Y as a result of price sensitivity, illustrated by the demand curve in Figure 1. Here, the customer achieves a bill reduction equal to area although there is a consumer surplus loss equivalent to a net gain represented by area B remains. While the incentive payment may reduce the utility’s revenue, it does not adversely affect operating profits or average rates for other customers, as and R denotes the avoided generation cost facilitated by reduced customer usage.

Focusing on residential electricity conservation, we evaluate the Scheme’s viability based on the percentage reduction in electricity consumption, calculated as where E represents the own-price elasticity of residential electricity demand. Table 2 indicates that small participating customers can achieve reductions between 3.6% and 18.0%, while medium customers see reductions ranging from 2.5% to 12.3%.
For context, Table 3 outlines Shenzhen’s voluntary residential time-of-use (TOU) rate option. Several points highlight the relative advantages of the Scheme. First, the Scheme’s straightforward single incentive per kWh conserved contrasts with the TOU option’s complex nine-tiered rate structure, designed for revenue neutrality. Second, deviations of TOU rates from Shenzhen’s MGC estimates contravene the marginal cost pricing principle, leading to economically inefficient time-differentiated consumption (Woo et al., 2023). Third, the TOU option’s peak rates surpass—and off-peak rates fall below—the non-TOU rates, resulting in overall peak demand reductions being outweighed by off-peak reductions due to lower price responsiveness during peak periods (Woo et al., 2017). Finally, the TOU rate option fails to meet Pareto superiority, as it does not adhere to Mackie-Mason’s (1990) design guideline that the rate for a TOU period should be set between the applicable non-TOU marginal rate and that period’s MGC estimate.
IV. Conclusion
We conclude by highlighting the following key findings, which constitute the novelty of this paper and have not been previously reported in the literature on electricity product differentiation (Woo et al., 2014). First, Shenzhen’s residential inclining tier rates for small and medium customers are below the marginal generation cost estimate that incorporates carbon pricing. Second, the adverse bill impacts on small and medium customers caused by mandatory marginal cost pricing motivate our proposal of a Pareto superior incentive scheme with voluntary participation. Finally, even though participating customers may be only moderately price-responsive, the Scheme is more effective than Shenzhen’s revenue-neutral TOU rate option in encouraging electricity conservation. The policy implication of these findings is that the Scheme merits pilot testing to determine its customer acceptance and conservation effectiveness.
Funding
This study is funded by the Ford Foundation (#134371 and #139746) and the National Natural Science Foundation of China (#72473103) and supported by the Research Centre for FinTech and Digital-Intelligent Management at Shenzhen University.
Disclosure of interest
I declare that there is no conflict of interest regarding the publication of this paper. I, the corresponding author, on behalf of all contributing authors, hereby declare that the information given in this disclosure is true and complete to the best of my knowledge and belief.
https://www.cmegroup.com/markets/energy/natural-gas/lng-japan-korea-marker-platts-swap.html
The MEC estimate is 698.07 CNY per MWh when (c) is revised to reflect the LNG futures prices downloaded on 18 March 2025 and (d) is the exchange rate of 1 USD ≈ 7.30 CNY in the first 20 days of March 2025. Hence, updating (c) and (d) increases the MEC estimate, thus magnifying the per kWh conservation incentive detailed in Section III.
Due to liquefaction, transportation, and regasification, the carbon footprint of LNG is approximately four times that of natural gas, which has a carbon content of 0.053 tonnes of CO2e per MMBtu (North Sea Transition Authority, 2023).