I. Introduction
The quest for attaining environmental sustainability is only possible by limiting carbon dioxide (CO2) emissions because it accounts for 75% of global greenhouse gas emissions and is a primary cause of environmental depletion (Behera, Behera, et al., 2024). Increasing CO2 further escalates global warming and climate change; thus, lessening CO2 emissions is crucial to addressing climatic risk and achieving environmental sustainability (Adebayo, 2022). Moreover, as per the International Energy Agency Report (IEA, 2020), global energy demand is estimated to escalate by 30% by 2040 with increasing industrialisation, urbanisation, and anthropogenic activities. In addition, the dominance of conventional fuels, such as oil and coal consumption, continues to increase in the global energy mix, as they are less costly than non-conventional energy sources (Behera, Sucharita, et al., 2024). However, the consumption of fossil fuels results in the exploitation of natural resources, leading to severe environmental depletion and climate change. Therefore, policies aiming at a paradigm shift towards non-conventional energy use from conventional ones are vital for achieving environmental sustainability and sustainable growth.
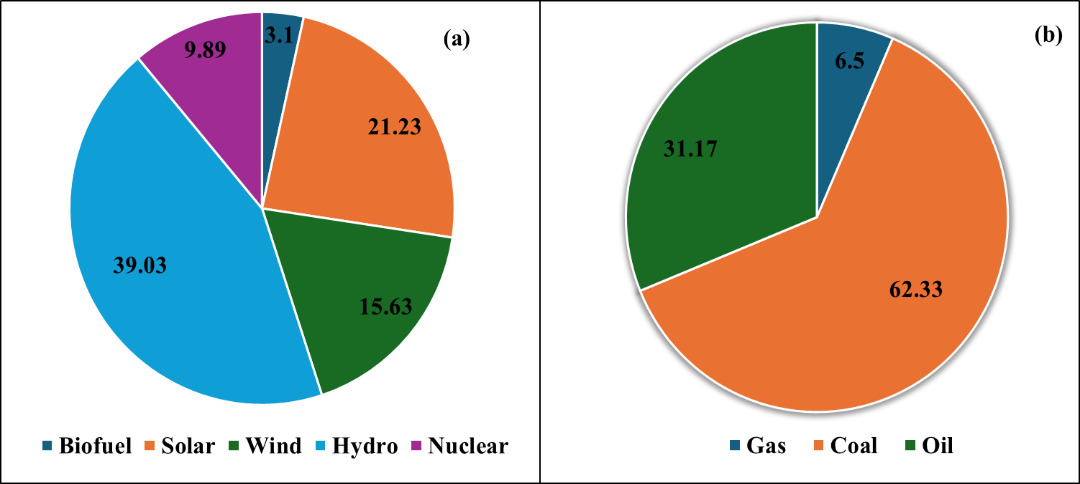
On the other hand, as an emerging economy, India, with its higher demand for primary energy consumption, is the third-leading global energy consumer, utilising various disaggregated energy sources (Ritchie et al., 2023b). The share of India’s energy consumption from distinct sources is presented in Figure 1.
_and_non-renewable_(b)_energy_use_in_india.png)
Figure 1(a) shows that hydro energy consumption represents 39% of the total renewable energy consumption from different sources in India, followed by solar energy (21%) and wind energy (16%) consumption. Additionally, India has an installed hydroelectric capacity of “148,701 megawatts (MW),” and in the year 2022, it accounted for approximately “456.04 terawatt-hours (TWh) units” of electricity generation (Ritchie et al., 2023b).
Furthermore, Figure 1(b) demonstrates that coal consumption accounts for 62% of the total disaggregated non-renewable energy sources, followed by oil (31%) and gas (7%) consumption. This is primarily because, in the last four decades, there has been a surge of 700% in per capita commercial energy consumption from coal energy (Powell et al., 2023). India, with its higher reliance on conventional energy sources, stands as the third leading carbon emitter in the world (Ritchie et al., 2023a). Thus, claiming a safer, sustainable, and cleaner alternative to energy consumption is imperative to accomplish environmental sustainability. Since India highly relies on hydro and coal energy consumption, among other disaggregated energy sources, the present research aims to assess the effect of coal and hydro energy consumption on CO2 emissions.
Nonetheless, this study has considered the decisive role of political stability because it helps implement effective and coherent policies to mitigate CO2 emissions and foster environmental sustainability (Behera, Behera, et al., 2024). Additionally, political stability indicates government effectiveness in endorsing policies such as “tax benefits and feed-in tariffs” to attract investments for green projects and fostering innovation in the renewable sector to attain environmental goals by reducing CO2 emissions (Adebayo, 2022). Furthermore, this study has included economic growth (GDP growth used as a proxy) and natural resource rents, given their definitive role in determining the environmental sustainability of a country. Studies have also reported that conventional energy-led economic growth backed with higher industrialisation depletes natural resources, resulting in long-term environmental deterioration (Hassan et al., 2022). Although numerous findings have demonstrated the effect of aggregate renewable and non-renewable energy utilisation, the impact of an individual energy source on CO2 emissions needs to be studied more. This study thus makes novel contributions to the literature on energy and the environment by investigating the effect of hydro and coal energy consumption on India’s environmental sustainability spanning from 1985 to 2021. For robust empirical analysis, this study employs the autoregressive distributed lag (ARDL) approach to investigate the short- and long-run effect of the individual regressors on CO2 emissions.
II. Data
The study is based on a time-series analysis of India from 1985 to 2021. For the empirical investigation, CO2 emissions per capita are considered as the response variable, whereas the independent variables are hydro energy consumption (HEC), coal consumption (CC), and political stability (PS). Additionally, economic growth and natural resources rent (NRR) are considered as control variables. The secondary data sources for the variables under consideration include the World Bank, Our World in Data, and the Political Risk Services Group database.
A. Model Specification and Methodology
The empirical equation demonstrating the effect of explanatory variables on CO2 emissions is presented in Equation (1), after transforming all the variables into their natural logarithmic forms, as per the approach adopted by Sahoo & Sahoo (2020).
lnCO2t=δ0+δ1lHECt+δ2lCCt+δ3lPSt+δ4ΔlGDPRt+δ5ΔlNRRt+εt
Where, HEC, CC, and PS indicate the independent variables, t is the time-period, is the vector of control variables i.e., natural resources rent and economic growth, and is the residual term. Furthermore, the ARDL estimation method is presented as follows:
ΔlCO2t=ρ0+m∑h=1ρ1ΔlHECt−i+m∑h=1ρ2ΔlCCt−i+m∑h=1ρ3ΔlPSt−i+m∑h=1ρ4ΔlGDPRt−i+m∑h=1ρ5ΔlNRRt−i+α1ΔlHECt−i+α2ΔlCCt−i+α3ΔlPSt−i+α4ΔlGDPRt−i+α5ΔlNRRt−i+εt
In Equation (2), the first difference is denoted by and is the constant term. Additionally, long- and short-run coefficients are represented by and to respectively. Furthermore, the ARDL estimator with the lagged error correction model is demonstrated in Equation (3).
ΔlCO2t=ρ0+m∑h=1ρ1ΔlHECt−i+m∑h=1ρ2ΔlCCt−i+m∑h=1ρ3ΔlPSt−i+m∑h=1ρ4ΔlGDPRt−i+m∑h=1ρ5ΔlNRRt−i+aECMt−i+εt
III. Empirical Findings and Discussion
The descriptive statistics and Zivot-Andrews (ZA) unit root test are presented in Table 1. The variables are observed to be normally distributed around the mean value, which is also affirmed by the insignificant coefficient value of the Jarque-Bera (J-B) normality test, as presented in Table 2. Furthermore, the unit root test result confirms the stationarity of the variables at level and first difference. As per the “Hannan-Quinn” criterion, 1 is selected as the lag period for all variables to yield an unbiased outcome. Additionally, the lower upper bound value compared to the F-statistic (13.70) indicates the cointegration nexus among the stated variables.
Next, we analysed Equation (1) using the ARDL estimation since it follows the bias-corrected bootstrap technique and non-linear functions of the conditional error correction model coefficients, which aids in assessing the long-run nexus between the variables (Ali et al., 2021, p. 4598), as presented in Table 2. Table 2 demonstrates that HEC has an adverse but statistically insignificant impact on CO2 in the short and long run. This corroborates the study by Sahoo and Sahoo (2020), who suggest that inadequate assessment of the environmental effects of building hydro projects, poor construction of dams, and the exploitation of hydro energy beyond threshold limits can have adverse effects on both the economy and the environment.
Furthermore, coal energy consumption is found to significantly increase CO2 in India. Coal consumption is attributed to the extraction and over-exploitation of natural resources, which impedes environmental sustainability by emitting higher CO2 levels, as supported by Pata and Kumar (2021). Nonetheless, PS is observed to substantially reduce CO2 in India in both the long and short run. This supports the findings of Hassan et al. (2022), which state that a stable political system ensures the implementation of benevolent policies to foster renewable energy transition and low-carbon economic expansion, thereby enriching environmental quality. This is also evident from the Government of India’s commitments to transforming the energy sector, including India’s leadership in the International Solar Alliance, the aim to achieve renewable energy capacity of 500 GW by 2030, and initiatives to promote solar energy usage through the “rooftop solar” scheme (PIB, 2024), showing India’s vision towards attaining environmental sustainability by reducing CO2 emissions to achieve sustainable goals.
Furthermore, as per the study’s findings, among the control variables, economic growth escalates CO2 in India primarily because the country relies on non-conventional energy consumption for various economic activities (Ritchie et al., 2023b). In addition, the long- and short-run effect of natural resources on CO2 emissions is observed to be positive but insignificant. This corroborates the findings of Huang et al. (2020), who posit that unsustainable use of natural resources in the absence of effective environmental policies can have deleterious consequences on the economy and the environment.
Furthermore, Table 3 illustrates the robustness results using the variance decomposition analysis (VDA), which measures the degree to which the response variable is explained by the variation in explanatory variables over a 10-year time horizon (Behera, Sucharita, et al., 2024). The VDA results in Table 3 suggest that over the course of a 10-year time horizon, significant variation in CO2 is attributed to the variation in coal consumption (57%), followed by hydro energy consumption (7.56%) and political stability (2.38%). These results support the ARDL findings, indicating that coal consumption substantially induces CO2 emissions compared to hydro energy and political stability in India.
IV. Conclusion
The empirical analysis concludes that hydro energy consumption plays an insignificant role in achieving environmental sustainability in India, whereas coal energy consumption is identified as a major contributor to carbon emissions. Therefore, from a policy perspective, there is a pressing need to initiate a paradigm shift in energy consumption by gradually increasing the share of renewable energy in India’s energy mix. Additionally, the government should offer tax incentives and subsidies to encourage investment in research and development (R&D) activities aimed at advancing India’s renewable energy sector. Furthermore, effective policy measures must be implemented to raise public awareness about the benefits of using renewable energy, as this can foster inclusive growth by curbing environmental degradation.
Nonetheless, recognising the limitations and future scope of this study, future research can be expanded to include the role of green finance and technological innovation, which are essential for mobilising the capital required for investment and facilitating technological diffusion in the renewable energy sector. More nuanced insights may also be obtained by incorporating panel data analysis or conducting comparative studies between countries, thereby providing relevant policy recommendations, given the urgent need to achieve environmental and sustainable development goals.