
I. Introduction
In recent years, blockchain technology has become increasingly integrated into global logistics, leading to the rise of supply chain tokens (SCTs). Unlike traditional cryptocurrencies, these tokens are linked to real-world industries such as logistics, manufacturing, and global supply networks. Since 2017, SCTs like Morpheus-Network, Trac-TRAIL, CargoX, and VeChain have emerged to provide alternative solutions within the Web3 ecosystem for supply chain operations. These tokens help organizations and clients reduce transaction costs, enhance transparency and data security, manage risk, and lessen environmental impact (Abdullah et al., 2024).
SCTs have drawn significant attention in decentralized finance and logistics management, especially in response to global supply chain disruptions caused by events and uncertainties related to economic policy, geopolitics, financial stability, and crude oil (CO) market volatility. Understanding the interactions between SCTs and CO is increasingly essential, as crude oil remains a cornerstone of global trade and economic activity. Both markets are sensitive to global macroeconomic conditions, but their dynamic volatility spillovers have received limited attention in the literature.
Theoretically, volatility spillovers between SCTs and CO can be explained by interconnected economic, geopolitical, and financial factors. Crude oil is a fundamental input in global supply chains, so volatility shocks in oil can directly affect the operational costs of logistics and manufacturing (Hamilton, 2009), which in turn influences the pricing of supply chain tokens. Conversely, these tokens are often tied to blockchain platforms and respond to macroeconomic uncertainty, geopolitical risks, and commodity price fluctuations. Both markets may also react to shared external shocks—such as geopolitical tensions, oil price swings, or changes in trade policy—resulting in synchronized volatility patterns. Financialization amplifies this connectedness, as investors may treat both asset classes as components of broader commodity or risk portfolios, transmitting volatility through cross-market hedging or speculation. Additionally, technological integration and the development of algorithmic trading can accelerate volatility spillovers across seemingly unrelated assets (Katsiampa et al., 2019), strengthening short-term co-movements between SCTs and CO prices.
A growing body of research has explored the relationships between specific utility tokens and oil, including energy tokens (e.g., Abakah et al., 2024), renewable energy tokens (e.g., Ali et al., 2024), transport tokens (e.g., Ustaoglu, 2025), and AI tokens (e.g., Yousaf et al., 2024). However, there remains a gap in the literature on volatility spillovers between SCTs and the CO market, particularly under conditions of global uncertainty. The only related study by Mbarek and Msolli (2025) examined the connectedness between SCTs and traditional assets using a QVAR framework but did not focus on the CO market or the influence of global risk factors on these relationships. In the post-COVID era, understanding these spillovers is increasingly vital, as supply chain disruptions, energy market volatility, and rising geopolitical tensions have reshaped the interconnectedness of global trade and asset markets (Chowdhury et al., 2025). Insights into how SCTs and oil markets interact under such uncertainty can inform risk management, portfolio diversification, and policy decisions in an increasingly volatile economic environment.
This study addresses a key gap by asking: To what extent does CO volatility spill over to SCTs, and how do global risk factors shape their dynamic connectedness? We examine a broad set of risks, including CO market fears, geopolitical tensions, economic policy uncertainty, the US shadow rate, financial stress, and investor risk aversion. By delving into this underexplored area, we aim to provide practical insights for investors and contribute to the ongoing dialogue on the integration of energy and crypto markets.
II. Data and Methodology
A. Methods
We adopt a model-free time-frequency connectedness approach based on the R² goodness-of-fit measure, as introduced by Gabauer et al. (2023)[1]. This method addresses convergence issues found in traditional frameworks such as the spillover index (Diebold & Yılmaz, 2014) or quantile VAR models (Chatziantoniou et al., 2022) by providing a robust upper bound for total connectedness. It captures time-varying relationships without imposing strict model assumptions and allows for analysis across different investment horizons. Using the Maximal Overlap Discrete Wavelet Transform by Percival and Walden (2000), we decompose return series into six frequency bands, focusing on short-term (2–8 days) and long-term (64–128 days) components[2]. This decomposition enables us to detect distinct spillover patterns and better understand how macroeconomic and geopolitical shocks influence volatility transmission across different time scales to the SCT and oil.
B. Data
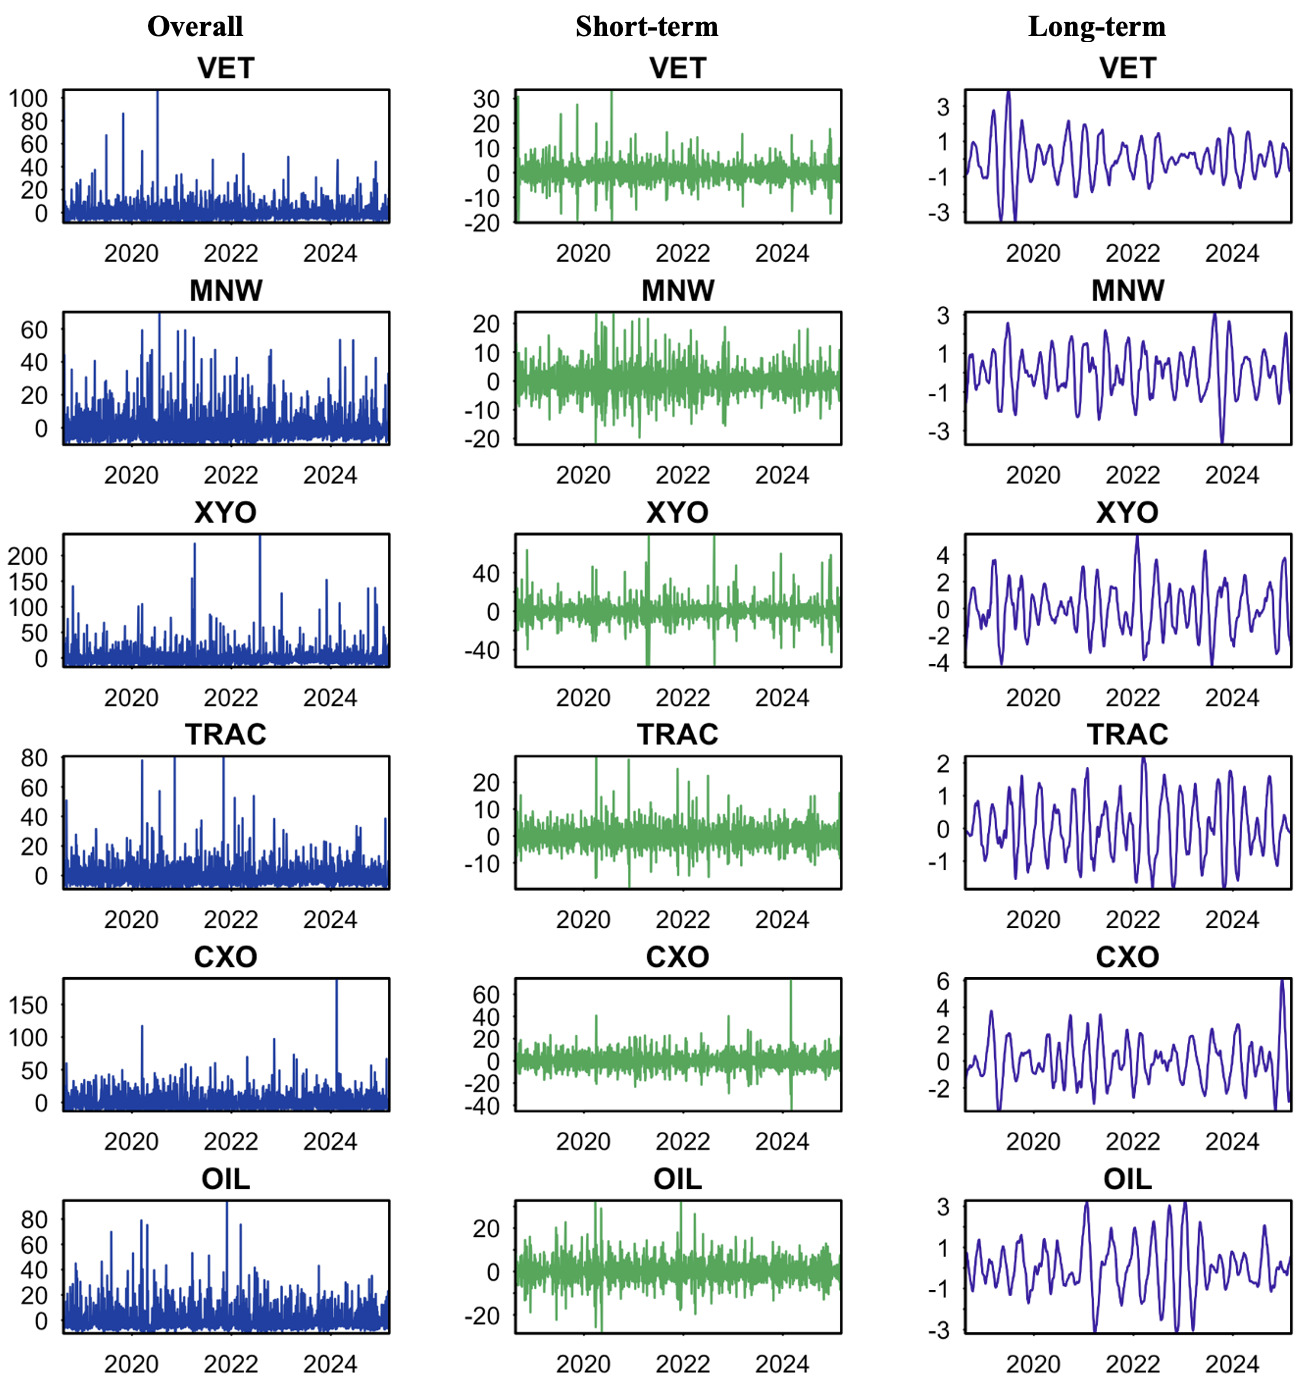
We use daily data for the five highest-capitalized SCTs: XYO token (XYO), CargoX (CXO), Morpheus Network (MNW), VeChain (VET), and OriginTrail (TRAIL). Data were extracted from the CoinMarketCap database (https://coinmarketcap.com). As for the CO (OIL), we refer to S&P global oil price and collected from the S&P Global database (https://www.spglobal.com/spdji). The time series covers the period from 27 July 2018 to 05 March 2025. The sample period’s inception is contingent on the SCTs’ price availability and their launch dates. We define daily returns as: Using the return series[3], we estimate daily volatility using DCC-GARCH model (Engle, 2002)[4] and calculate changes in volatility in a similar manner. For our connectedness analysis, we decompose the volatility series into short-term (D2) and long-term (D6) components. Fig. A.1 illustrates the overall, short-term, and long-term changes in volatility.
III. Results
Static connectedness results
We begin with the static analysis presented in Table 1. All values reflect overall connectedness measures, with short- and long-term connectedness reported in parentheses. For example, in the context of overall market volatility connectedness, CO displays the highest own variance shock (95.80%), meaning that only 4.20% of its forecast error variance is influenced by other variables. In contrast, TRAC records the lowest own variance shock (78.90%), indicating a greater sensitivity to external shocks. The row labeled TO represents the impact each variable has on others, where TRAC stands out as the strongest transmitter of shocks, contributing 22.26% to the system. Conversely, the column labeled FROM shows the influence each variable receives from the network, and here TRAC again leads, receiving 21.10% of its shocks from other variables.
The NET row reflects net directional connectedness, where negative values indicate net receivers of shocks and positive values denote net transmitters. MNW records the lowest NET value (-0.60%), making it a primary net receiver of risk under normal market conditions. In contrast, TRAC, with the highest NET value (1.16%), emerges as the main net transmitter of return shocks. This trend is consistent across both short- and long-term frequencies. The total connectedness index (TCI) stands at 15.20%, indicating that, on average, 15.20% of forecast error variance in each variable results from interactions within the network.
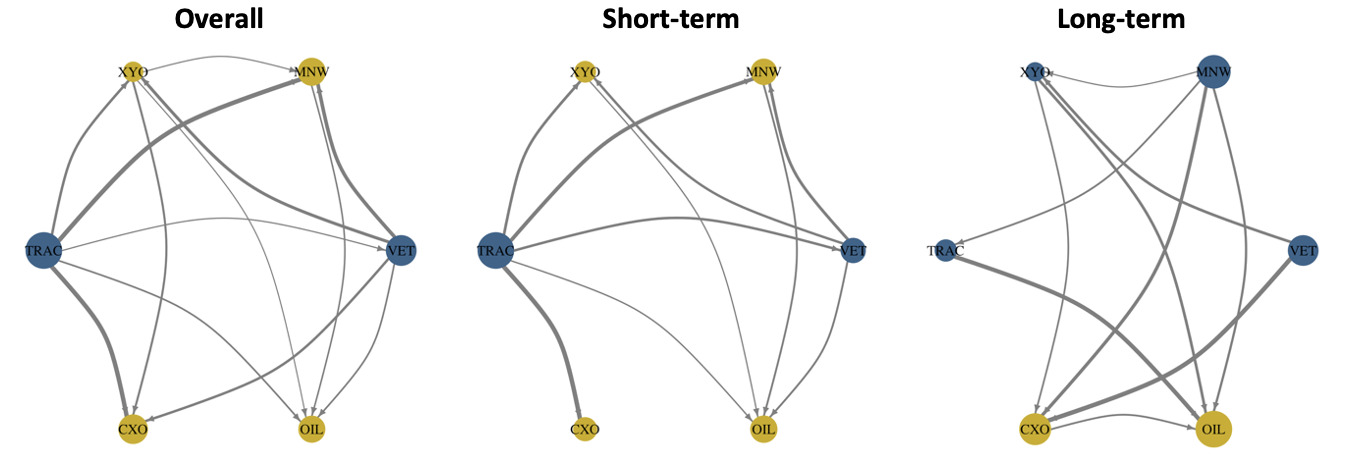
The short-term and long-term TCI values are 17.94% and 53.49%, respectively, indicating limited risk transmission in the short term and under normal conditions, but substantial spillover over the long term. The relatively low overall and short-term connectedness suggests there is potential for portfolio diversification between CO and SCTs. This finding aligns with previous research on utility tokens (Abdullah et al., 2024). To further investigate these dynamics, we assess network transmission using connectivity analysis, as illustrated in Figure 1.

The findings confirm that, under overall conditions, TRAC is the primary transmitter of shocks, while MNW is the main receiver. In the positive market transmission network, VET and TRAC act as shock transmitters, whereas the remaining assets are primarily receivers. Notably, CO receives shocks from all assets except CXO. This transmission pattern remains largely consistent across both short-term and long-term frequencies. The spillover from SCTs and CO can be attributed to their shared exposure to global risk factors. This interconnection reflects the pivotal role of CO in logistics and manufacturing costs, which directly influences the value and volatility of SCTs.
Dynamic connectedness results
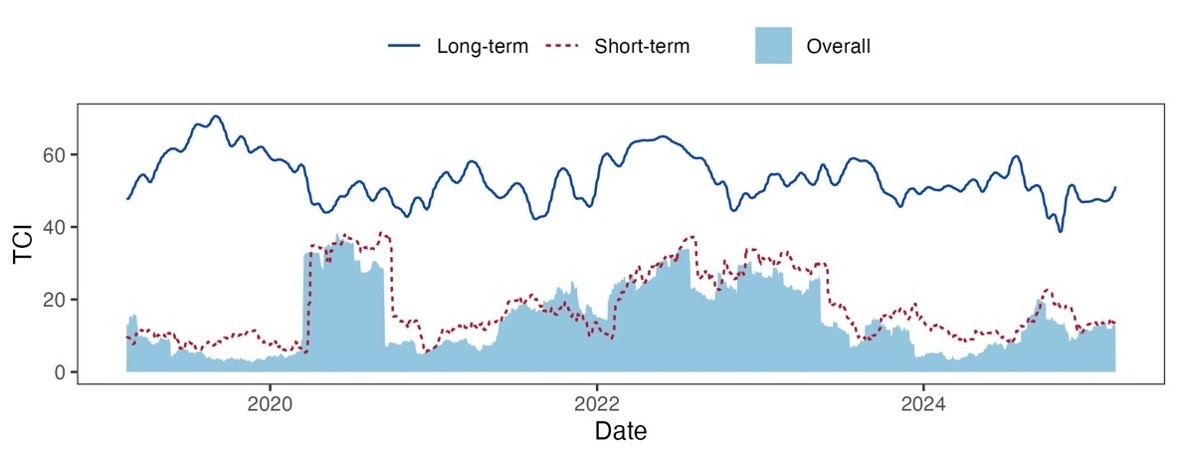
Now we shift our focus to dynamic connectedness. Figure 2 presents the results of the dynamic TCI, revealing a time-varying pattern that is strongly influenced by major global events. Specifically, TCI values range between 15% and 65% across different frequencies. Notable peaks are observed during the initial phase of the COVID-19 pandemic in 2020 and the Russia-Ukraine war in 2022, particularly in the overall and long-term frequency domains. The TCI in the long-term frequency is significantly higher and more volatile. This can be attributed to global lockdowns and production halts during COVID-19, as well as rising crude oil prices and inflation driven by reliance on Russian commodities. These factors intensified shocks across financial markets and supply chains.

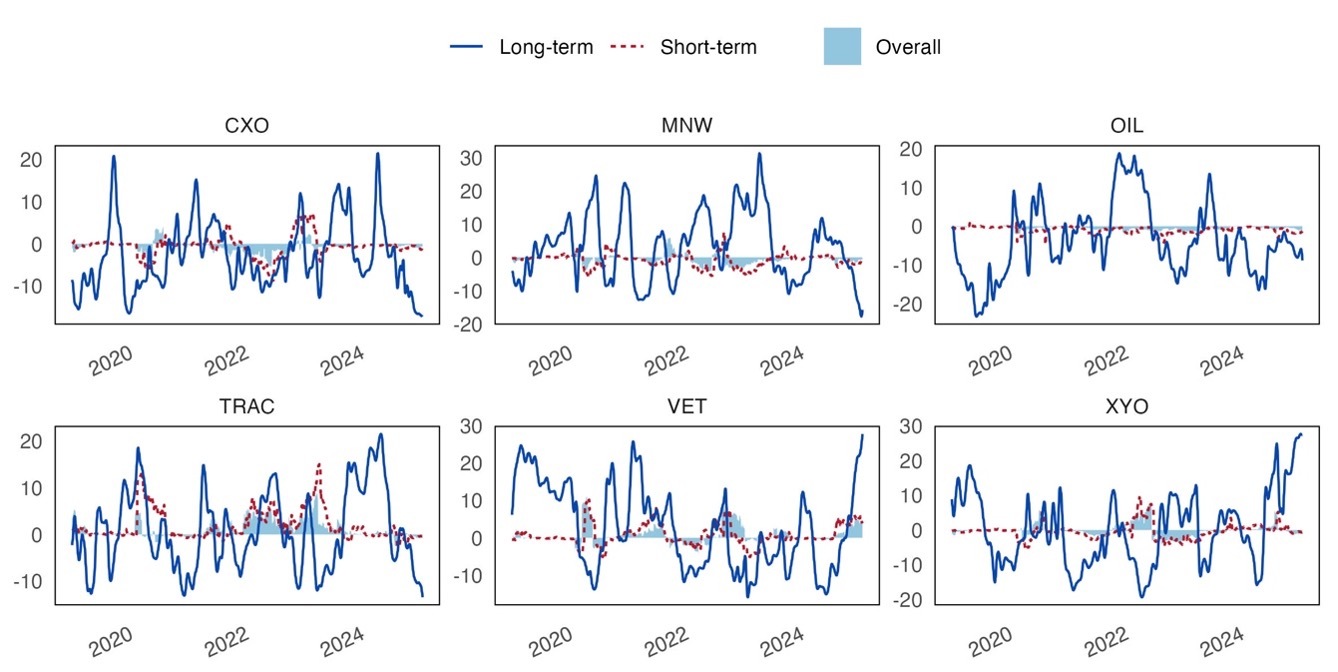
Next, we examine the dynamic net directional connectedness, with the results shown in Figure 3. This figure illustrates the direction of connectedness, where negative values indicate net receivers and positive values indicate net transmitters of shocks within the network. The findings reveal that most assets shifted their transmission roles over time, with long-term connectedness exhibiting high volatility and frequent reversals in role. Based on the TCI and dynamic net connectedness results, portfolio strategies should prioritize short-term conditions, as CO and SCTs exhibit limited stability for long-term investment.
Impact of uncertainty factors results
We now present the results regarding the impact of uncertainty factors on the connectedness between SCTs and CO. Following earlier studies (Abdullah et al., 2023, 2024), several indicators are used: the Chicago Board Options Exchange Crude Oil Volatility Index (OVX) to measure oil market stress, the Geopolitical Risk Index (GPR), the U.S. Economic Policy Uncertainty Index (EPU), the U.S. Shadow Short Rate (USSSR) as a proxy for monetary policy, the Financial Stress Index (FSI) to represent global financial conditions, and the Risk Aversion Index (RAI) to capture investor sentiment.[5]
Table 2 illustrates that most uncertainty factors exert frequency-dependent effects on the connectedness between SCTs and the CO market. Both OVX and RAI display negative coefficients, particularly in the short term, indicating that heightened market fear or stress can dampen volatility spillovers—likely because investors tend to withdraw from riskier assets. Similarly, the U.S. Shadow Short Rate exerts a negative influence, suggesting that tighter monetary policy weakens cross-market interactions. In contrast, the FSI consistently shows a positive and significant effect, emphasizing that broader financial stress enhances interconnectedness between these assets. The EPU has mixed effects: it increases spillovers in the short term, as markets respond to sudden policy shifts, but its impact fades or turns negative over the long term as markets adapt.
These findings imply that investors can adjust their portfolio strategies in response to prevailing risk conditions, reducing exposure during high-stress periods or leveraging greater connectedness during episodes of financial uncertainty. For risk managers, closely monitoring these uncertainty factors can strengthen early warning systems and improve hedging strategies.
IV. Conclusion
We investigate the time-frequency connectedness between SCTs and the CO market. Our results indicate that total connectedness remains low in the short term (2–8 days) but increases significantly over the long term (64–128 days), suggesting that volatility spillovers become more pronounced across longer investment horizons. Among the uncertainty factors analyzed, the OVX, RAI, and U.S. Shadow Short Rate show negative effects in the short term, implying that heightened investor risk aversion and tighter monetary policy reduce cross-market volatility transmission. In contrast, the FSI consistently exerts a positive and significant impact across all time frequencies, reflecting stronger asset interdependence during periods of systemic stress. The EPU index demonstrates a mixed effect—positive in the short term, yet neutral or negative in the long run.
For investors, the weak short-term connection between SCTs and CO offers diversification benefits during stable conditions, while the stronger long-term connectedness observed during stress underscores the necessity for dynamic, risk-adjusted strategies. For regulators, the amplification of spillovers in times of financial stress highlights the importance of enhanced market oversight and the implementation of macroprudential tools to contain systemic risks. Finally, for technology firms and token developers, understanding how macro-financial conditions influence token behaviors can guide the design of features aimed at boosting resilience and mitigating risk.
Funding Statement
This work was supported and funded by the Deanship of Scientific Research at Imam Mohammad Ibn Saud Islamic University (IMSIU) (grant number IMSIU-DDRSP2504)
