I. Introduction
Global warming remains one of the most pressing issues of our time. The World Economic Forum’s Global Risks Report 2022 highlights that climate-related risks are among the top ten most significant global threats over the next decade (E. G. Franco et al., 2022). Climate change has impacted all sectors, and healthcare is no exception, with increased burdens resulting from the outcomes of extreme weather events.
Meanwhile, the healthcare sector itself significantly contributes to climate change (Alshqaqeeq et al., 2020). Healthcare is responsible for 4.4% of global emissions (Salas et al., 2020), and 7% of emissions in Australia (Malik et al., 2018). In particular, hospitals are energy-intensive consumers and generate a large amount of emissions. For example, the electricity use of a major hospital—closely linked to the operation of air conditioning systems—can be equal to that of thousands of households (Liu et al., 2022). As such, hospitals must reduce carbon emissions while maintaining their service quality.
To achieve net-zero emissions (NZE) for a hospital’s energy use, onsite solar generation systems are often recommended (A. Franco et al., 2017; Vourdoubas, 2018). However, onsite solar systems are generally incapable of meeting a major hospital’s electricity needs due to roof size or space limitations. For major urban hospitals, real market options might include alternative approaches, such as participating in energy markets and utilising green finance instruments (Singh & Mishra, 2022).
This study aims to conduct an economic analysis of real NZE options for a major urban Australian hospital by evaluating heating electrification, the carbon credit market (CCM), and green power purchases. Australia is selected because its healthcare system is underexplored in decarbonisation studies, and relevant operational and emissions data are available. The objectives of the study are: (1) to examine 12 scenarios related to carbon emissions, renewable energy, and economic costs; (2) to compare the economic viability and risk profiles of these strategies to achieve net-zero; and (3) to provide evidence-based implications for hospitals, policymakers, and regulators.
This study contributes a novel economic analysis of real options to achieve net-zero emissions in the healthcare sector, exemplified by a modern Australian hospital. The proposed economic analysis model and framework are replicable for other regions and can be extended globally. The findings offer valuable insights for the healthcare sector and policymakers on how to leverage CCM and electrification technologies to facilitate emissions reduction and achieve the net-zero target.
The remainder of this study is structured as follows. Section II presents the data and analysis. Section III includes results, discussion, and implications. Section IV concludes the study with policy recommendations.
II. Data and Methodology
Queensland Children’s Hospital is the case study. This hospital is a major urban hospital located in subtropical Queensland, Australia. Its energy consumption patterns, and scale make it highly relevant for conducting a comprehensive carbon emissions analysis. There are three buildings: the main hospital building with 400 beds, a research facility building, and an energy plant. Together, these buildings have a total area of 133,000 square meters.
The data on electricity and natural gas use were collected from energy retailers’ bills, and the billed energy data were obtained from revenue class meters. To comprehend the relationship among energy use, carbon emissions, and ways to offset emissions, scenario analysis is conducted by combining CCMs, green power purchases, and electrification options (see Section III).
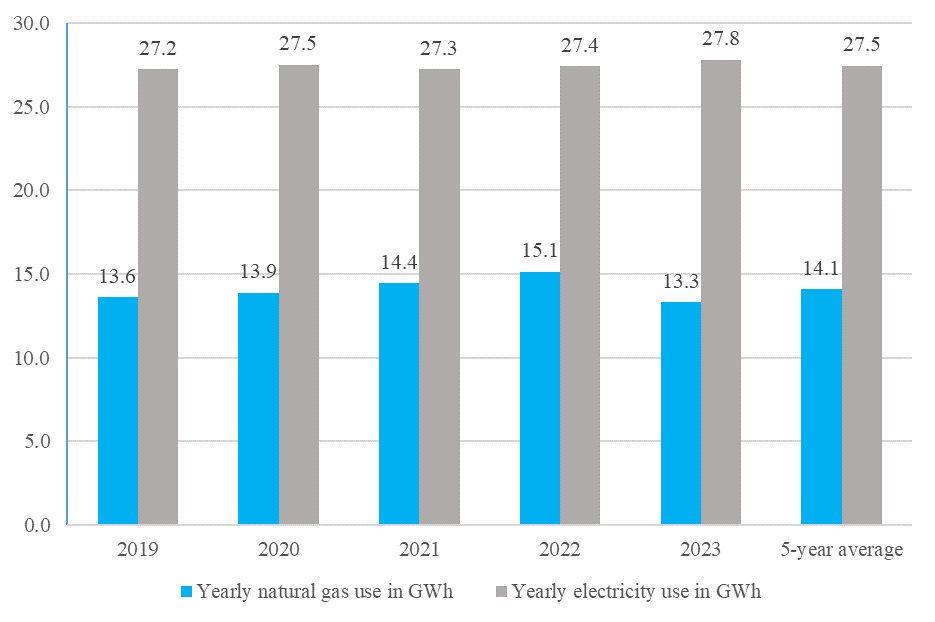
Figure 1 shows the yearly energy use between 2019 and 2023, including electricity and natural gas. Electricity is used for medical equipment, office equipment and all building services, e.g., air conditioning systems, lighting, and lifts. The average yearly consumption of electricity is 27.5GWh. This yearly usage is relatively stable, varying between 27.2GWh in 2019 and 27.8GWh in 2023.

Natural gas is used for hot water boilers (59%), steam boilers (26%), and commercial cooking (15%). The yearly average usage of natural gas is 14.1GWh (which is converted from a GJ value to the GWh value). The portion of natural gas used for hot water boilers and steam boilers (i.e., 85%) can be fully electrified with a capital cost of $660/MWh (electrical energy equivalent to natural gas energy). This costing is based on the 2024 capital project pricing. The emission from the remaining (i.e., 15%), used for cooking, can be offset by procuring carbon credits.
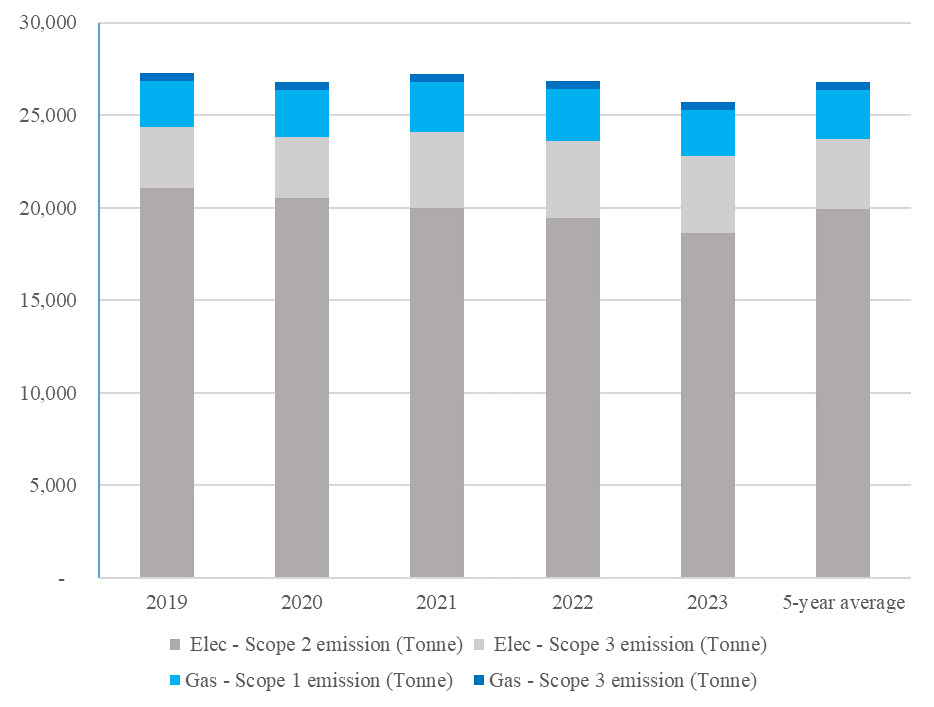
We observe that the usage of electrical energy almost doubles that of natural gas in the hospital, with yearly averages of 27.5GWh and 14.1GWh, respectively. Their 5-year average data are used for the costing analysis in the following section. Correspondingly, the hospital’s energy emissions are dominated by electricity use. Figure 2 shows the emissions of Scopes 1-3. Scope 2 emissions account for the majority of these emissions, primarily from purchased grid electricity for medical and building services, such as building cooling/heating, and lighting. Scope 1 emissions from natural gas consumption are approximately equal to Scope 3 emissions from electricity use, being less than one-fifth of Scope 2 emissions from electricity use. Scope 3, which involves natural gas consumption, is the smallest component. Over the five-year period from 2019 to 2023, emissions decreased, albeit modestly, with an average annual reduction of approximately 4%.

III. Main Findings
The decarbonisation of energy systems necessitates strategies that address both technological efficiency and market-based solutions (Arent et al., 2022; Blackburn et al., 2017). The electrification of natural gas boilers, for instance, requires consideration of the comparison of alternative technologies and energy pricing. Natural gas boilers typically operate at an efficiency of 85%, and electric heat pumps can achieve a coefficient of performance (COP) of 300% or higher (Holjevac et al., 2017). Alongside technological advancements, green power purchasing offers consumers an opportunity to buy zero-emission energy by opting for electricity contracts that supply 100% renewable energy at a slightly higher cost.
Furthermore, Australian Carbon Credit Units (ACCUs) provide entities with a market-based mechanism to meet emissions obligations by purchasing credits equivalent to their carbon reduction targets (CER, 2024). Together, these measures underscore the importance of integrating efficiency improvements with market-based instruments and consumer choices in achieving emissions reduction goals. Note that the case study is a major urban hospital with a helipad on the top of the hospital building and with very limited roof areas. Therefore, no onsite rooftop solar system is considered in this case study.
To facilitate the hospital achieving net-zero energy carbon emissions, twelve scenarios, shown in Table 1, were proposed based on varying combinations of green power purchase, carbon credits and electrification of natural gas boilers. Specifically, each scenario was constructed by varying key inputs - the percentage of renewable electricity, emissions factors, and the price of green power purchases. For each scenario, two options are considered for costing purposes. Option 1 utilises the Australian CCM to financially compensate for all energy emissions of the major urban hospital. Option 2 utilises both green power purchase and the CCM, where the former ensures that all grid electricity is emission-free, and the latter is applied to natural gas consumption. The costing results for the two options are calculated based on the CCM pricing, green power purchasing pricing, and energy emissions of each scenario.
Scenario 1 is set as the base scenario. There is no consideration for electrifying natural gas boilers in Scenarios 1 to 6; however, it is considered in Scenarios 7 to 12.
In the base scenario, a 27% renewable electricity supply is assumed (Queensland Government, 2024). The Scope 2 emission factor is 0.67 kg/kWh CO2-e, which represents the average emission per kilowatt-hour of electrical energy based on Australian Energy Market Operator data (AEMO, 2024), and the Scope 3 emission factor is 0.1 kg/kWh CO2-e (DCCEEW, 2024).
Currently, the additional cost for purchasing green power is $0.03/kWh. Without considering heating electrification, natural gas is used for hot water and steam generation. Note that natural gas is also used for cooking, regardless of whether boilers are electrified. For Option 1, considering the carbon credit pricing of $40 per tonne of emissions (CER, 2024), the annual cost would be $967,938. However, Option 2 would cost $945,974 a year. There is a cost difference of $21,964 between Option 1 and Option 2, showing a 2% cost reduction for Option 2. Similarly, for the higher renewable scenarios (2-6), Option 2 offers a cost reduction compared to Option 1. For Scenarios 3 and 4 (i.e., with renewable percentages of 50% and 60%), the cost reduction percentages (22% and 21%) are higher than in other scenarios. These results demonstrate a consistently lower cost in Option 2, with costing differences maximised at renewable percentages between 50% and 60%. This implies the existence of a critical tipping point at which a significant economic benefit can be generated. These findings underscore the importance of aligning investment strategies with the projection of renewable energy.
For the electrification scenarios (Scenarios 7-12), similar cost reduction patterns are observed. Option 2 provides a cost deduction from 2% to 26% across the scenarios. Scenarios 9 and 10 (i.e., with renewable percentages of 50% and 60%) also achieve the highest cost reduction percentages for Option 2 compared to Option 1.
For the cost variations between scenarios with and without electrification, when the renewable percentages are relatively low (27% and 40%), the costs are higher for scenarios with electrification (i.e., Scenarios 7 and 8) than those without electrification (i.e., Scenarios 1 and 2). This suggests that electrification does not generate strong competitiveness when the renewable percentage is lower. When grid renewable percentages are relatively low, it may be more expensive to compensate for emissions from electrification than to use natural gas heating. Once the renewable percentage exceeds 50%, the costs are lower for scenarios with electrification (i.e., Scenarios 10-12) than those without electrification (i.e., Scenarios 4-6), regardless of options. These findings offer further implications for hospitals’ capital budgeting and infrastructure investments. Hospital management should leverage electrification technologies to reduce costs and lower emissions. Policymakers should provide targeted incentives and support that align real options with national renewable energy targets, thereby facilitating a more effective transition to net-zero emissions.
IV. Conclusion
Aligned with Queensland’s 2030 target of achieving 50% renewable electricity, this study examined the economic outcomes of a major urban hospital’s efforts to achieve net-zero energy emissions. Twelve scenarios were analysed, exploring CCMs and green power purchasing, with six involving electrifications.
A higher grid renewable percentage is generally related to a lower cost for the same infrastructure. With a renewable percentage higher than 50%, electrification has a promising impact in reducing costs for net-zero energy emissions. The results show that combining green power purchase of electricity with a CCM for natural gas use yields lower operational costs compared to relying solely on a CCM for both electricity and natural gas. This study provides evidence-based, valuable insights and strategies for healthcare management on cost savings and emissions reduction within urban hospital systems, as well as for policymakers on providing efficient incentives and support to healthcare sectors to achieve this goal.
Acknowledgement
The authors thank the editor and reviewers for their valuable comments. Q.X. Wang acknowledges the grant of the Australian Research Council (Grant Number IE230100435).