

I. Introduction
In an increasingly interconnected global economy, geopolitical tensions between major powers have far-reaching consequences that extend well beyond national borders (Afonso et al., 2024). Among the most consequential of these rivalries is the ongoing strategic and economic friction between the United States and China (Li, 2025). What began as a trade dispute has evolved into a broader confrontation encompassing technology, finance, energy, military influence, and ideological competition (Chan & Kim, 2024). Consequently, investors, business leaders, and policymakers increasingly highlight Sino-US tensions as a critical factor influencing global stability and economic well-being (Rogers et al., 2024). While the political and economic dimensions of this rivalry have been extensively studied, its implications for global energy market uncertainty remain underexplored.
Energy markets are acutely sensitive to geopolitical instability. Supply chain disruptions, shifting alliances, sanctions, and fluctuating demand, all byproducts of geopolitical friction, can dramatically reshape expectations and volatility in global energy systems (Lee et al., 2024). Geopolitical developments in recent years have significantly influenced global energy markets, particularly in terms of price volatility (Gajdzik et al., 2024). Disruptions to energy exports, economic sanctions, and mismatches in supply and demand are among the primary mechanisms through which these events exert pressure on energy prices (Aslam et al., 2023; Banerjee, 2023). The growing frequency and intensity of such geopolitical shocks have spurred a surge in scholarly interest, with a rising number of studies seeking to unpack the complex relationship between international tensions and fluctuations in energy markets (Cao et al., 2020; Owjimehr et al., 2023). A central focus of this literature is the impact of geopolitical instability on oil price dynamics, reflecting the sector’s sensitivity to global uncertainty and the strategic nature of fossil fuel markets. in our opinion, however, the Sino-US tensions, given the scale and influence of both nations, also represent a unique and potent source of uncertainty that reverberates through oil, gas, and renewable energy markets alike.
This study therefore seeks to fill a critical gap by empirically investigating the link between Sino-US tensions and global energy market uncertainty. Using high-frequency, news-based indices that capture real-time geopolitical stress and energy-related uncertainty, we explore how geopolitical conflict between the world’s two largest economies is linked to market instability and potentially undermines global energy security. By doing so, we provide new insights into the intersection of international relations and energy economics, an area of growing relevance in an era of rising geopolitical risk and volatile energy transitions.
The paper makes three main contributions. First, while research has established clear connections between geopolitical events and fluctuations in energy markets, the connection between the Sino-US tensions and worldwide energy uncertainty remains a relatively unexplored area of study. This study broadens the existing literature on geopolitical risks and energy markets by underscoring the crucial impact of relations between superpowers on global energy stability. Second, one key reason for the lack of sufficient literature on the connection between Sino-US tensions and global energy market uncertainty is the absence of reliable measures of both factors. This study overcomes this challenge by utilizing a newly developed tension index (Rogers et al., 2024) to measure Sino-US tensions and a composite uncertainty index (Dang et al., 2023) to represent global energy market uncertainty. Third, by applying the general-to-specific vector autoregression (GETS-VAR) methodology (Asali, 2020; Asali & Gurashvili, 2020), this study provides compelling statistical evidence regarding Granger causality, long-term effects, and cumulative impulse response dynamics. This approach provides a new perspective on the topic.
The remainder of the paper is structured as follows. Section II presents the data and methodology employed for empirical analysis. Section III presents empirical findings. The final section concludes the study and provides policy recommendations based on the study findings.
II. Data and Methodology
A. Data
The empirical analysis uses monthly data from January 2001 to October 2022 for the Sino-US tension index and the energy uncertainty index. The Sino-US Tension Index, developed by Rogers et al. (2024), captures bilateral tensions based on media coverage following the Baker et al. (2016) method. The energy uncertainty index, from Dang et al. (2023), reflects global energy market uncertainty by aggregating energy-related concerns across 28 countries, following Ahir et al. (2022). Given the close link between Sino-US relations and broader economic policy uncertainty (Song et al., 2024), we also include the global economic policy uncertainty index by Baker et al. (2016) as a control. To account for changes in global energy prices, we include the global energy price index, sourced from the Federal Reserve Bank of St. Louis (FRED).
B. Methodology
To examine the connection between the Sino-US tension and global energy market uncertainty, we adopt a modified vector autoregression (VAR) model, employing the general-to-specific (GETS) approach, commonly referred to as the GETS-VAR method. This methodology, as described in a pioneering study by Asali et al. (2017), Asali (2020), and Asali and Gurashvili (2020), addresses the issue of over-parameterization in VAR models, enhancing the precision of subsequent inferences. The GETS-VAR framework allows for the analysis of Granger causality between key variables and facilitates the estimation of long-run (LR) steady-state impacts and cumulative impulse-response (CIR) effects. Thus, for this study, using both the Akaike information criterion (AIC) and Bayesian information criterion (BIC) for model selection with an optimal lag structure of three periods, we specify a 4-variable GET-VAR model in the following manner:
EUIt=π1+LEUI1∑i=1α1iEUIt−i+LUCT1∑i=1β1iUCTt−i+Ztγ1+εEUIt
UCTt=π2+LEUI2∑i=1α2iEUIt−i+LUCT2∑i=1β2iUCTt−i+Ztγ2+εUCTt
Here, EUI denotes the global energy market uncertainty index, and UCT represents the Sino-US tension index. EPU and GEPI capture economic policy uncertainty and the global energy price index, respectively, and are included as control variables (Z). The error terms are and
Granger causality (GC) between the variables is tested using F-statistics to assess the joint significance of coefficients in Equation 1 (UCT → EUI) and Equation 2 (EUI → UCT), controlling for EPU and GEPI. Long-run effects (LR) are calculated by solving for the long-run ratios of the dependent variables while controlling for the impacts of EPU and GEPI.
LR effect of UCT on EUI=β11−α1
LR effect of EUI on UCT=β21−α2
These calculations account for the dynamics of the dependent variable but exclude potential feedback effects from the other variables. Additionally, Cumulative Impulse Response (CIR) analysis is employed to capture both the individual long-term responses of one variable to the other, as well as the simultaneous dynamics of models (1) and (2). The CIR values were obtained as follows:
CIREUI→UCT=β1(1−α1)(1−β2)−α2β1
CIRUCT→EUI=β2(1−α2)(1−β1)−α1β2
The GETS approach iteratively refines the VAR system by removing lagged variables with t-statistics below one in absolute value, following Haitovsky’s rule. The revised model with constrained coefficients serves as the basis for estimating the effects of the EUI (UCT) on the UCT (EUI). Finally, the delta method, as outlined by Asali (2020) and Asali and Gurashvili (2020), was applied to compute the standard errors, enabling the statistical inference of the LR effects and CIR results.
III. Main Findings
We begin by summarizing the Augmented Dickey-Fuller (ADF) unit root test results used to assess the stationarity of the data series. As shown in Table 1, UCT, EUI, and EPU are stationary at level under both “intercept only” and “intercept and trend” specifications, while GEPI becomes stationary after first differencing. Hence, UCT, EUI, and EPU are used in level form, and GEPI in differenced form. Additionally, Figure 1 illustrates a marked rise in UCT over the past decade. Correlation plots are also presented for two purposes: to examine the strength and direction of relationships between variables and to detect potential multicollinearity. As shown in Figure 2, significant positive correlations exist between UCT and EUI, UCT and EPU, UCT and GEPI, EUI and EPU, and GEPI and EPU. Importantly, none of the coefficients exceed the 0.8 threshold, indicating no multicollinearity concerns among the regressors.
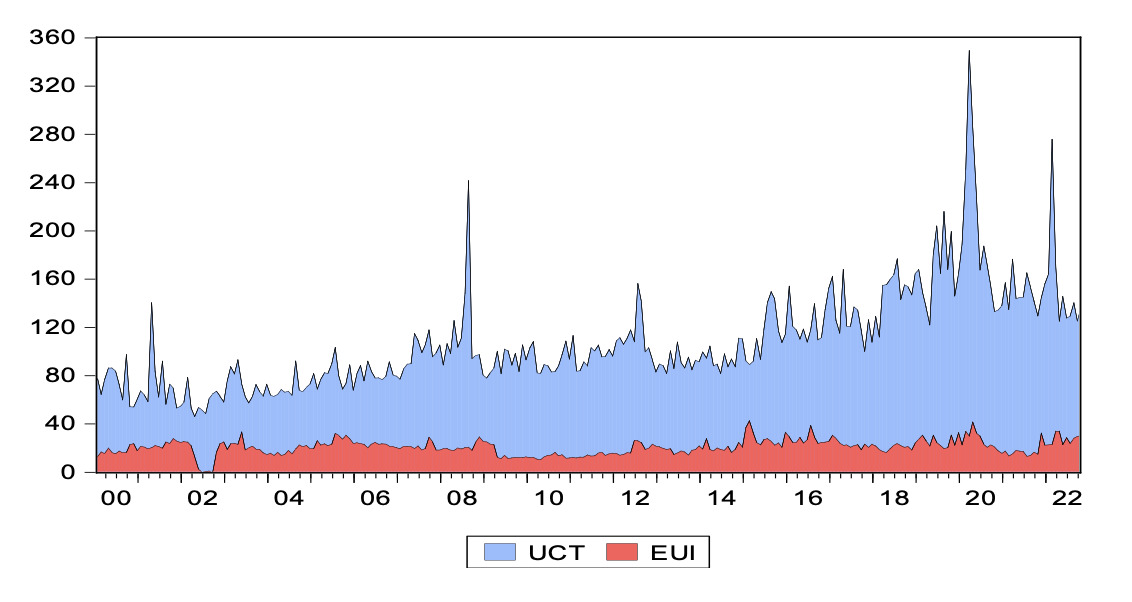
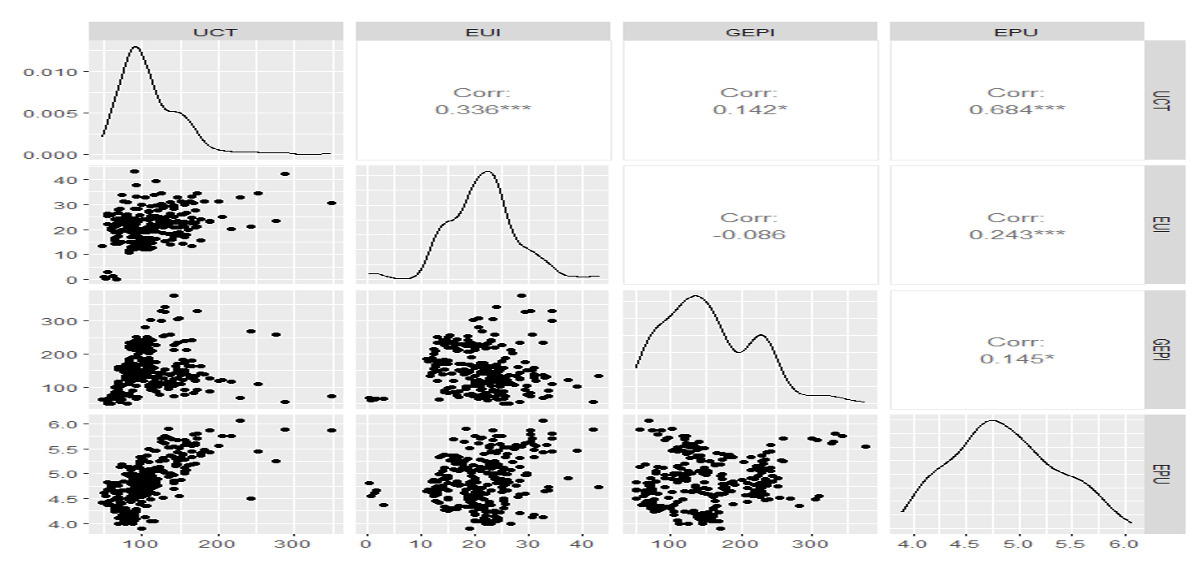
Table 2 presents the results from the GETS-VAR system, analyzing the relationship between Sino-US tensions and global energy market uncertainty while controlling economic policy uncertainty and energy prices. The Granger causality test shows a two-way causal link: Sino-US tensions significantly predict global energy market uncertainty, and vice versa.
Long-run estimates also reveal a statistically significant and positive impact in both directions. However, the influence of Sino-US tensions on global energy market uncertainty is stronger, suggesting that such tensions intensify global energy-related uncertainties, while rising energy uncertainty also fuels Sino-US tensions. The statement suggests a reinforcing feedback loop between Sino-US tensions and global energy uncertainty. Specifically, Sino-US tensions significantly intensify global energy-related uncertainties, likely due to heightened geopolitical risks, trade disruptions, and strategic competition. In turn, rising global energy uncertainty fuels further tensions between the two nations, possibly by increasing competition over energy resources or creating broader economic instability. This indicates a bidirectional and mutually reinforcing relationship between the two dynamics. Meanwhile, cumulative impulse responses are statistically insignificant and not used for inference. The findings support earlier research on the link between geopolitical tensions and energy uncertainty and confirm that Sino-US trade tensions impact global energy markets (e.g., Cai et al., 2022; Mignon & Saadaoui, 2024; Song et al., 2024; Zweig & Jianhai, 2005).
V. Conclusion
This study examines the complex interplay between Sino-US tensions and global energy market volatility using the GETS-VAR methodology for the period Jan 2001 to Oct 2022. The results indicate a two-way causal connection, with escalating tensions between China and the United States contributing to increased global energy market uncertainty, and vice versa. Importantly, the long-term effects of Sino-US tensions on global energy market uncertainty are more pronounced than the reverse, emphasizing the crucial influence of geopolitical disputes on energy market trends. These findings align with previous studies linking geopolitical events to energy market fluctuations and further emphasize the reciprocal relationship between major geopolitical players and global energy uncertainties.
To mitigate the impact of Sino-US tensions on global energy markets, several strategies are recommended. Strengthening international energy governance, including expanding the role of the International Energy Agency, can enhance coordination and crisis response. Prioritizing diplomatic engagement and trust-building, through trade agreements and joint energy projects, is essential. Diversifying energy sources and supply chains, especially via renewables and domestic infrastructure, will increase resilience. Both nations should adopt robust economic and energy policies, promote innovation in technologies like storage and alternative fuels, and encourage public-private collaboration. Greater transparency and information sharing can also stabilize markets and support sustainable energy systems amid geopolitical risks.