
I. Introduction
Climate change is projected to profoundly affect economic activities, significantly impacting households, businesses, and government policies (Byrne & Vitenu-Sackey, 2024). Berthold (2024) indicates that climate risks have a notable effect on macroeconomic outcomes. Fried et al. (2022) find that climate risk shocks are associated with a substantial decline in output. The UK’s Climate Change Act of 2008 establishes a legally binding framework aimed at reducing greenhouse gas emissions while enhancing the nation’s capacity to adapt to the effects of climate change (UK Government, 2022).
Our study contributes to the empirical literature by examining the macroeconomic implications of climate change within the UK context (e.g., Alessandri & Mumtaz, 2021; Berthold, 2024; Byrne & Vitenu-Sackey, 2024; Cashin et al., 2017; Hassler & Krusell, 2018; Rebonato et al., 2025). We use the TVP-VAR model, which, unlike previous studies that employ linear models, captures the dynamic and time-varying relationships between climate risk and macroeconomic variables. Furthermore, we utilize a novel Climate Risk Score Index developed by the London Stock Exchange Group (LSEG)[1] that integrates both physical climate risks (such as exposure to extreme weather events) and transition risks (including policy changes and market shifts toward low-carbon economies) into a composite score. This indicator allows for a more comprehensive examination of the multifaceted dimensions of climate-related risks, moving beyond the limited measures used in prior studies.
Our findings reveal that climate risk affects the UK economy over time, with the magnitude and significance of responses varying throughout the sample period. Climate risk consistently has a positive and statistically significant effect on economic policy uncertainty, with the greatest impacts observed in the early estimation periods and a marked increase following the 2016 Brexit referendum. During the global financial crisis, climate risk shocks resulted in negative and significant time-varying output responses. After 2013, these effects become positive but insignificant, persisting until the end of the analysis—highlighting the necessity for adaptive policy frameworks.
II. Data and Methodology
A. Data
In this study, the time-varying parameter vector autoregression (TVP-VAR) model is estimated using quarterly data covering the period from the fourth quarter of 1999 to the fourth quarter of 2024. The vector of endogenous variables is defined as:[2]
Y′t=[CLRISKt EPUt INTt FTSEt CPIt GDPt]
The core variable of the model is the Climate Risk Score Index Another key variable is the Economic Policy Uncertainty Index developed by Baker et al. (2016), which measures economic policy uncertainty through the frequency of relevant newspaper articles. In line with the study’s objectives, the vector of endogenous variables also includes several macroeconomic and financial indicators. The Bank of England base rate is used to represent the market interest rate, given its significant influence on borrowing costs and economic activity. To assess the impact of climate risk on the stock market, the Financial Times Stock Exchange (FTSE) All-Share Index is employed. Finally, the Consumer Price Index and real Gross Domestic Product are included to measure the effects of climate risk on prices and overall economic activity, respectively. All variables in the model, except for the interest rate, are transformed into their natural logarithmic forms.
Before estimation, the Lee and Strazicich (2003) unit root test—which accounts for two structural breaks—was conducted. As shown in Table 1, the results indicate that all variables are integrated of order one (I(1)), so each variable was included in the VAR model in its first-differenced form. The test also reveals significant structural breaks in variables linked to the GFC.
B. Methodology
To assess the effects of climate-related risks in the UK, this study utilizes the TVP-VAR model as proposed by Primiceri (2005). Unlike traditional linear VAR models, the TVP-VAR approach is capable of capturing changes in relationships between variables over time, providing a richer understanding of how these dynamics evolve. The model is formally specified following Casas and Fernandez-Casal (2022, p. 17):
Yt=A0,t+A1,tYt−1+…+Ap,tYt−p+Ut,t=1, 2,…, T,
where represents endogenous variable vector, is a matrix containing time-varying parameters, and is the innovation vector with a time-varying covariance matrix Unlike the TVP-VAR model based on Bayesian estimation, the time-varying coefficients are defined as a smooth function of time (see Robinson, 1989). The coefficients are estimated using nonparametric kernel regression, with parameters being determined locally at each time point. This process involves the estimation of weighted regressions, utilizing weights derived from a kernel Epanechnikov function along with a specified bandwidth parameter (Li & Racine, 2007).[3]
To derive time-varying impulse responses, the TVP-VAR model may be reformulated into world representation as follows (Casas & Fernandez-Casal, 2022, p. 18):
¯Yt=∞∑j=0Φj,tUt−j
Such that Matrix and matrix for horizons as for the constant model represent the time-varying coefficient matrices of the impulse response functions. It can be interpreted as the expected response of to an exogenous shock of ceteris paribus lags of when the innovations are orthogonal.
The orthogonal time-varying responses can be obtained from the Cholesky decomposition of the time-varying variance-covariance matrix This decomposition is a lower triangular matrix such that Finally using the orthogonalized innovations, the time-varying impulse response functions at horizon are computed as follows:
Ψh,t=Φh,tPt
III. Empirical Results
This section presents the findings of the TVP-VAR analysis, which explores the impact of climate risk on macroeconomic and financial variables. Prior to conducting the TVP-VAR analysis, a linear VAR model was estimated to examine how these variables respond to climate-related risks in the UK.
It is observed that positive climate risk shocks, have a significant impact on all variables. It is observed that positive climate risk shocks, denoted as have a significant impact on all variables. The response of is positive, indicating that increased economic policy uncertainty tends to accompany a rise in climate-related risks. For the response is negative, suggesting that interest rates decrease in reaction to heightened climate risk. The variable also shows a negative response, reflecting declining stock prices as climate risk intensifies. In contrast, demonstrates a positive response, implying that inflation rises following climate risk shocks. Lastly, climate risk exerts a negative and significant influence on suggesting that increasing climate risks are associated with a notable contraction in economic activity.[4]
The stability of the parameters in the linear model is assessed using the recursive Chow breakpoint test to justify the adoption of the time-varying model. The null hypothesis of no structural break is rejected, as the F statistics—when compared to the 10% critical value—exceed the threshold in certain periods. This suggests that a constant parameter specification may be insufficient to capture the effects of climate risk shocks on the UK economy.
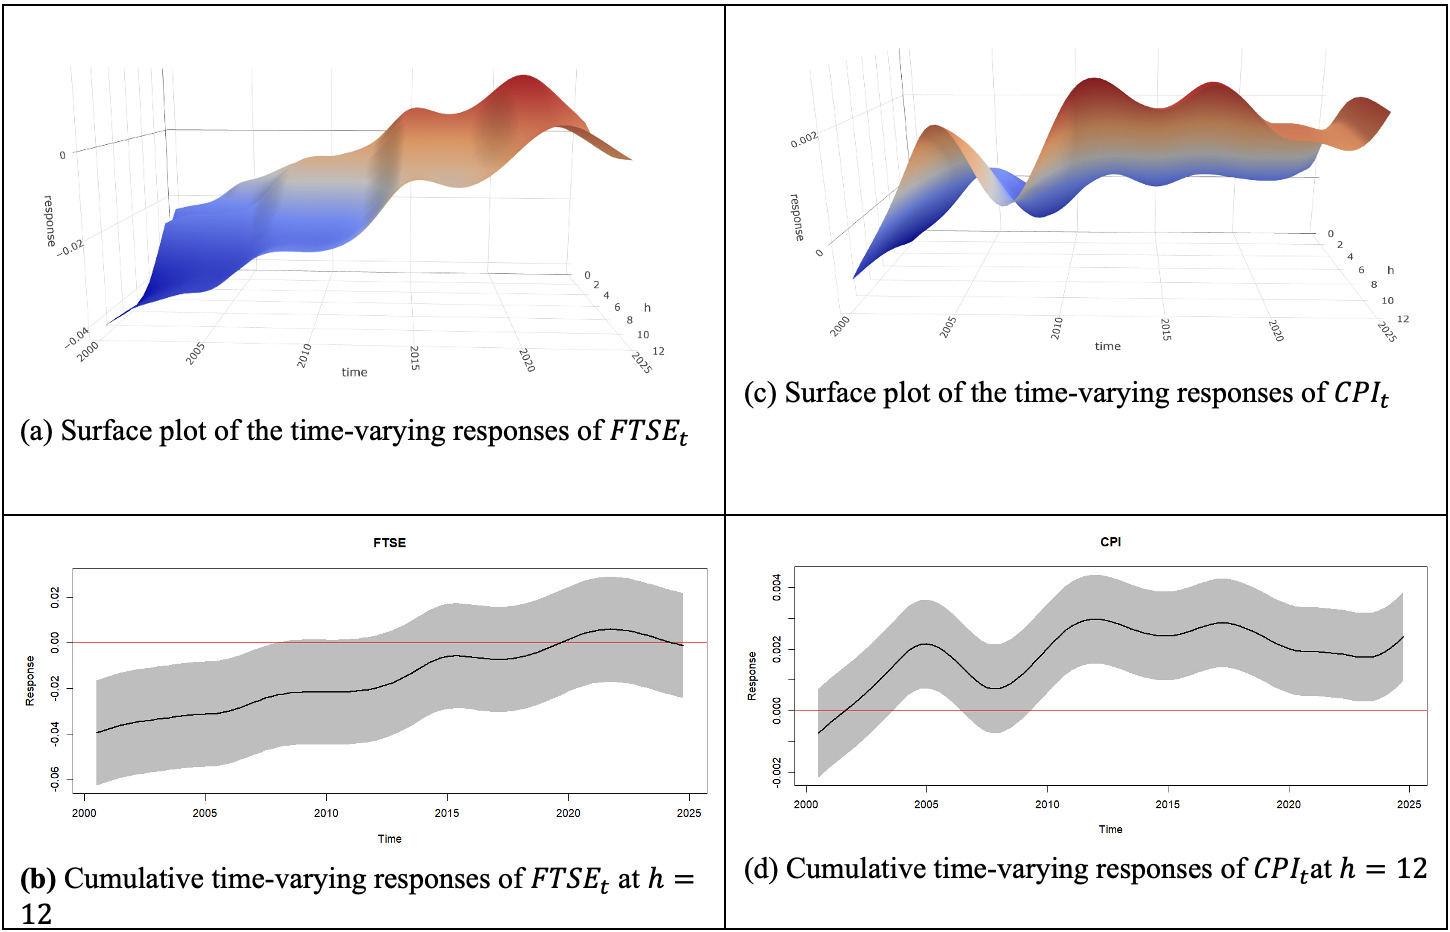
After confirming significant parameter instability, the TVP-VAR model is estimated to analyze how UK macro-financial variables respond to climate risk shocks over time. Subsequently, time-varying impulse responses are computed using Equation (4) and are presented in Figures 1 to 3. In these figures, Panel A displays surface plots of the accumulated responses: one horizontal axis represents the time span, while the other shows the time elapsed after the shock, for Accumulated responses at the 12th horizon are also plotted in Panel B, along with their 90% confidence bands, to evaluate significance throughout the analysis period.
The time-varying responses are consistent with the linear responses, confirming the significant impact of climate risk on the UK economy. However, the results demonstrate that the magnitude of these responses evolves over time.
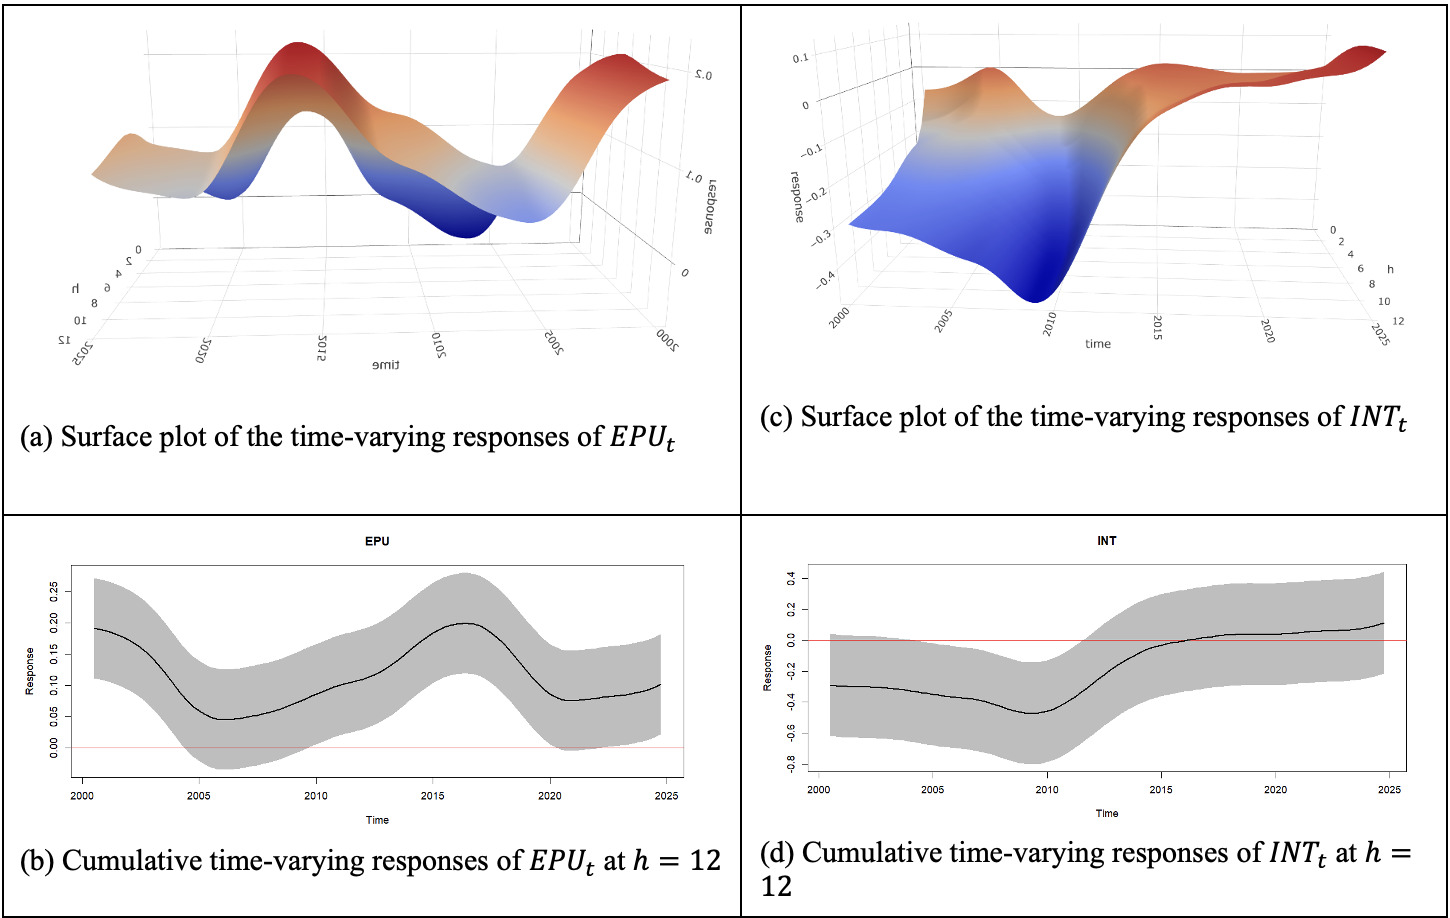

Figure 1, Panels A and B, display the time-varying impulse responses of to climate risk shocks. The analysis reveals that climate risk consistently exerts a positive and statistically significant influence on economic policy uncertainty throughout the sample period, mirroring the results obtained from the linear model. Notably, the impact of climate risk on reaches its peak during the initial years of estimation and experiences another marked increase around the time of the Brexit referendum in mid-2016.
The time-varying responses of to climate risk shocks, as shown in Figure 1, Panels C and D, generally indicate a negative but less significant effect. The confidence bands demonstrate that climate risk has a statistically significant negative impact only during the 2005 to 2011 period, which reflects the central bank’s accommodative monetary policy stance regarding climate risks at that time. After this period, positive climate risk shocks do not appear to have any significant effect.
Figure 2, Panels A and B, illustrate the responses of to climate risk shocks. The strongest negative response appears at the start of the estimation period, after which the adverse effect of climate risk diminishes and becomes statistically insignificant toward the period’s end. Panels C and D of Figure 2 depict the response of which is generally positive and statistically significant. These responses largely mirror those observed for The impact of climate shocks on inflation is initially insignificant but turns positive and statistically significant between 2003 and 2006, becoming statistically insignificant again during the GFC period. After the crisis, the responses remain consistently positive and significant through the remainder of the analysis period. These findings align with Berthold (2024), further confirming the pronounced macroeconomic effects of climate risks.
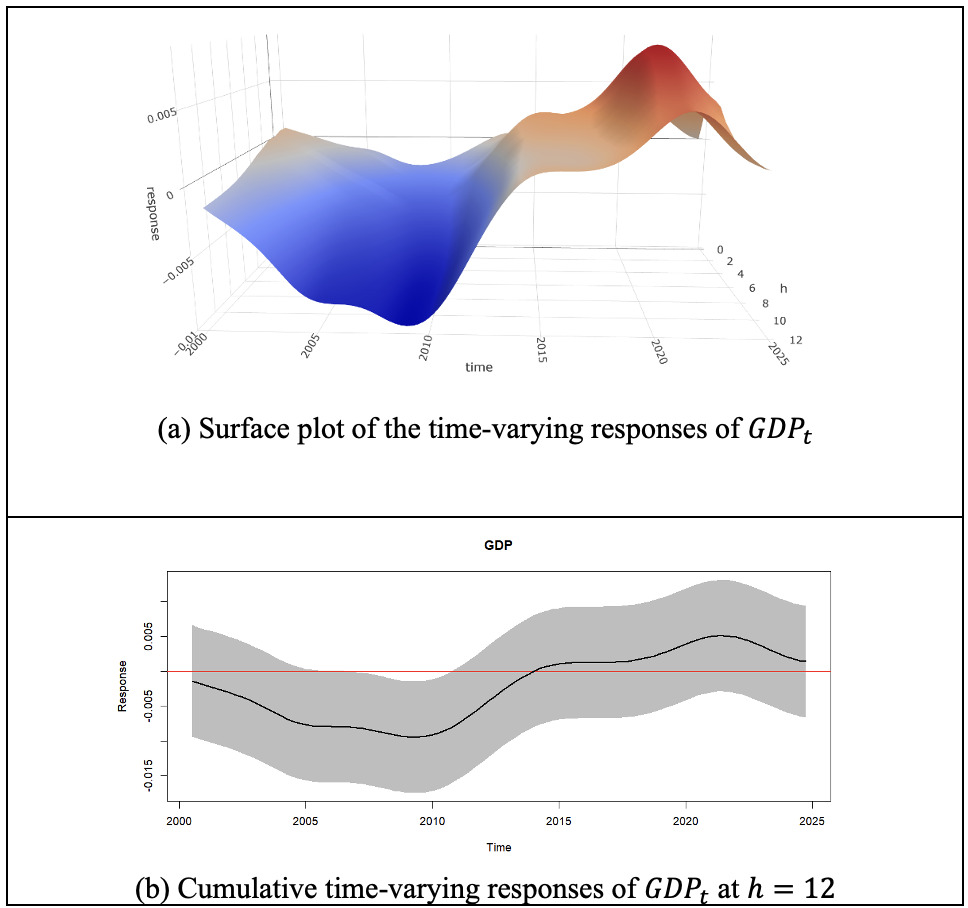
The time-varying responses of to climate risk shocks are illustrated in Figure 3 (see Panels A and B). These responses generally follow a pattern similar to the interest rate’s reaction, with the direction of the effect changing over time. Notably, the responses are negative from 2000 to 2013, reaching statistical significance only between 2008 and 2010, which coincides with the GFC period. This finding echoes Fried et al. (2022), who also report that climate risk shocks are associated with considerable declines in output. After 2013, the responses become positive but remain statistically insignificant through the end of the analysis period.

IV. Conclusion
This study examines the time-varying effects of climate risk on the UK economy using the TVP-VAR model. The results reveal significant variation in the impact of climate risk shocks, especially during periods of heightened economic policy uncertainty, such as around Brexit, and during GDP declines seen in the GFC period. By employing the Climate Risk Score, the study underscores the importance of integrating both physical and transition climate risks into macroeconomic analysis.
Our findings highlight the necessity for UK policymakers to adapt monetary and fiscal strategies in response to climate risks. The evidence shows that climate risk shocks can increase policy uncertainty, reduce output, and destabilize financial markets during times of crisis. To address these challenges, policymakers should incorporate climate risk assessments into macroeconomic forecasting and policy design, maintaining a flexible policy framework. This includes enhancing transparency, embedding climate scenarios within interest rate and fiscal planning, and deploying measures such as green investments and resilience initiatives to buffer the economy against climate-related shocks. By adopting a proactive approach that integrates climate considerations into policy formulation, the UK can better safeguard economic stability in the face of climate challenges.
This index is scaled from 0 to 100, designed to assess an entity’s exposure and vulnerability to climate-related risks, lower scores indicate lower risk, while higher scores signify greater climate risk.
The ordering of the variables is critical in the identification of shocks in Cholesky ordering. Based on the paper’s main objective, the is ranked first because it is regarded as an exogenous shock affecting the economic activity.
The use of nonparametric regression provides significant advantages. First, despite Bayesian methodologies proposed by Primiceri (2005) and Cogley and Sargent (2005), this estimator can produce entirely data-driven estimates without specifying the prior distribution of the coefficients (Caporale et al., 2024). Furthermore, compared to the Bayesian approach, which typically assumes that time-varying parameters follow a random walk process, this technique makes no prior assumptions about the coefficients’ law of motion, allowing it to adapt flexibly to complex or unknown data-generating processes (Fan, 2018; Robinson, 1989).
These test results are not reported in this paper but are available upon request from corresponding author.