I. Introduction
India’s power sector has undergone significant transformation, striving for reliable, affordable, and sustainable energy. In July 2021, the Government of India introduced the Revamped Distribution Sector Scheme (RDSS) to ensure a reliable and quality power supply by enhancing power distribution efficiency. One key objective of RDSS is to reduce aggregate technical and commercial (AT&C) losses to 12%-15% across all states in India.[1] However, the success of these efforts varies among states due to differences in their approaches to managing AT&C losses.[2] If states fail to converge in reducing AT&C losses despite varied management policies, the primary goal of minimizing inter-state disparities in AT&C losses will be compromised, thereby hindering the development of a robust energy sector.
Initiatives to reduce AT&C losses include improving metering and billing systems and promoting energy efficiency. Despite these efforts, there are significant variations in AT&C losses and Per Capita Electricity Consumption (PCEC) across Indian states. High-income states benefit from advanced power infrastructure and capacity-building capabilities. Historically, India’s power sector has faced substantial losses, necessitating a thorough examination of AT&C loss dynamics across states. Evaluating whether all states follow a consistent path toward minimizing AT&C losses is crucial for effective policy formulation, which we assess using the concept of economic convergence.
Economic convergence occurs when poorer regions grow faster than wealthier ones, leading to an equalization over time. This phenomenon has been widely studied in economics. However, literature on the convergence of AT&C losses is scarce in India and globally. Related literature on the energy sector addresses issues such as per capita energy consumption and productivity, which are pertinent to AT&C losses. For instance, Meng et al. (2013) demonstrated convergence in per capita energy use among 25 OECD countries from 1960 to 2010. Bhattacharya et al. (2018) observed energy productivity convergence in some Indian states and UTs from 1988 to 2016, with divergence noted in others during the same period. Energy productivity is crucial for enhancing electricity access, fostering economic activity, and reducing carbon dioxide emissions. Employing the stochastic conditional convergence method, Akram et al. (2020) found evidence of convergence in various types of per capita energy consumption in India from 1971 to 2017, accounting for two structural breaks.
Jangam et al. (2020) suggest that electricity consumption patterns in Indian states, based on data from 18 states between 1970 and 2015, are converging towards a common steady state. A comprehensive body of literature, including works by Markandya et al. (2006), Liddle (2009), and Jakob et al. (2012), has examined energy or electricity intensity convergence in developed and developing countries. Mohammadi & Ram (2012, 2017) provide extensive reviews of per capita energy consumption convergence literature. Szajt et al. (2018) explored the convergence of electricity consumption, power transmission and distribution losses, and emissions in European countries, identifying an apparent convergence in distribution losses.
Following the club convergence literature (Jangam et al., 2020; Panopoulou & Pantelidis, 2009; Phillips & Sul, 2007a, 2007b), our study investigates the existence of convergence in AT&C losses across Indian states, utilizing data from 2009 to 2021. Applying the PS method, our research identifies club convergence rather than overall convergence in AT&C losses. This study is the first to analyze convergence in the Indian power sector specifically relating to AT&C losses. It contributes empirically to the literature on AT&C loss convergence by employing the PS Club Convergence method. The findings will assist policymakers in making informed, state-specific decisions to reduce losses and enhance the overall efficiency of India’s power sector.
II. Data and Methodology
A. Data
The state-wise AT&C losses data are assembled from the ‘Report on Performance of Power Utilities’, Power Finance Corporation Ltd (2009–2021). We drop all the north-eastern states, Jammu & Kashmir, and Union Territories to avoid data issues[3]. We thus have 21 states resulting in a panel of 273 (21 states*13 years) observations.
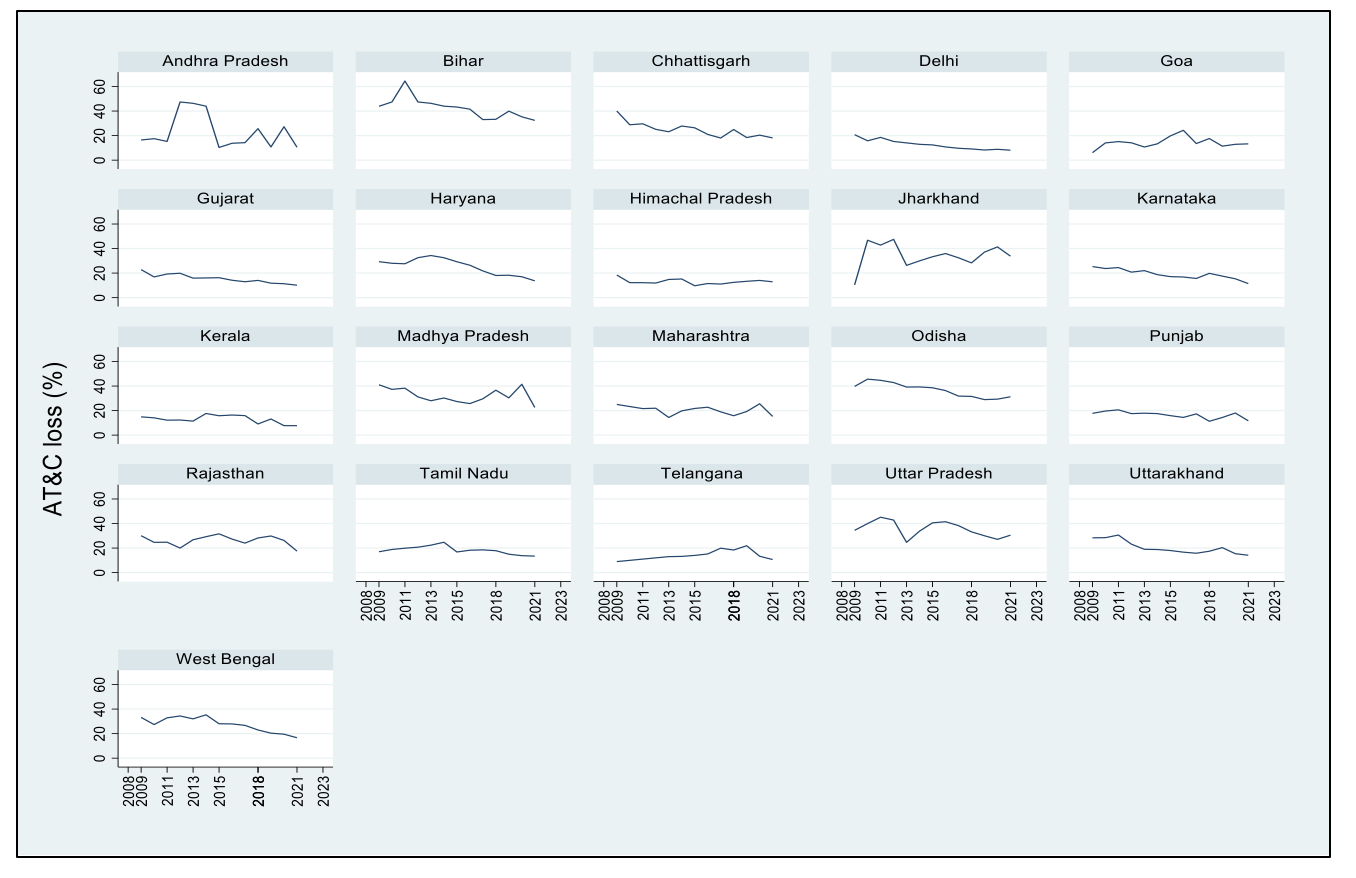
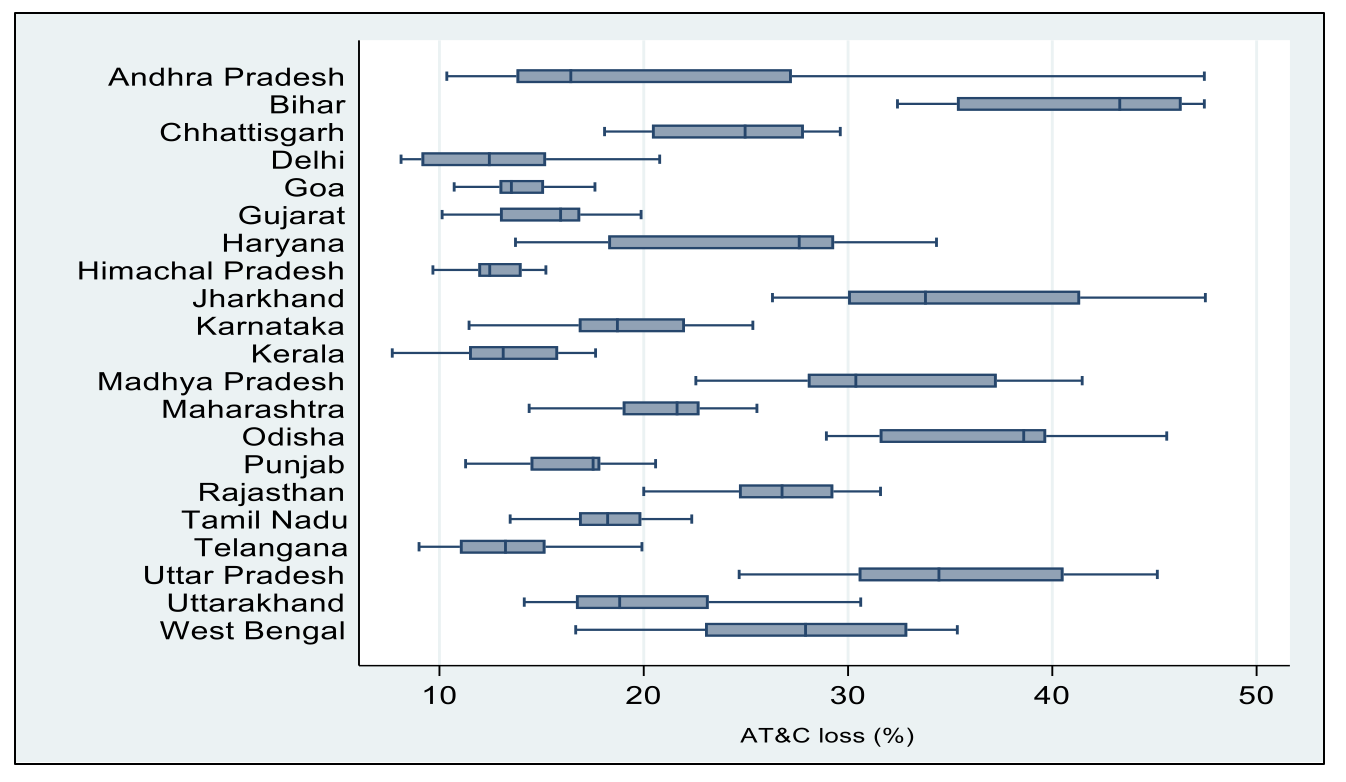
Figure 1 plots the trend in AT&C losses, suggesting a declining loss trend for most states since 2009, barring a few exceptions. Further, Figure 2 shows that the richer states, such as Gujarat, Karnataka, and Maharashtra, report lower average AT&C losses than the relatively poor states (e.g., Bihar, Odisha, and Uttar Pradesh)[4]. Since a declining trend has been observed in AT&C losses, it would be interesting to investigate if any catching-up mechanism is taking place.


B. Methodology
The PS method is a regression-based convergence test that enables the endogenous selection of states, thereby isolating them into potential converging clubs. Additionally, this test examines the presence of overall convergence. In accordance with Panopoulou & Pantelidis (2009), the state panel dataset is structured as follows:
Zit=Variable (AT&C losses);i = 1, … , N; t = 1, . . . , T;N=numbers of states;andT=sample size.
is the AT&C losses expressed in percentage. can be fragmented into systematic and transitory chunks, presented in Equation (1):
Zit=pit+qit
With a specific transformation, the common and idiosyncratic chunks in the panel are torn apart in Equation (2):
Zit=(pit+qitεt)εt=λitεt, for all i,t
Now, contains two components—common and idiosyncratic or factor loadings. Both these components vary with time. measures the distance between and Such structure allows us to examine if converge to a constant
Using the above information[5], we construct the following null and alternative ) hypotheses of convergence:
Η0: λi=λ and α≥0;
ΗA: λi≠λ for some i and/or α<0
indicates convergence for all states, and suggests no convergence for some states. guarantees convergence, albeit at a slow rate, in case can fit both club convergence as well as overall divergence. The club convergence suggests the possibility of one or more subsets of states under examination forming convergent groups, with positive rates of convergence, at different factor loadings.
PS test the null hypothesis using regression, presented in Equation (3).
log(Y1Yt)−2logL(t)= ˆc+ˆblogt+μt
where, The above regression is run after dropping a fraction (r) of the total observations based on the rule proposed by PS. In our case, we set
III. Results
Implementing regression specified in Equation (3), the first row of Table 1 shows that the value of the t-statistic (-38.018) is less than −1.65, and the point estimate is -1.159. This implies that the null hypothesis of convergence for the whole sample of states is rejected at the 1% level. Next, we examine the possibility of convergence across any subgroup of states, i.e., club convergence, using the proposed clustering algorithm of the PS method. We have identified two distinguishable clubs for our sample of states and study period. Club 1 consisting of five states follows a convergent path in AT&C losses since is insignificant (0.221), and is positive (0.147). Similarly, with an insignificant (-0.125) and negative (-0.037), Club 2—formed by sixteen states— follows a different convergent path compared to Club 1[6]. Since there is no empirical support for the merging of these two clubs, we conclude that these two converging clubs of the state produce two different equilibrium paths for AT&C losses.
The emergence of the two clubs illustrates that reductions in AT&C losses are being addressed differently. Specifically, low-income states (Club 1) experience a higher average loss percentage compared to high-income states (Club 2). The overall management of distribution varies between the two groups. For instance, high-income states, benefiting from superior energy infrastructure, prioritize Operation and Maintenance to deliver quality electricity to consumers. Conversely, in low-income states, distribution management focuses on capital expenditure and enhanced surveillance to mitigate electricity theft.
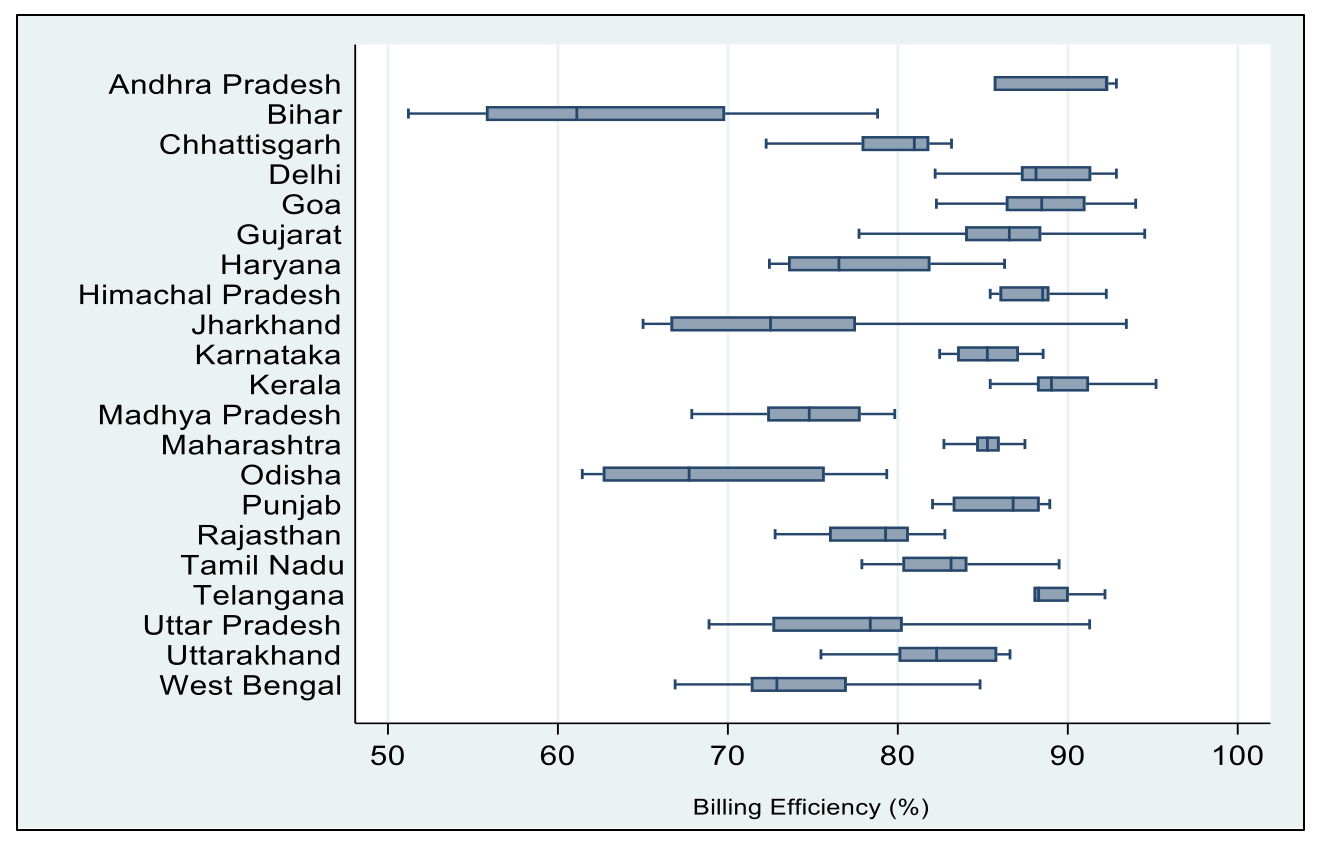
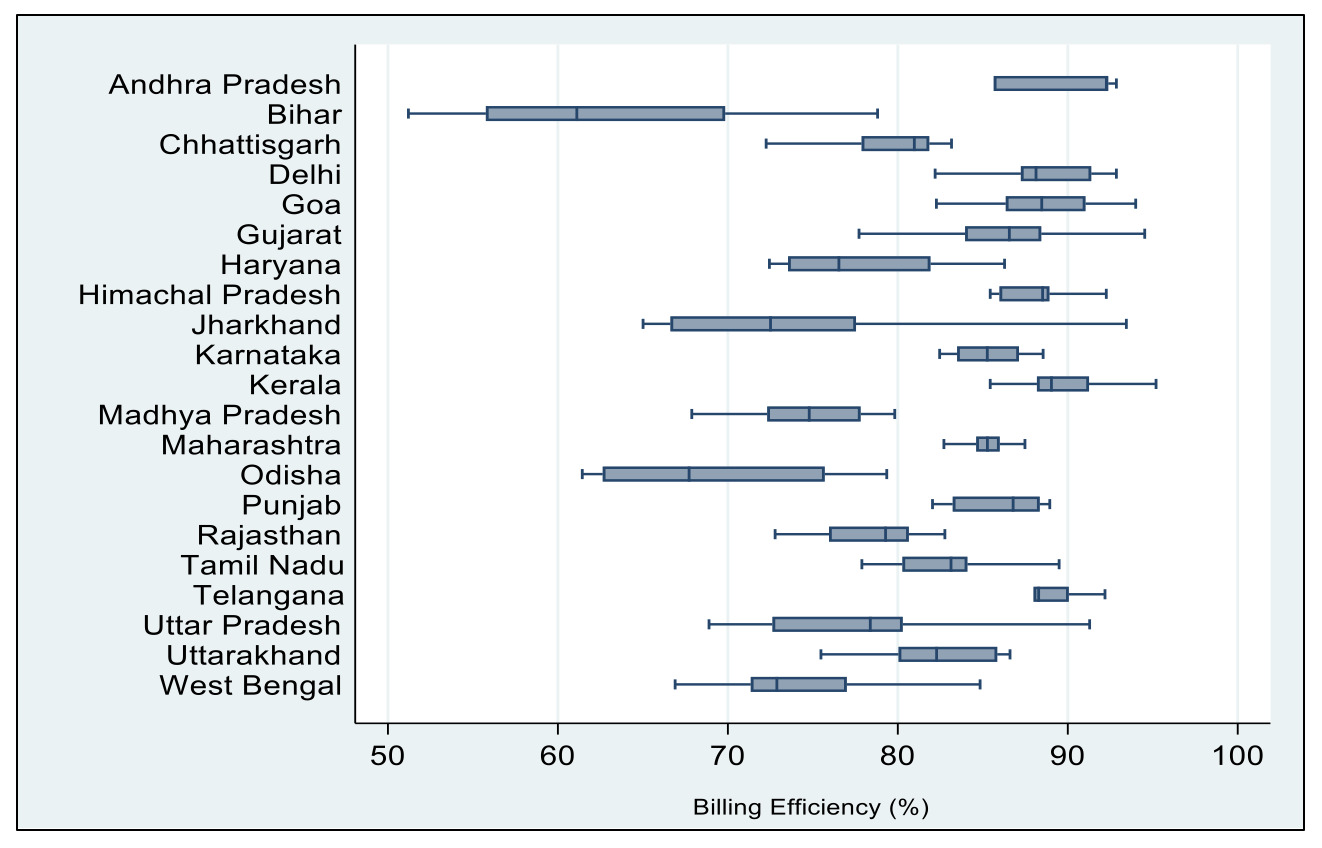
There is no previous evidence of AT&C losses convergence in India. Therefore, we cannot compare our results directly to any studies. However, our study can be read with other Indian studies, such as Bhattacharya et al. (2018), Akram et al. (2020), and Jangam et al. (2020), that deal with certain aspects of convergence in the energy sector. The formation of two converging clubs is plausible on the following grounds. First, Club 1 contains states with relatively lower per capita income than the states of Club 2. States within a club are highly likely to follow similar strategies to minimize AT&C losses. Our results suggest that states tend to be homogeneous within a club based on income. For instance, Club 1 has low-income states (with high AT&C losses) that converge to a specific equilibrium path and are different from Club 2 (high-income states), which converge to a different path. However, regardless of the state’s income status, there is a central target for reducing AT&C losses in the range of 12%-15%. Second, the Billing Efficiency (BE) data for states of Club 1 remains lower compared to their counterparts in Club 2. Higher BE lowers the AT&C losses.[7] Figure 3 reports that states of Club 1 exhibit lower levels of BE than those of Club 2. On this ground, the formation of two clubs looks conceivable. Third, plausible reasoning indicates that reporting power theft and meter mishandling is rampant in rural areas, resulting in higher AT&C losses. Corroborating this, we find the proportion of the rural population is higher in Club 1 than in Club 2. It is now clear why some states follow specific convergence paths in AT&C losses.
A. Robustness check
Many studies follow a common rule of discarding about one-third (the first 20-30% of the data points) of the time series, based on recommendations from Phillips and Sul (2007b). We followed the same rule when estimating results, as reported in Table 1. For shorter time series, such as ours with 13 years of state panel data, removing too many data points can be a problem. Furthermore, if we expect convergence to be fast due to various proactive measures taken by states to reduce AT&C losses, we may need to remove less data. Therefore, instead of 30%, we removed 20% of the data and examine the club convergence results in Appendix Table A. This allows us to test the sensitivity of our results to some degree. The message is unambiguous, suggesting that our main conclusions remain stable with different amounts of data trimming. Put simply, Table A gives the same club classification as Table 1.
IV. Conclusion
The analysis of Aggregate Technical & Commercial (AT&C) losses is essential for sustaining India’s power sector and assisting policymakers in developing comprehensive energy policies. Findings from the PS club convergence method applied to data from 21 major states from 2009–10 to 2021–22 indicate that AT&C losses are not converging uniformly across all states; instead, two distinct converging clubs have emerged.
These two converging clubs suggest that, despite differences among Indian states, there are shared socio-economic factors influencing AT&C losses. This insight allows policymakers to thoroughly examine the policy preferences of each group. Furthermore, the formation of these clubs indicates a pathway toward overall convergence. As AT&C losses decrease, distribution companies can achieve higher revenue, minimizing the need for tariff increases. In turn, enhanced power quality can stimulate industrialization, trade, and commerce, thereby fostering economic growth. High AT&C losses are primarily due to inefficiencies in billing and collection processes. If losses are converging—at least within groups—it implies an improvement in these efficiencies. Thus, we can infer the success of energy efficiency policies across Indian states.
While the Ministry of Power enforces nationwide regulations, states can set their own efficiency targets and tariff rates based on their budgets. State-level initiatives often align with national objectives, but governance remains a critical factor in the energy efficiency gap between states. To expedite the convergence of AT&C losses, policies could incorporate penalties for states that lag behind, ensuring more uniform and effective implementation of reforms.