
I. Introduction
As Africa’s largest oil producer, Nigeria faces a pressing dilemma between its economic dependence on fossil fuels and the urgent need for environmental sustainability. Despite its significant crude oil reserves, the country grapples with inadequate refining capacity, which leads to heavy reliance on imported petroleum products and illegal refining activities (Olanipekun et al., 2017; Usman & Akadiri, 2022). This inefficiency exacerbates environmental degradation, resulting in deforestation, frequent oil spills, rampant gas flaring, and heightened air pollution. Given Nigeria’s economic structure where resource rents, urbanization, foreign direct investment (FDI), and economic growth are key drivers of development it is crucial to understand their collective influence on environmental quality.
Refining capacity plays a critical role in the efficiency, sustainability, and environmental impact of petroleum processing. Countries with inadequate or outdated refining infrastructure often rely more heavily on crude oil exports and imported refined products. In oil-rich developing nations like Nigeria, this gap is partially filled by illegal, unregulated artisanal refining, which significantly contributes to environmental degradation, including deforestation, oil spills, gas flaring, and air and water pollution. Thus, refining inefficiencies not only impact energy supply but also exacerbate environmental harm.
The connection between refining capacity and environmental quality warrants empirical investigation for several reasons. Existing studies, such as Omozue (2021) and Anejionu et al. (2015), highlight the severe environmental consequences of poor refining practices, such as air pollution and deforestation in Nigeria’s Niger Delta. While much of the literature focuses on oil extraction and consumption, fewer studies examine the role of refining capacity in shaping environmental outcomes, presenting a significant gap in research.
Investigating this link has important policy implications. Upgrading and modernizing refinery infrastructure could mitigate environmental harm and should be considered an economic and environmental priority. Nosheen et al. (2024) noted that investments in cleaner energy infrastructure can reduce the environmental externalities of fossil fuel-dependent economies. Furthermore, efficient refining can ease the transition to clean energy by reducing reliance on illegal refining and fuel imports, aligning with sustainable development goals and climate change mitigation efforts.
This study is motivated by Nigeria’s ongoing environmental challenges linked to oil refining and their broader implications for sustainable development. While previous studies have examined the environmental impacts of oil production, limited research explores refining capacity’s role in shaping ecological outcomes. Refining inefficiencies in resource-dependent economies like Nigeria lead to higher carbon emissions and ecological degradation, emphasizing the need for improved governance in the energy sector.
This study investigates the impact of refining capacity on Nigeria’s environmental quality from 1970 to 2023 using the Mixed Quantile-on-Quantile Regression (MQQR) approach. Its novelty lies in its pioneering examination of refining capacity’s impact on environmental quality in Nigeria, particularly using MQQR to explore non-linear and asymmetric relationships across different quantiles. This research builds on the Environmental Kuznets Curve (EKC) framework and offers valuable insights for policymakers on sustainable refining practices and regulatory frameworks.
II. Data and Methodology
To achieve the study objectives, we employed a rigorous methodology. Crude oil refining capacity and the Load Capacity Factor (a proxy for environmental quality) were obtained from ourworldindata (https://ourworldindata.org/) and the Global Footprint Network database, respectively. Other control variables, including urbanization, natural resources rent, GDP per capita (as a measure of economic growth), and foreign direct investment (FDI), were sourced from the World Development Indicators (WDI) database based on data availability, utilizing annual series from 1970 to 2023.
To address heteroskedasticity and minor sample bias, we first took the logarithm of the annual series and subsequently converted them into quarterly frequency by employing the quadratic match sum method. Consequently, we utilized the quarterly series from Q1 1970 to Q4 2023 in our empirical analysis, as outlined in Equation (1):
\[LCF = f(RC,GDP,FDI,TNRR) \tag{1}\]
This study analyzes the influence of RC, GDP, FDI, and TNRR on in Nigeria by utilizing the innovative MQQR developed by Alola et al. (2023). This method examines the non-linear effect of several explanatory variables on a target variable using quantiles of all variables. More specifically, the MQQR captures the impact of the quantiles of each explanatory variable on the quantiles of a target variable by controlling the effects of the quantiles of the remaining explanatory variables. For this study, the MQQR can be modeled as follows:
\[\begin{aligned} {LCF}_{t} &= X_{0}\left( ⍬,\phi_{s} \right) + X_{1}\left( ⍬,\phi_{1} \right)\left( {RC}_{t} - {RC}^{\phi_{1}} \right)\\ & \quad + X_{2}\left( ⍬,\phi_{2} \right)\left( {GDP}_{t} - {GDP}^{\phi_{2}} \right)\\ & \quad + X_{3}\left( ⍬,\phi_{3} \right)\left( {FDI}_{t} - {FDI}^{\phi_{3}} \right)\\ & \quad + X_{4}\left( ⍬,\phi_{4} \right)\left( {TNRR}_{t} - {TNRR}^{\phi_{4}} \right)\\ & \quad + \left( ⍬,\phi_{s} \right)\varepsilon_{t} \end{aligned}\tag{2}\]
where and symbolize the quantiles of the LCF, RC, GDP, FDI, and TNRR, respectively. In addition, denotes the constant, are the slope, and is the error terms.
The study uses quantile regression (QR) to compare QR estimates with the average MQQR (AMQQR) estimates, following Özkan et al. (2024), to verify the reliability of MQQR estimates. The QR is modeled as follows:
\[\begin{aligned} {LCF}_{t} &= Y_{0}(⍬) + Y_{1}(⍬)\left( {RC}_{t} \right) + Y_{2}(⍬)\left( {GDP}_{t} \right)\\ & \quad + Y_{3}(⍬)\left( {FDI}_{t} \right) + Y_{4}(⍬)\left( {TNRR}_{t} \right)\\ & \quad + (⍬)u_{t} \end{aligned}\tag{3}\]
signifies the constant term, and represent the slope coefficients, and indicates the error term.
III. Empirical Results
As part of the preliminary analysis, descriptive statistics of the variables were examined, alongside a test for multicollinearity in the model presented in Equation (1).
Table 1 provides the descriptive statistics for LCF, RC, GDP, FDI, and TNRR, showcasing their central tendencies, dispersion, and distributional properties. The mean and median values are closely aligned for most variables, except RC (-1.389) and FDI (-0.400), which exhibit left-skewed distributions. Standard deviations highlight higher variability in FDI (0.151) and TNRR (0.171) compared to GDP (0.055). Notably, RC (3.569) and FDI (3.275) display slight leptokurtosis, while LCF (1.616) and GDP (1.468) are more platykurtic. The Jarque-Bera test identifies significant deviations from normality (p ≤ 0.01 for most variables), and the BDS test detects non-linear dependencies, emphasizing the limitations of linear models. These findings justify the use of the innovative MQQR approach, which captures heterogeneous and non-linear relationships across varying quantiles, providing deeper insights into the complex interdependencies among the variables.
Table 2 presents the correlation matrix and VIF values to assess potential multicollinearity among RC, GDP, FDI, and TNRR. The correlation coefficients indicate weak relationships among the variables, with the highest positive correlation observed between RC and TNRR (0.174) and the highest negative correlation between TNRR and GDP (-0.187). Other correlations remain relatively low, suggesting minimal collinearity.
The VIF values further confirm the absence of severe multicollinearity, as they range between 1.039 and 1.082, well below the standard threshold of 10. This indicates that the independent variables in the model are well-suited for estimation without significant redundancy. These findings justify the adoption of MQQR, which allows for a robust exploration of non-linear and quantile-dependent relationships without concerns about inflated variance due to multicollinearity.
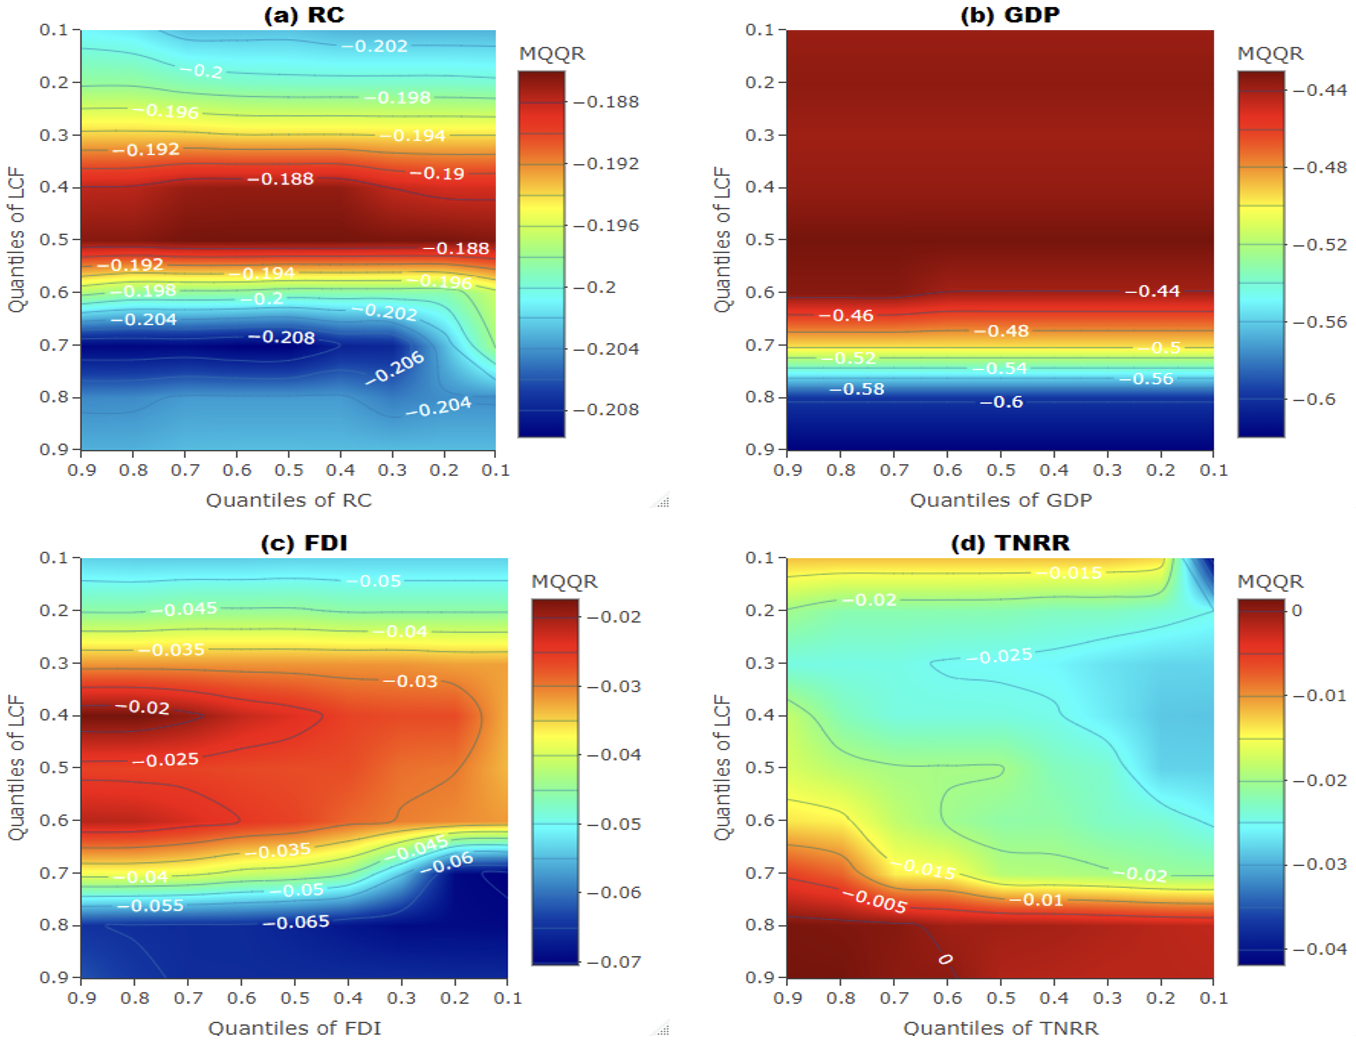
Figure 1 illustrates the MQQR estimates for the relationship between LCF and its key determinants RC, GDP, FDI, and TNRR across different quantiles. The results reveal significant heterogeneity, indicating that these factors influence environmental sustainability differently across various levels of the LCF distribution.

Panel A (Figure 1) depicts the relationship between RC and LCF, showing a predominantly negative effect that intensifies in the middle and upper quantiles. The strongest negative coefficients (-0.188 to -0.194) suggest that excessive resource consumption reduces environmental sustainability by placing greater pressure on ecological systems. This aligns with studies like Hilili et al. (2024) and Akadiri et al. (2024), which found that increasing resource extraction accelerates environmental degradation and limits sustainable growth. The more pronounced negative impacts at higher quantiles highlight the ecological risks faced by resource-dependent economies.
Panel B examines the effect of GDP on LCF (Figure 1), revealing a consistently negative relationship, with the most substantial adverse effects (-0.6 to -0.44) occurring at higher GDP quantiles. This suggests that economic growth contributes to environmental depletion, especially when driven by industrialization and urban expansion. The findings support the EKC hypothesis, where economic expansion initially worsens environmental degradation before a potential turning point (Armeanu et al., 2018). However, the absence of a visible turning point in this study indicates that economic growth in the region has yet to transition toward sustainability.
Panel C explores the impact of FDI on LCF (Figure 1), showing a moderate adverse effect, particularly in the middle quantiles (-0.02 to -0.025). While FDI inflows contribute to economic development, their environmental impact depends on the sectoral allocation of investments. FDI exacerbates environmental degradation if directed toward resource-intensive or high-emission industries. These results align with the findings of Omri & Kahouli (2014) and Shahbaz et al. (2018), who argue that the environmental consequences of FDI vary depending on host country regulations and the nature of investments. Policymakers must design strategies to encourage green and technology-driven FDI to mitigate environmental harm.
Panel D assesses the relationship between TNRR and LCF (Figure 1), revealing a negative impact that intensifies in higher quantiles (-0.005 to -0.04). This finding supports the resource curse hypothesis, where economies heavily reliant on natural resource rents often experience lower environmental sustainability due to inefficient resource management, over-extraction, and a lack of investment in sustainable development (Erdoğan et al., 2021). Strong adverse effects suggest that resource-rich countries need robust governance frameworks to ensure that natural wealth contributes to long-term sustainability rather than environmental degradation.
The MQQR results highlight the quantile-dependent nature of economic and environmental interactions. The findings indicate that GDP, RC, and TNRR exert more substantial adverse effects on environmental sustainability at higher quantiles, underscoring the increasing environmental pressures faced by economies with high resource dependence and economic expansion. This study reinforces the trade-offs between economic growth and sustainability, emphasizing the need for targeted policies that promote green economic growth, efficient resource management, and environmentally responsible investment strategies.
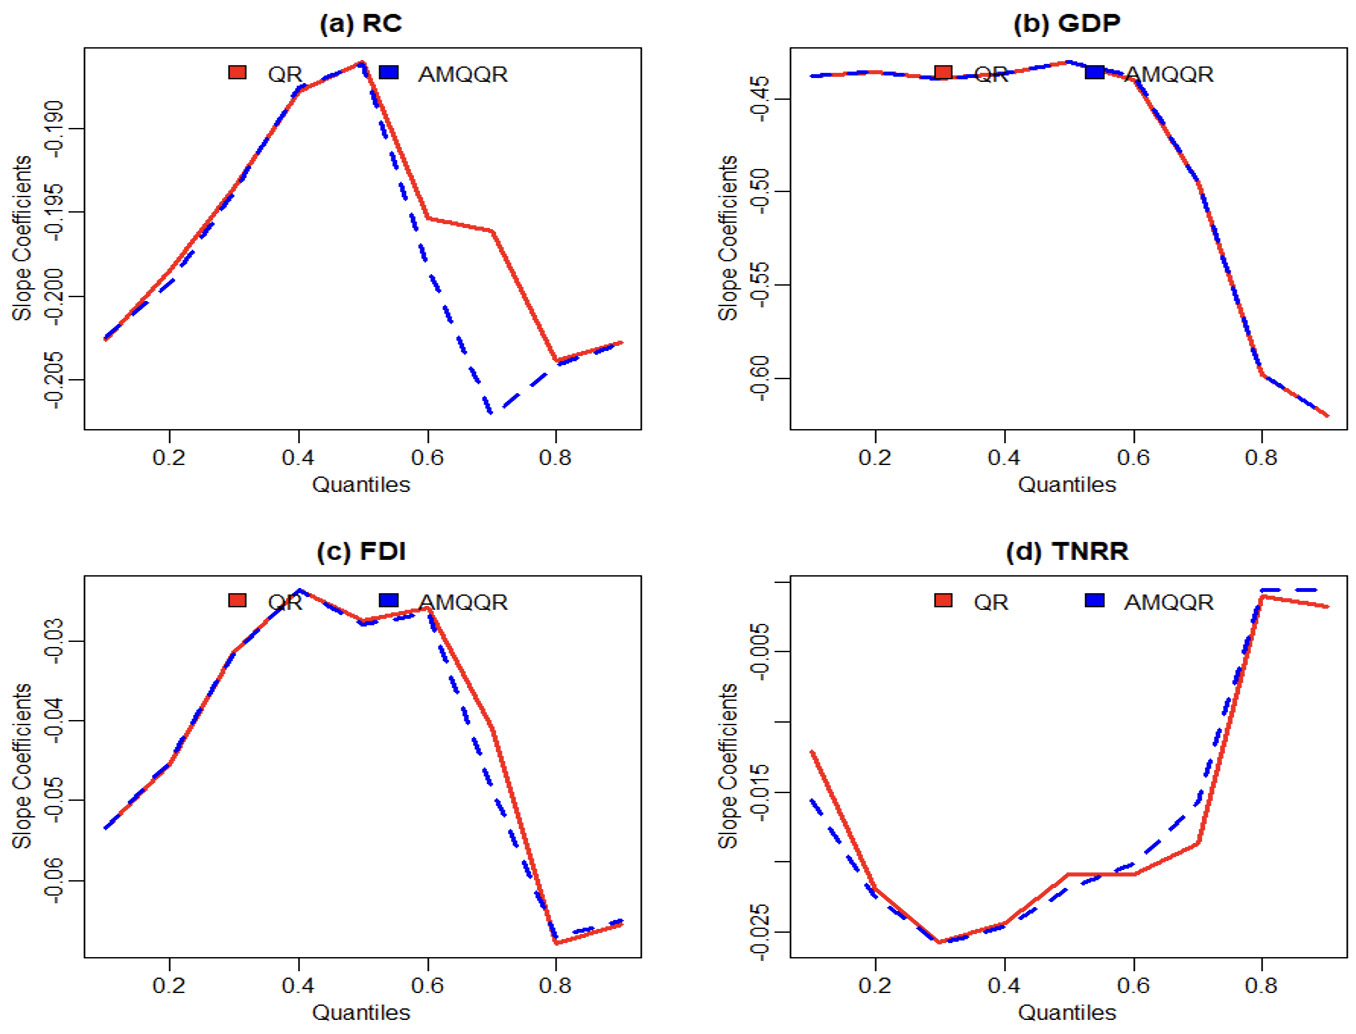
Our robustness tests confirms that the QR and AMQQR follow the same trend over the quantiles, which validates the MQQR results (see Panel B of Figure 2).
IV. Conclusion
This study examines the effect of oil refining capacity on environmental quality in Nigeria while considering resource rents, urbanization, FDI, and economic growth. The results demonstrate that refining capacity can have both positive and negative environmental impacts, depending on operational efficiency, emissions control, and regulatory enforcement. While refining may reduce the environmental costs associated with crude oil imports and illegal refining, it can also contribute to industrial pollution and ecosystem degradation if not managed sustainably. Resource rents negatively impact environmental quality, supporting the resource curse hypothesis, which suggests that weak institutions and mismanaged revenues drive environmental degradation. Urbanization exacerbates pollution through deforestation, infrastructure expansion, and increased energy demand. FDI has a dual effect: it intensifies pollution when directed toward extractive industries but enhances sustainability when invested in green technologies. Finally, economic growth remains environmentally unsustainable, aligning with the initial stages of the EKC, where industrial expansion initially worsens environmental degradation.
To ensure sustainable oil refining practices, the government must implement strict environmental regulations, enforce carbon capture technologies, and promote clean refining processes such as hydrocracking and desulfurization. Additionally, independent environmental monitoring agencies should be established to ensure compliance with emissions standards. Given the negative impact of resource rents on environmental quality, a portion of these revenues should be redirected toward conservation initiatives, including afforestation, clean energy investment, and sustainable infrastructure development. Strengthening governance and transparency in resource rent allocation through institutions like the Nigeria Sovereign Wealth Fund (NSWF) is crucial to preventing mismanagement. Moreover, urbanization policies must prioritize green infrastructure, efficient waste management, and sustainable public transportation to mitigate environmental stress in rapidly growing cities. Expanding investments in clean energy solutions for urban centers and integrating environmental impact assessments (EIA) into urban development plans will help reduce the environmental footprint of urban expansion.
Attracting environmentally sustainable FDI is essential for mitigating industrial pollution. The government should implement FDI screening mechanisms to ensure foreign investments align with sustainable development goals (SDGs) while providing tax incentives for businesses investing in renewable energy and eco-friendly industries. Strengthening environmental governance will ensure that multinational corporations adhere to corporate social responsibility (CSR) standards. Additionally, fostering green economic growth requires a shift from oil dependence toward a diversified, low-carbon economy. This transition can be achieved through strategic investments in renewable energy, digital infrastructure, and eco-tourism, alongside the adoption of carbon pricing mechanisms to discourage high-emission industries. Expanding access to green finance initiatives, such as climate bonds and sustainability-linked investments, will further support environmentally responsible industries. By adopting these integrated policy measures, Nigeria can improve refining efficiency while minimizing environmental degradation, ultimately achieving a sustainable balance between economic growth and environmental conservation.