I. Introduction
Geopolitical risks are widely recognized as major factors affecting energy markets. Research has thoroughly examined their impact on energy markets, encompassing financial crises, pandemics, wars, and various conflicts (Z. Chen et al., 2024; Li et al., 2024; Wang et al., 2024). The bilateral relations between the US and China, as the two foremost global economic powers, are particularly significant due to their considerable influence on commodity markets, economic development, and trade (Du et al., 2017).
Previous studies have examined US-China tensions through energy-related variables. Xia et al. (2019) investigated the effects of the US-China trade war on energy demand in both countries, observing significant declines in energy consumption alongside an economic recession. Mignon and Saadaoui (2024) and Cai et al. (2022) analyzed the impact of US-China political relations on the oil market, finding that deteriorating relations resulted in decreased oil demand and prices. Chen et al. (2022) and Cai et al. (2023) explored the effects of US-China trade conflicts on stock markets, emphasizing the long-term consequences of political relations on market volatility.
This article contributes to existing literature in three key respects. First, while previous studies focus on either the political or economic dimensions of US-China tensions, none have simultaneously integrated both aspects using a comprehensive index. Second, the majority of the analyses employ linear methodologies (Cai et al., 2022) that may not effectively capture the evolving dynamics of geopolitics. Third, the response mechanisms specific to various sectors remain underexplored, even as the market share of clean energy continues to expand (Y. Chen & Pantelous, 2022). This investigation addresses these limitations by employing the US-China tension index created by Rogers et al. (2024) within a TVP-VAR framework to analyze time-varying, sector-specific transmission mechanisms.
The rest of the manuscript is structured as follows: Section II defines the data utilized, Section III provides background on the time-varying VAR methodology, Section IV presents empirical findings, and Section V concludes.
II. Data
This study uses monthly data from December 2000 to March 2024, sourced from Refinitiv Eikon DataStream. The vector of endogenous variables is defined as:
Y′t=[UCTt GEAt OILGASt CLEANt],
The core variable of the model is the US-China tension index, denoted by This index, developed by Rogers et al. (2024), enhances previous uncertainty indices by quantifying both economic and political events between the United States and China (see https://www.policyuncertainty.com/US_China_Tension.html). The Global Economic Activity index, developed by Kilian (2009), is sourced from the research database of the Federal Reserve Bank of Dallas. The Dow Jones Oil & Gas Titans 30 Index, denoted as is used to quantify the performance of the largest companies in the oil and gas sector. Finally, we utilize the WilderHill Clean Energy Index The last two indicators are sourced from LSEG Data & Analytics and serve as proxies for the stock prices of companies within the clean energy sector. A natural log transformation is applied to all variables except for GEA, due to the presence of negative values over the estimation period.
Before estimating the VAR, we apply the following unit root tests: the Augmented Dickey-Fuller (ADF), Phillips-Perron (PP), and Zivot-Andrews (1992). The results, presented in Table 1, indicate that the UCT index is stationary. However, the remaining variables are found to exhibit unit roots at their levels. The Zivot-Andrews (1992) test reveals significant structural breaks in the time series data of the examined variables.
The UCT index shows a significant break in September 2019, just before the COVID-19 pandemic, where the index reached its maximum value, reflecting heightened tensions between the two countries. The GEA variable experiences a significant structural break in December 2008, corresponding to the global financial crisis that severely impacted economic activity. OILGAS stock prices exhibit a structural break in October 2008, highlighting the effects of the global financial crisis on the energy sector. Finally, CLEAN demonstrates a unit root with a significant break in July 2020, as the economic recession caused by the COVID-19 pandemic led to substantial changes in the structure of energy markets. These identified breaks underscore the necessity of nonlinear time series modeling to effectively capture the dynamics among the variables.
Based on the results of the unit root tests, the variables—except for UCT—are incorporated into the VAR model in their first differences. Following the paper’s main objective, the US-China tension index (UCT) is ranked first as it is considered an exogenous shock influencing global economic activity (GEA), which is ranked second. Oil and gas stock prices are ranked third to measure their sensitivity to geopolitical and economic changes. To account for the dynamics of the clean energy sector and ensure the model reflects the residual effects of the preceding variables, clean energy stock prices are ranked as the last variable.
III. Methodology
This study adopts the TVP-VAR methodology developed by Primiceri (2005) to evaluate the influence of US-China tensions on stock markets. As highlighted by Primiceri (2005) and Koop et al. (2009), the TVP-VAR approach offers notable advantages over other nonlinear models. Firstly, unlike threshold or regime-switching models, it does not require a transition variable to dictate the behavior of variables across different regimes. Secondly, its time-varying parameters effectively capture gradual changes in relationships between variables. Lastly, the dynamic variance-covariance matrix of the error terms allows it to account for unforeseen external shocks.
The TVP-VAR model is expressed in the following formulation (Casas & Fernandez-Casal, 2019):
Yt=A0,t+A1,tYt−1+…+Ap,tYt−p+Ut,t=1,2,…,T,
In the TVP-VAR model described above, 𝑌ₜ represents the vector of previously defined exogenous variables, while denotes time-varying coefficient matrices. The innovation vector, features a time-varying covariance matrix Unlike TVP-VAR models based on the Bayesian methodology, the time-varying coefficients are modelled as smooth functions of time (Robinson, 1989). The estimation of coefficients is conducted through nonparametric kernel regression, which calculates parameters locally at each point in time. This approach avoids prior assumptions about the coefficients’ law of motion, enabling flexibility to adapt to complex or unknown data-generating processes (Fan, 2018; Robinson, 1989).
To derive time-varying impulse responses using the TVP-VAR model described in Equation (2), we follow the methodology outlined by Casas and Fernandez-Casal (2019). These responses measure how the endogenous variables react to a one-unit shock in the orthogonalized innovations, enabling the identification of dynamic interactions between variables within a time-varying framework.
IV. Empirical Results
The TVP-VAR model is employed to evaluate the effects of US-China tensions. Recent studies reveal that linear models often fail to adequately capture the relationship between uncertainties and stock and commodity markets, particularly during periods of heightened volatility (Bouteska et al., 2025; Helmi et al., 2023).

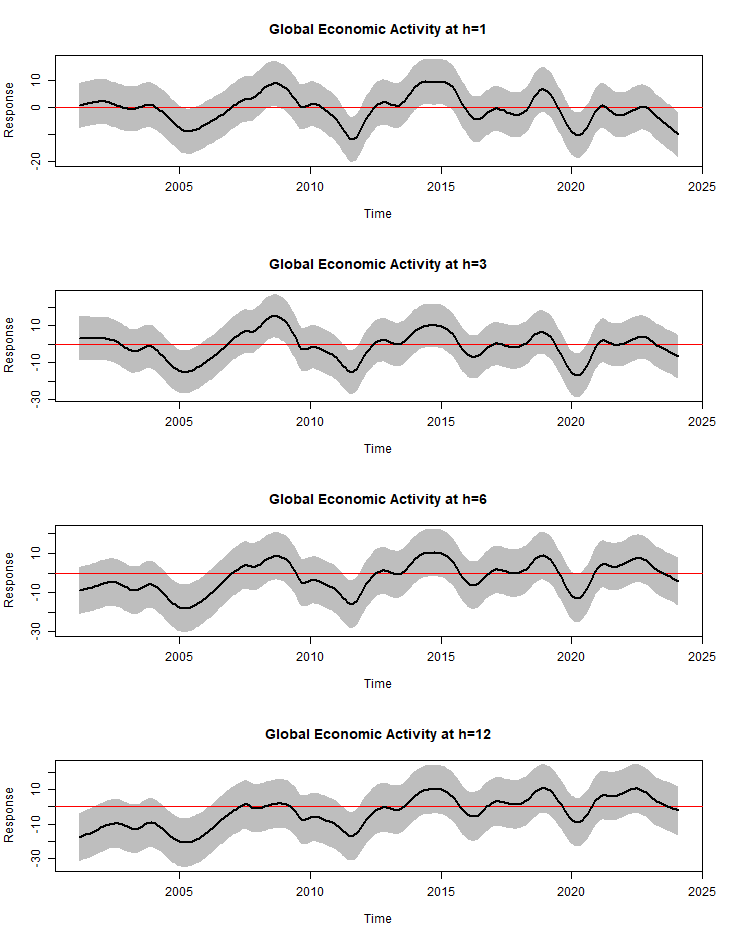
The time-varying responses of global economic activity, oil-gas, and clean energy stock returns are reported in Figures 1 to 3. These figures include time series plots of the accumulated time-varying impulse responses at horizons of months. The responses are illustrated along with their 90% confidence bands to evaluate their significance. The results indicate that the responses of variables to UCT shocks are not time-invariant and are significantly influenced by global events. The cumulative responses of all variables across various horizons exhibit a consistent pattern, as the total impact of UCT shocks is fully completed within a two-month horizon.
The time-varying responses of global economic activity to US-China tensions are presented in Figure 2. These responses demonstrate significant fluctuations, particularly during times of increased tension. The global financial crisis of 2008 and the subsequent economic downturn are characterized by significant negative responses, illustrating the adverse impacts of heightened US-China tensions on global economic activity. Similarly, the trade war that commenced under the Trump administration in 2018, along with the COVID-19 pandemic in 2020, is linked to considerable adverse reactions, highlighting the vulnerability of global economic activity to geopolitical and economic disruptions.
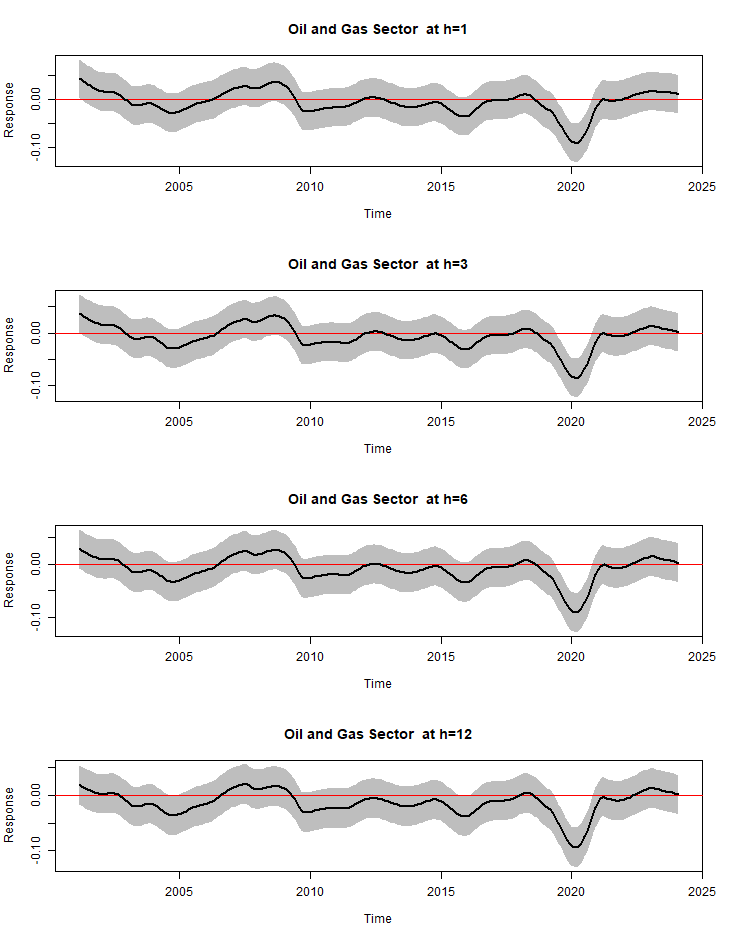
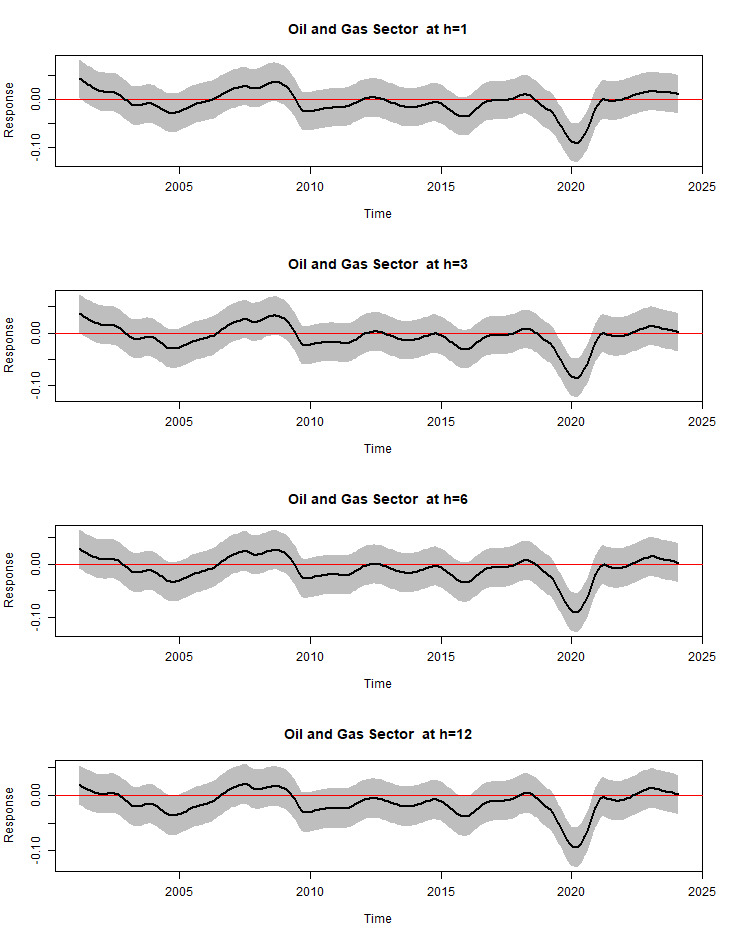
The time-varying responses of oil-gas stock returns to US-China tensions are displayed in Figure 3. Significant variations in the responses have been observed, with notable negative impacts occurring during pivotal events that align with the negative responses obtained from the linear VAR. The responses are insignificant during most of the analysis period, except for the period between 2018 and 2022. This period includes the effects of the trade war between the US and China as well as the COVID-19 pandemic, corroborating the vulnerability of the oil and gas sector to geopolitical risks and economic uncertainties.
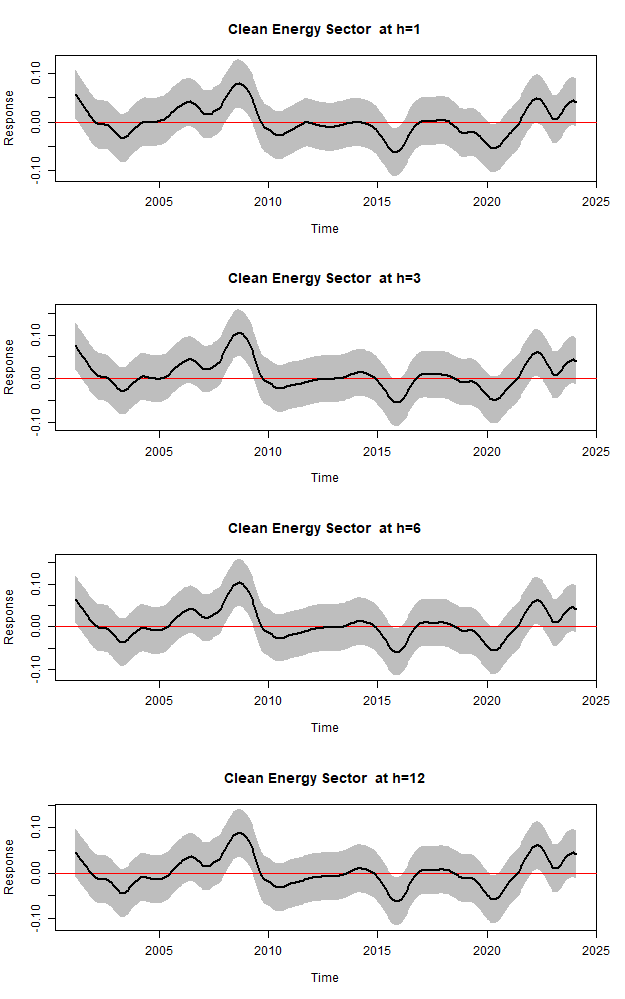
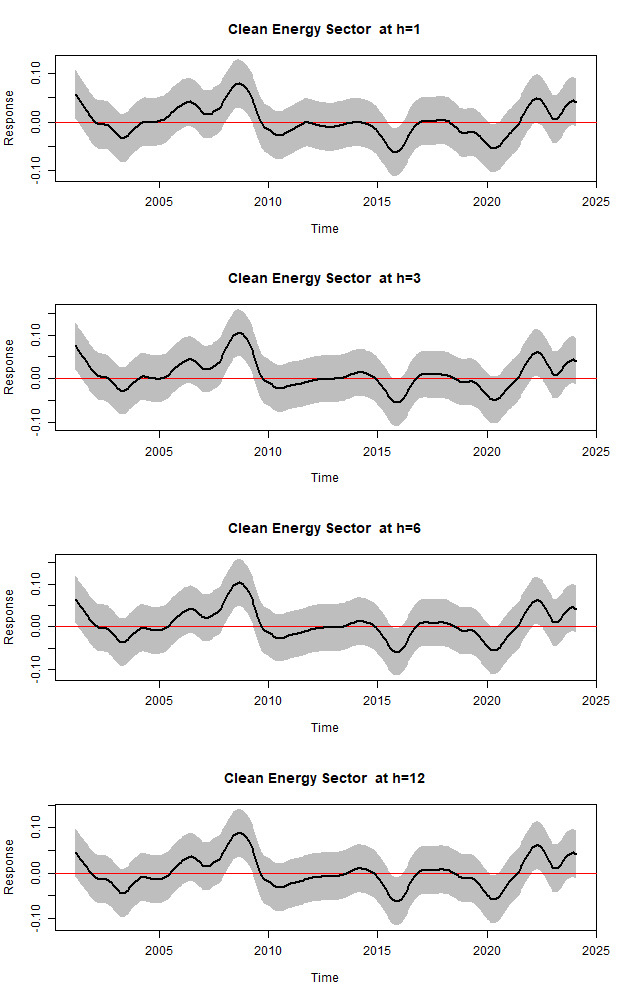
The time-varying responses of clean energy stock returns to US-China tensions are illustrated in Figure 4. In contrast to the insignificant reaction of the oil-gas sector, positive and significant responses are observed at the beginning of the analysis period. This can be attributed to the rise in US-China tensions due to the Hainan Island incident and the 9/11 attacks. The largest positive impact of US-China tensions coincides with the global financial crisis period. Similar to the reaction of the oil-gas sector, negative and significant responses are also observed during certain periods. A significant adverse impact is reported at the beginning of 2016, which is related to the stock market crash in Shanghai during 2015–2016 (Shi, 2022), largely affected by a fall in China’s economic growth that led to a decline in China’s foreign trade. More precisely, global companies depending on China suffered losses, including the clean energy sector. Another negative effect is observed in the middle of 2020, related to the escalation of the COVID-19 pandemic. It is also observed that the invasion of Ukraine by Russia leads to a positive response in clean energy stock returns to US-China tensions. This positive response can be associated with increasing investor interest in sustainable energy solutions amid geopolitical uncertainties and the growing emphasis on clean energy transitions.
V. Conclusion
This study analyzes the impact of US-China tensions on stock returns in the oil-gas and clean energy sectors using the TVP-VAR model. The time-varying responses reveal significant fluctuations in the variables’ reactions. The oil-gas sector experienced notable negative impacts during the US-China trade war and the COVID-19 pandemic. Conversely, the clean energy sector demonstrated positive responses to US-China tensions, driven by heightened investor interest in sustainable energy amid geopolitical uncertainties. Key periods include the aftermath of the 2018 trade war and the COVID-19 pandemic, during which clean energy stock returns showed substantial positive responses.
The findings highlight the importance of sector-specific dynamics and the evolving role of geopolitical risks in financial market behavior. Future studies could investigate the effects of US-China tensions on regional energy markets, incorporating sector-specific policy measures and targeted geopolitical risk indicators to uncover the unique responses of conventional and renewable energy stocks. Additionally, future research may delve into the integration of macroeconomic variables—such as interest rate volatility, inflationary pressures, and energy supply shocks—within a time-varying framework to assess the broader impacts of geopolitical tensions on these factors.