I. Introduction
The examination of energy-related risks is essential due to their profound implications for global economic stability and environmental sustainability (Tang et al., 2022; Wang et al., 2024). These risks encompass various factors such as geopolitical tensions, market volatility, and policy shifts, all of which can disrupt energy supplies and affect pricing dynamics. A thorough understanding of these risks is vital for devising strategies that mitigate potential adverse impacts on economies and societies.
This paper primarily aims to investigate the dynamic connectedness and spillover effects of energy risks among G20 nations. As major producers and consumers of energy resources, G20 countries significantly influence the global energy landscape. In 2022, these nations accounted for approximately 80% of global energy production and 77% of global energy consumption (IEA, 2022). Against this backdrop, this study seeks to contribute to the existing literature in two key areas. First, it explores the presence of energy risk spillovers among G20 nations using the innovative energy risk score variable developed by the London Stock Exchange Group (LSEG). Second, it employs the TVP-VAR connectedness methodology, formulated by Antonakakis et al. (2020), to measure the fluctuations in energy risk spillovers over time.
Numerous studies have examined the interconnections between energy markets and macroeconomic variables (Bal & Rath, 2015; Wen et al., 2018), highlighting the impact of geopolitical events and economic crises on energy markets (Devpura & Narayan, 2020; Mugaloglu et al., 2021). However, to the best of our knowledge, no prior research has analyzed energy risk spillovers using the TVP-VAR connectedness approach.
The empirical results reveal significant energy risk spillovers among G20 countries. Changes in the connectedness measures indicate that these spillover effects are dynamic and evolve over time. The time-varying connectedness measures computed in this study allow for the identification of energy risk transmitters and receivers, offering valuable insights into the patterns and dynamics of energy risk spillovers among nations.
II. Data and Methodology
A. Data
This study estimates the dynamic connectedness and spillover of energy risks among G20 countries. Quarterly energy risk score indices from LSEG, covering the period from 1999Q1 to 2024Q3, were obtained using the Refinitiv Eikon Datastream (2024) database. These scores evaluate countries based on factors such as energy policy, low-carbon energy initiatives, and energy independence. The energy risk variable ranges from 0 to 100, where a higher score signifies a greater level of energy-related risk. Due to data availability, 19 of the G20 countries were included in the analysis.[1]
The energy risk score variables were analyzed in their natural logarithmic form. Unit root tests on all energy risk score variables demonstrated that they are stationary at first difference; thus, their log first-difference form was utilized for estimation purposes.[2]
B. Methodology
The TVP-VAR connectedness is the time-varying extension of Diebold and Yilmaz’s (2014) connectedness, developed by Antonakakis et al. (2020). The total connectedness index (TCI) is computed as follows:
\[\begin{aligned} C_{t}(H) &= \frac{\sum_{i,j = 1,i \neq j}^{m}{{\widetilde{\varnothing}}_{ij,t}(H)}}{\sum_{i,j = 1}^{m}{{\widetilde{\varnothing}}_{ij,t}(H)}} \times 100\\ & = \frac{\sum_{i,j = 1,i \neq j}^{m}{{\widetilde{\varnothing}}_{ij,t}(H)}}{m} \times 100 \end{aligned}\tag{1}\]
This index measures the degree to which a shock in one variable spills through other variables. The “total directional connectedness to others” quantifies the shock transmitted from variable i to all other variables j, calculated as:
\[C_{i \rightarrow j,t}(H) = \frac{\sum_{j = 1,i \neq j}^{m}{{\widetilde{\varnothing}}_{ij,t}(H)}}{\sum_{j = 1}^{m}{{\widetilde{\varnothing}}_{ij,t}(H)}} \times 100\tag{2}\]
The “total directional connectedness from others” quantifies the overall impact that all variables j have on variable i when it receives shocks from them. It is computed using the following formula:
\[C_{i \leftarrow j,t}(H) = \frac{\sum_{j = 1,i \neq j}^{m}{{\widetilde{\varnothing}}_{ij,t}(H)}}{\sum_{i = 1}^{m}{{\widetilde{\varnothing}}_{ij,t}(H)}} \times 100\tag{3}\]
The “net total directional connectedness” represents the net impact of variable i on the network. It is calculated as the difference between the total directional connectedness to others and the total directional connectedness from others, using the formula:
\[C_{i,t} = C_{i \rightarrow j,t}(H) - C_{i \leftarrow j,t}(H)\tag{4}\]
If is positive, variable i has a greater impact on the network than the influence it experiences from other variables. In our case, a positive value of implies that the country is net energy risk transmitter. On the other hand, a negative value for indicates that variable i is more exposed to the effects of the network, rather than influencing it hence it can be referred as net energy risk receiver.
III. Results
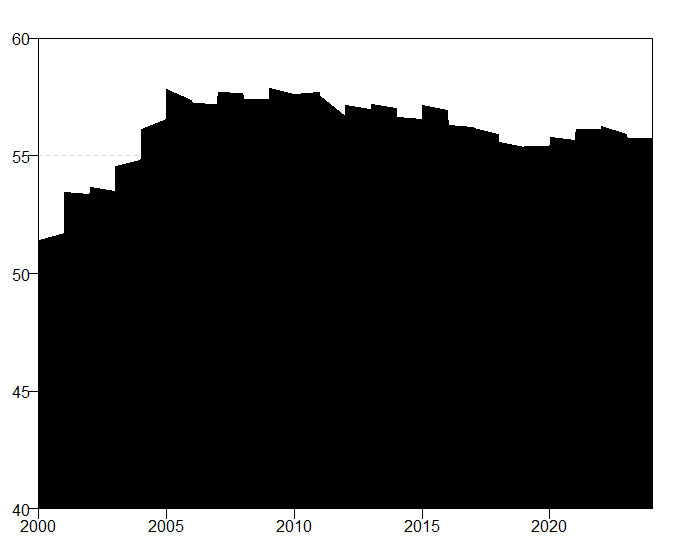
This section presents the results of connectedness indices obtained from the TVP-VAR model to analyze energy risk spillovers among G20 countries. The dynamic total connectedness, plotted in Figure 1, indicates that the extent of interconnectedness ranges between 50% and 60%, suggesting substantial energy risk spillovers. The total connectedness is not constant, but rather changes over time. Total connectedness reached its minimum level in the first quarter of 2001 at 51.32%, gradually increased to its highest level in the last quarter of 2005 at 57.88%, and showed a slight decline during the period of the COVID-19 pandemic. It is also observed that the invasion of Ukraine by Russia slightly increased the total connectedness among the G20 countries.
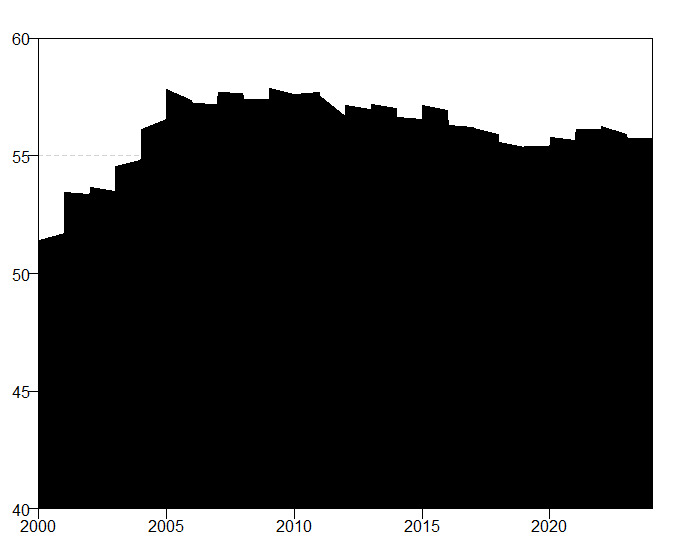
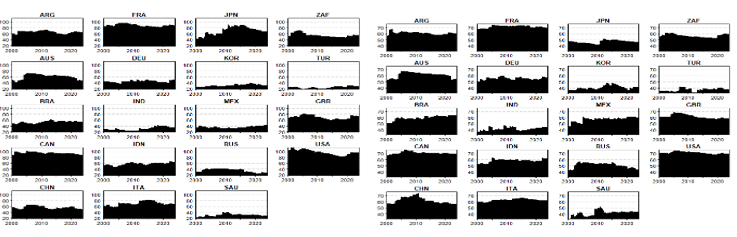
Table 1 provides the average values of connectedness measures for G20 countries, highlighting energy risk transmitters and receivers. It is evident that these countries maintain strong interconnected relationships, as indicated by their Total Connectedness Index (TCI) value of 55.94. The United States, Canada, and France demonstrate the most significant spillover effects on other nations, with values of 96.73, 93.84, and 88.11, respectively. Furthermore, the US, France, and Canada are also heavily influenced by other countries, exhibiting values of 71.19, 71.13, and 70.67, respectively. In terms of averages of net connectedness measures, the United States, Canada, and Japan emerge as the primary energy risk transmitters within the network, with net values of 25.54, 23.17, and 21.64, respectively. Conversely, Mexico, Russia, and Turkiye are identified as the main receivers, with net values of -21, -15.45, and -12.13, respectively. The time-varying version of the results in Table 1 is presented in Figure 2.
_and_from_others_(right_side).png)
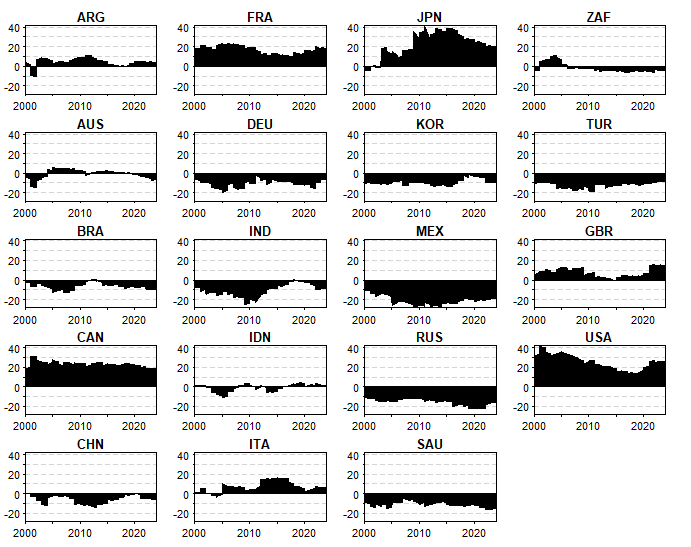
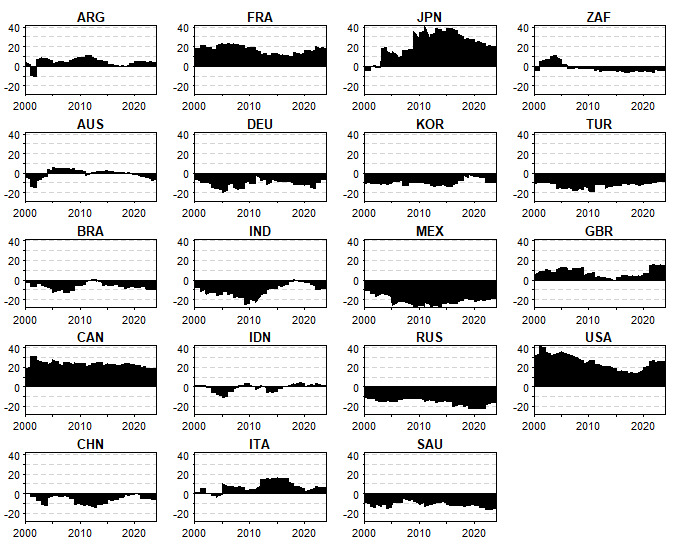
Figure 3, including the net connectedness of the countries, provides useful information about the identification of net energy risk transmitters and receivers within the G20. The results indicate that Argentina, Canada, France, Italy, Japan, the UK, and the US are net transmitters, whereas Brazil, Germany, India, Korea, Mexico, Russia, Saudi Arabia, and Turkiye are net receivers of energy risk for the majority of the analysis period. Japan, the US, and Canada are found to be major energy risk transmitters. For the US, the invasion of Iraq in response to the September 11 attacks and the recent Shale Revolution, which led to a substantial increase in tight oil and gas production and reserves, might have contributed to the transmission of energy risk to other nations. For Japan, the 2011 Fukushima Daiichi Nuclear Disaster appears to have significantly increased the transmission of energy risk from Japan to other countries, prompting a global reevaluation of energy policies and a shift toward exploring alternative sources (Hayashi & Hughes, 2013). Furthermore, developing countries in the estimation sample, such as Turkiye, India, Mexico, and Russia are found to be more vulnerable to energy risk. For example, Russia became a greater receiver of energy risk during the period of COVID-19 and the invasion of Ukraine.
IV. Conclusion
The objective of this study was to analyze the dynamic interconnectedness and spillover effects of energy risks among G20 countries using the TVP-VAR connectedness approach. By utilizing innovative energy risk score variables, the research offers a detailed examination of energy-related risks. The findings reveal significant energy risk spillovers among G20 countries, highlighting key transmitters and receivers within the network and underscoring the complex and evolving nature of these interactions.
This analysis serves as a crucial reference for policymakers in G20 countries, emphasizing the need to consider the interconnectedness of energy risks when formulating energy policies and strategies. Joint energy policies emerge as vital tools for mitigating risks and enhancing energy security. Moreover, the adoption of sustainable energy practices and a reduced dependency on high-risk energy sources can contribute significantly to the stability and security of the global energy system.
The following countries are included in our analysis: Argentina (ARG), Australia (AUS), Brazil (BRA), Canada (CAN), China (CHN), France (FRA), Germany (DEU), India (IND), Indonesia (IDN), Italy (ITA), Japan (JPN), Mexico (MEX), Russia (RUS), Saudi Arabia (SAU), South Africa (ZAF), South Korea (KOR), Turkiye (TUR), United Kingdom (GBR), United States of America (USA).
The results of unit root tests are available upon request from the corresponding author.