
I. Introduction
The world has witnessed three major crises in the last few years: COVID-19 (March 11, 2020), the Russia-Ukraine war (February 24, 2022 - ongoing), and the Israel-Hamas war (October 7, 2023 - ongoing). These crises have changed the level of interconnectedness and increased risk levels among various asset classes (Karim & Naeem, 2022). Connectedness is an empirical method that enables an improved understanding of the inherent systemic risk within a network of variables (Balcilar et al., 2021). According to Andries & Galasan (2020), the primary reason for the profound impact of the subprime crisis is systemic risk and global interconnectedness, which facilitated contagion risk. A high degree of connectedness among assets in a portfolio indicates significant interdependency among them (Torrente & Uberti, 2021).
Existing literature indicates that elevated financial risk is significantly affected by the speculative characteristics of assets like energy assets, sustainable assets, energy commodities, and cryptocurrency, which are highly lucrative in terms of profitability yet highly volatile (Mishra et al., 2023). Investor behavior changes during economic and financial crises. The ambiguity arising from such situations induces significant volatility among assets. Analyzing these networks is crucial for identifying potential sources of systemic risk and effectively adjusting portfolio investments (Balcilar et al., 2021). Traders can mitigate downside risk by substantially reducing inherent volatility through the optimization of asset and portfolio allocation (Antonakakis et al., 2018).
Musa et al. (2018) assert that global gas and oil reserves would be consumed by mid-century, while coal reserves are anticipated to be depleted within 60 years. The rapid growth of the clean energy market and sustainable development has increased the interest of academicians and professionals. Investors are drawn to green and clean energy investments that provide substantial diversification opportunities and a moderate risk profile to mitigate financial losses during periods of volatility (Karim & Naeem, 2022). This is one rationale for incorporating energy assets and sustainable assets as variables in our study. Regulators can consider carbon pricing to push renewable energy investments (Tiwari et al., 2022). Hence, before introducing carbon pricing, regulators need to understand the connectedness among assets.
Bitcoin has become an attractive option for hedging and diversification (Hasan et al., 2022). A study by Wang et al. (2022) indicates that cryptocurrency and blockchain mining contribute to climate change and excessive energy consumption. Hence, it is crucial to study the risk transmissions from Bitcoin. Crude oil prices hold substantial importance for the macroeconomic performance of both oil-importing and oil-exporting nations.
Phan et al. (2022) highlight that carbon risk has a significant negative impact on firms’ investment decisions. Patel et al. (2023) suggest that green assets serve as a hedge/safe haven and investors and issuers of such assets should consider geopolitical events for pricing and risk management. Ahmed et al. (2024) conclude that China should focus on investing in green and renewable energy, improve institutional quality, and focus on ecologically friendly trading to reduce greenhouse gas emissions. Salisu et al. (2024) analyze that higher EUIs result in increased stock return volatility.
Existing literature identifies significant causal relationships and volatility spillovers across clean energy stocks, oil prices, and renewable energy stocks (Akram & Haider, 2022). The connectedness between cryptocurrencies like Bitcoin, energy assets, energy commodities, and sustainable assets is underexplored and lacks consensus in terms of diversification characteristics. This study aims to fill this gap.
The study contributes in two ways. First, we employ a novel TVP-VAR extended joint connectedness approach. Second, we provide insights into the connectedness between clean energy, renewable energy, SDG, crude oil, natural gas, and Bitcoin. These results hold significant implications for policymakers, investors, and regulators.
The study is organized as outlined here. Section II delineates the data and methodology employed. Section III delineates the empirical findings. Section IV presents the conclusion.
II. Data and Methodology
A. Data
The study has collected daily closing price data from Refinitiv Eikon, spanning the period from January 1, 2021, to October 14, 2024. The six variables considered are two energy assets (Solactive Clean Energy NTR Index & Solactive Renewable Energy NTR Index), iShares MSCI Global Sustainable Development Goal (SDG) as a representative of sustainable asset, two energy commodities (NYMEX Light Sweet Crude Oil Electronic Energy Future & NYMEX Henry Hub Natural Gas Electronic Energy Future) and Bitcoin. Solactive Clean Energy NTR Index has 42 equity shares belonging to companies working on Clean Energy generation. The Solactive Renewable Energy NTR Index consists of 45 stocks representing investments in Renewable Energy generation. iShares MSCI Global Sustainable Development Goals consists of many companies representing different sectors working towards sustainable development goals. The data scope covers the ongoing wars.
B. Methodology
B. I. TVP - VAR extended joint connectedness
This study employs the TVP – VAR extended joint connectedness approach to measure net and total pairwise dynamic connectedness. The approach is a combination of the TVP-VAR method by Antonakakis et al. (2020), the extended joint connectedness approach by Balcilar et al. (2021) and the normalization method by Lastrapes & Wiesen (2021). The total connectedness index (TCI) in the extended joint connectedness measure (Balcilar et al., 2021) is expressed as:
TCIJt=1nn∑i=1CJ,FROMi←.,t
B. II. Portfolio back-testing models
We employ MVP (Minimum Variance portfolio) suggested by Markovitz (1959) MCP (Minimum Correlation portfolio) introduced by Christoffersen et al. (2014) and MCoP (Minimum Connectedness portfolio) given by Broadstock et al. (2022) to examine the investment performance of the selected assets. We apply Sharpe ratio (SR) given by Sharpe (1994) to measure portfolio performance.
III. Empirical Findings
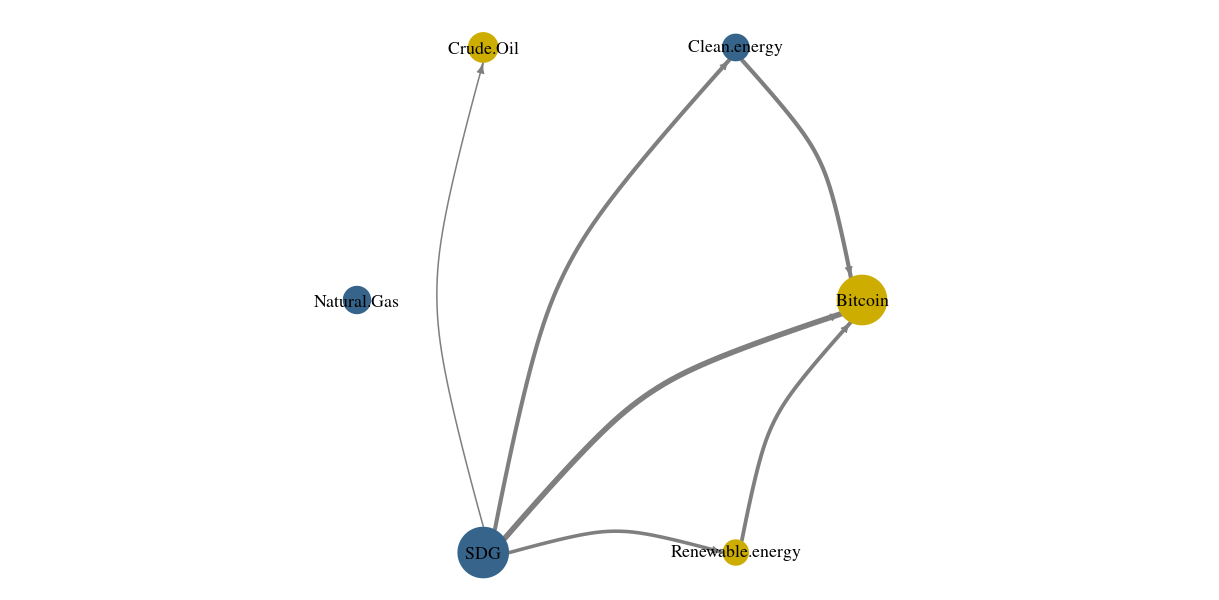
Table 1 presents average connectedness results for all selected assets. The average value of TCI, i.e. 42.45% suggests that 42.45% of the forecast error variance of the LHS variables can be explained by the RHS variables. Additionally, 42.45% of forecast error variance within this network of selected assets can be considered as a product of cross-market innovations. It also explains the average variation of each variable within this network. Hence, idiosyncratic effects account for 57.75% of the forecast error variance within this network of selected assets. Average results show that SDG, natural gas and clean energy are net transmitters of shocks in the particular system (i.e. they influence other assets as compared to being influenced by other assets). While Bitcoin, crude oil and renewable energy are net receivers of shocks.
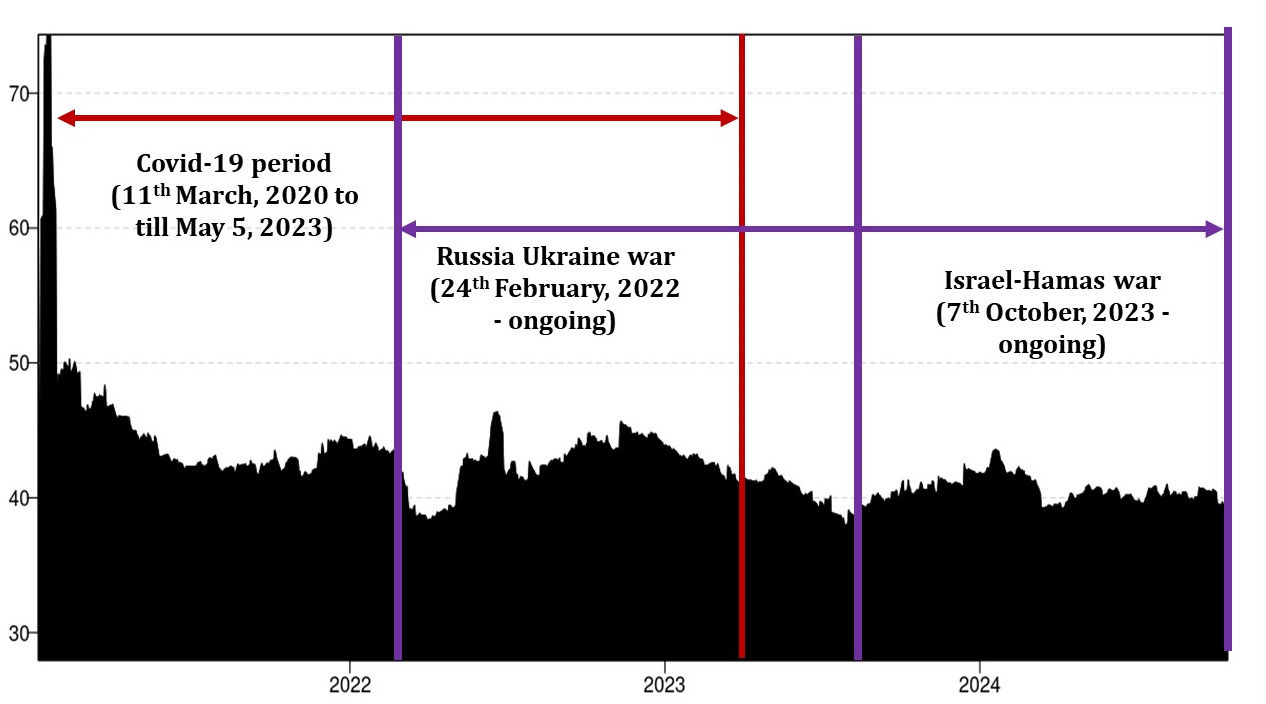
Figure 1 studies the time-varying behaviour considering significant events (i.e., geopolitical, economic, health, financial, etc.). It also provides valuable information regarding the length of the crisis. Large TCI values imply high spillover across selected assets. One can observe that TCI values reached a record high above 70% during COVID-19. This is in line with the study of (Naeem & Karim, 2021). TCI followed a downward trend till early 2022. A new upward trend is seen in 2022 owing to the Russia-Ukraine war (February 2022). The TCI value oscillates throughout the year, rising again with the onset of the Israel-Hamas war (October 2023).
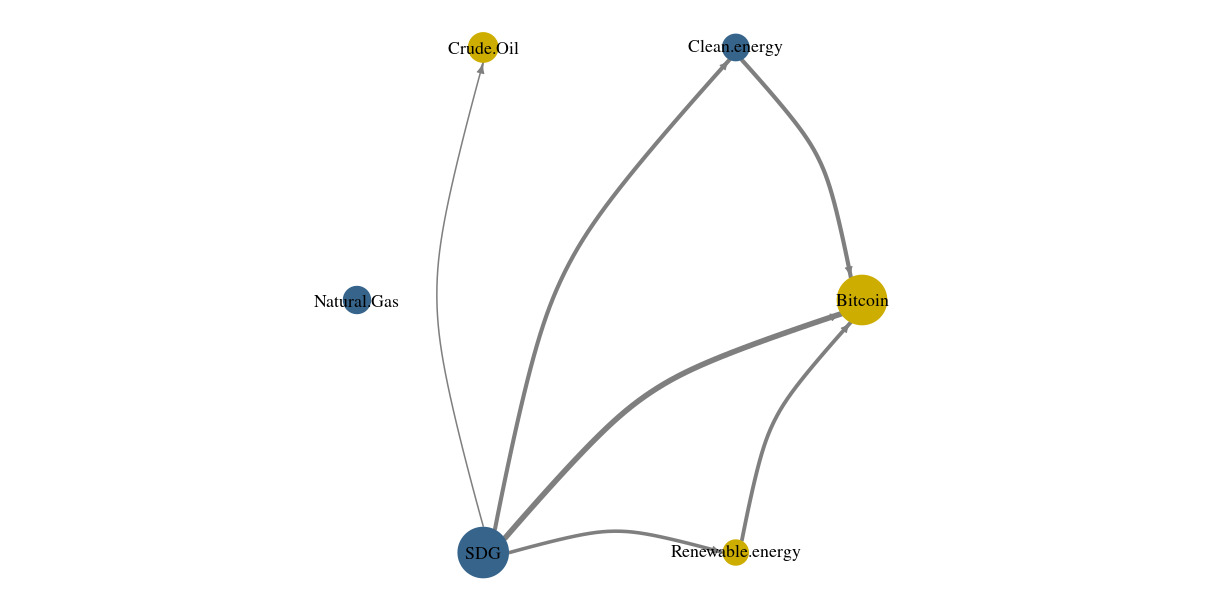
The findings in Figure 2 are in line with our earlier observations in Table 1. Hence, Figure 2 also demonstrates the robustness of our analysis.
From Table 2 we discuss the constructed multivariate investment portfolios based on MVP, MCP and MCoP methods. The optimal weights help in understanding the composition of individual portfolios and one can observe significant marginal differences between portfolio weights of MVP and both MCP and MCoP. Clean energy and SDG which is a net transmitter of shocks has the lowest weightage for both MCoP and MCP. This highlights the optimization of MCoP and MCP as clean energy and SDG transmits and receives substantially (Table 1). This observation is in line with the study by Tiwari et al. (2022). A higher Sharpe ratio is indicative of better portfolio performance. Hence, MCP is the best-performing portfolio with SR of 0.040 followed by MCoP with SR of 0.039. The reason that MVP has a SR of only 0.005, is its heavy investment in SDG (73%). From Table 1 one can observe that SDG has high connectedness with remaining assets, which leads to the fact that MVP’s portfolio returns are much lower compared to other portfolio strategies.
IV. Conclusion
This study analyses the connectedness between energy assets, sustainable assets, energy commodities and Bitcoin from January 2021 to October 2024, using TVP – VAR extended joint connectedness. The clean energy and SDG dominate the market while Bitcoin, crude oil and renewable energy are driven by the market. The outcome of portfolio performance found MCP portfolio as optimal portfolio. Investment in renewable energy can drive the portfolio diversification benefits.
Our findings can assist investors in constructing a portfolio to gain the diversification potential of energy, sustainable and crypto investments. Understanding the connectedness guides sustainable investors to design appropriate policies. The study is crucial for portfolio managers to design the portfolio for their clients. Policymakers can use our results to facilitate quicker investment flows into sustainable assets. Government can provide tax benefits to investors on investing in sustainable assets. Future researchers can consider R2 connectedness to assess the relationship.
Acknowledgement
The authors acknowledge comments from reviewers and the editor of this journal.