
1. Introduction
The recent outbreak of the coronavirus (COVID-19) pandemic is not only threatening public health but also carries significant repercussions for the sustainability of the financial market (Ali et al., 2020). Crude oil futures is one of those financial products severely impacted by COVID-19. The volatility of investor sentiment, combined with a sharp decrease in the demand for crude oil, resulted in a negative West Texas Intermediate (WTI) crude oil futures price on April 20, 2020.
The existing literature focuses mainly on the interrelationship between investor sentiment and oil prices; see also Narayan (2019). Qadan & Nama (2018) find that investor sentiment has significant effects on oil prices, especially when oil-based financial products become a popular asset class for investors. The study by He & Casey (2015) shows substantial forecasting ability of sentiment on crude oil price changes, especially the WTI prices. Narayan (2020) shows the relative importance of negative and positive oil price news in influencing oil prices. In addition, some studies discuss the relationship between investor sentiment and futures price. The empirical results in Simon & Wiggins (2001), for instance, reveal that investor sentiment has both statistical and economic forecasting power when Standard & Poor’s 500 futures returns are modelled. Maslyuk-Escobedo et al. (2017) demonstrate that energy futures prices have a high degree of co-movement with any sentiment proxies. However, there is little work done on understanding how investor sentiment influences crude oil futures price.
By focusing on sentiment and oil price volatility over the COVID-19 period, our paper joins several studies that evaluate the impact of COVID-19 on the crude oil market. Most of them explore the direct influence that COVID-19 has had on the oil price (Gil-Alana & Monge, 2020; Liu et al., 2020; Narayan, 2020; Qin et al., 2020). However, few studies focus on any possible change in the relationship between investor sentiment and futures price. This focus is important because after any major shock, the influencing mechanism or the influence level of the factors that drive futures prices, are likely to be different. The inspiration for this comes from the work of Kollias et al. (2013), who find that the covariance between stock and oil returns is affected by war. In a similar vein, Wang et al. (2020) demonstrate that the effect of oil price changes on the stock market is stronger under extreme shocks than under normal circumstances.
Given this background, we empirically examine the relationship between investor sentiment (which we proxy using the OVX index) and crude oil futures price. We use the Engle & Granger (1987) two-variable cointegration approach to examine whether the relationship between investor sentiment and crude oil futures price remains stable when the COVID-19 shock took place. Then, we employ the Gregory-Hansen (1996) test for cointegration with regime shifts in order to find the structural change point. Consistent with our hypothesis, we find a breakpoint when the COVID-19 epidemic turned into a pandemic.
2. Data
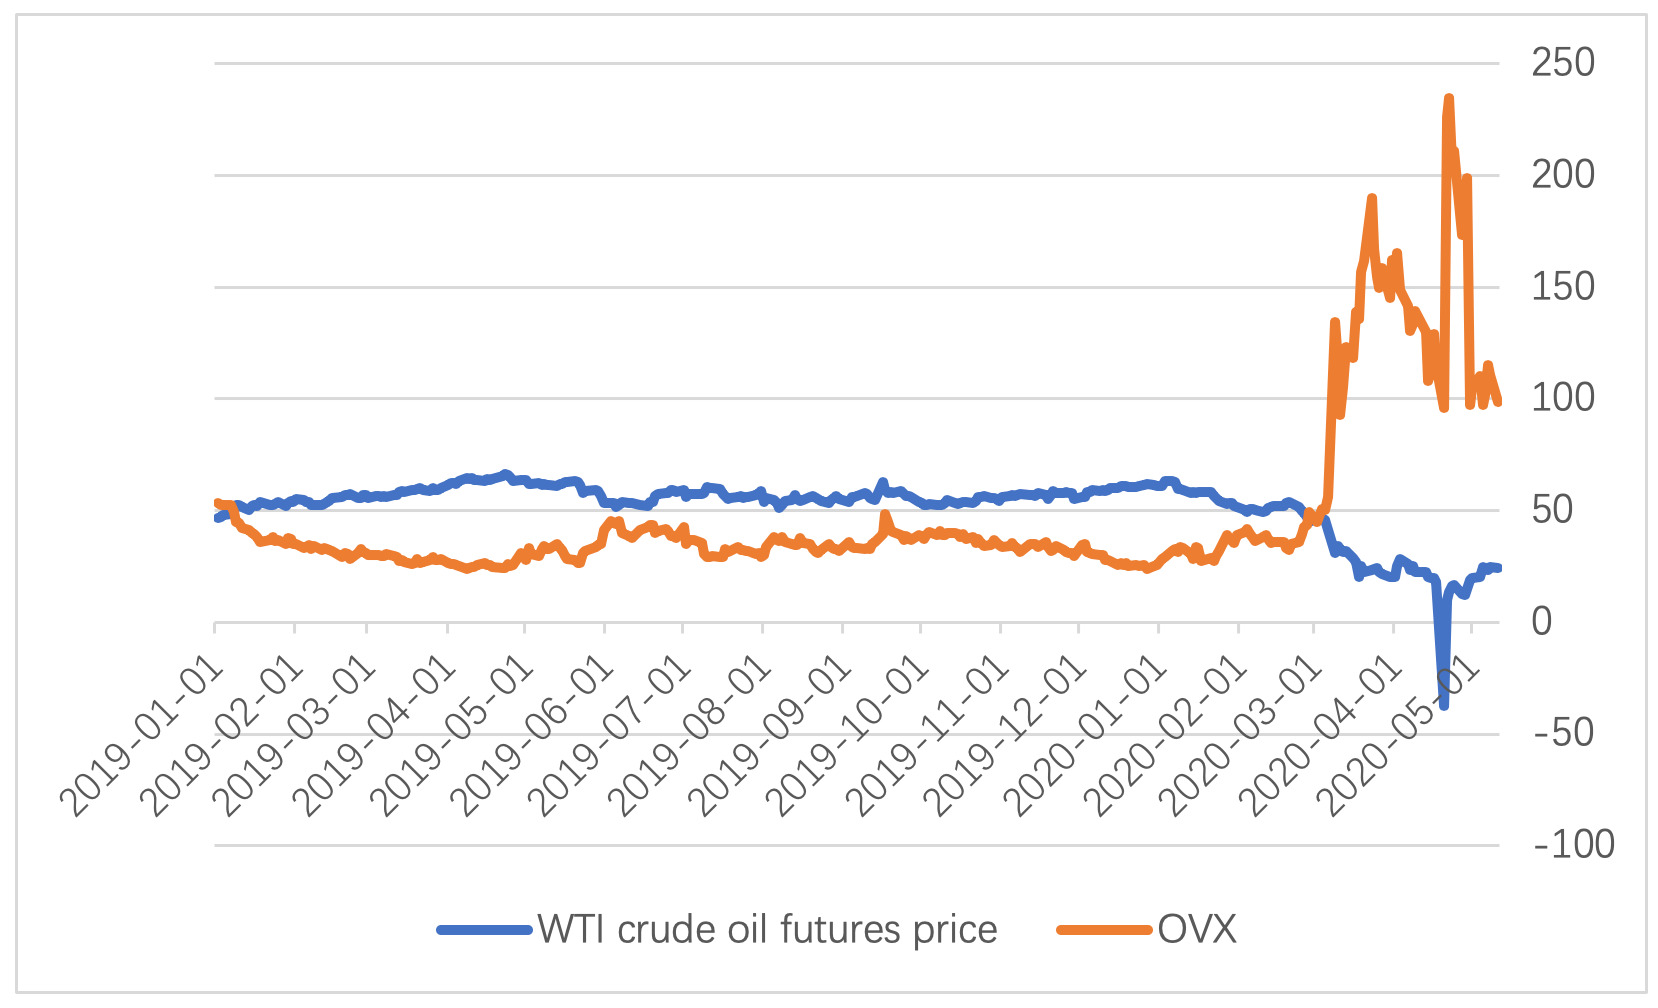
Panic resulting from COVID-19 is associated with heightened volatility in financial markets and this association is stronger for industries that are hardest hit by the pandemic (Haroon & Rizvi, 2020). According to Ji & Fan (2016) and Qadan & Nama (2018), OVX is a reasonable gauge of investor fear. These studies find causality from OVX changes to WTI returns is significant. In addition, Simon & Wiggins (2001) used the volatility index (VIX) to forecast S&P 500 futures returns. From these discussions, it is clear that one can use OVX from the CBOE, (perceived as WTI’s panic index) to represent investor sentiment. The WTI crude oil futures price is chosen as the dependent variable. In order to get valid log of the WTI crude oil futures price, is treated as zero when the price is negative. The sample period covers January 2, 2019 to May 11, 2020, consisting of 340 observations.
3. Methodology
To study structural changes in the relationship between the WTI crude oil futures price and the OVX, we follow Ji et al. (2016) and employ the Engle & Granger (1987) two-variable cointegration method. This allows us to evaluate any possible long-term cointegration relationship between the two variables. The regression form can be expressed as:
lnPt=α+βlnVOXt+εt(1)
Where and respectively, represent the WTI crude oil futures price and the OVX. If both variables are unit root processes and the error term is stationary, this will indicate a cointegration relationship between crude oil futures price and investor sentiment.
However, the Engle-Granger cointegration approach cannot be effectively utilized to identify any structural changes in the cointegrating relationship. The residual-based cointegration test assumes that the cointegration vector does not change with time. This is a very strict assumption which is unlikely to hold. We, therefore, address this limitation by using the Gregory & Hansen (1996) test, which endogenously identifies the breakpoint.
Gregory-Hansen propose the following models of regime shift which we employ:
-
Model C specifies a shift in the constant term as:
lnPt=α1+α2Dt(TB)+βlnVOXt+εt(2)
Model C is called the level shift model, which implies that the intercept, changes while the slope coefficient, is held constant. In the expression above, is the intercept before the shift and represents the change in the intercept at the time of shift.
-
Model C/T specifies a shift in the constant and the trend as:
lnPt=α1+α2Dt(TB)+γt+βlnVOXt+εt(3)
This model is based on a level shift with a time trend.
-
Model C/S specifies a shift in the constant and the slope as:
lnPt=α1+α2Dt(TB)+β1lnVOXt(4)+β2Dt(TB)lnVOXt+εt
Model C/S is a regime shift model which permits the equilibrium relation to rotate as well as shift. In this case, denotes the cointegrating slope coefficient before the regime shift and denotes the change in the slope coefficient.
-
Model C/S/T specifies a shift in the constant, the slope and the trend as:
lnPt=α1+α2Dt(TB)+γ1t+γ2tDt(TB)(5)+β1lnVOXt+β2Dt(TB)lnVOXt+εt
Model C/S/T is based on the regime shift model with a time trend.
In this model, represents the location of the structural breakpoint, which is endogenously determined by the model. When or, We follow Gregory and Hansen to use test statistic to judge if has a unit root process.
Where T is the length of sequence, represents the ADF unit root test statistic at the structural breakpoint When is higher than the critical value, it indicates existence of a cointegration relationship.
4. Empirical Analysis
We first use the Engle and Granger two-step cointegration test to analyze the possibility of a long-term cointegration relationship amongst the two variables. The results are:
lnPt=6.3750−0.6691lnVOXt+εt(77.34)(−30.35)
Where t-statistics are reported in parentheses. We find that over the sample period, , which is significant at the 1% level. The result is in line with Ji & Fan (2016).
Second, we choose the Kwiatkowski-Phillips-Schmidt-Shin (KPSS) unit root test (Kwiatkowski et al., 1992) to exam whether follows a stationary process. The null hypothesis is that the time series is stationary. According to the test results, the relationship between the crude oil futures price and OVX is not a long-term cointegration relationship.
We use four models of Gregory and Hansen and find that after considering the endogenous breakpoint, there exists a cointegration relationship. The null hypothesis for the four models is that there is no cointegration relationship. The results in Table 1 show test statistics in those four models all reject the null hypothesis, indicating the presence of a cointegration relationship between investor sentiment and crude oil futures price. There are two structural change break periods: between April 25, 2019 to April 29, 2019 and December 31, 2019 to February 25, 2020. The first period corresponds to the time when the U.S. crude oil inventories continued to exceed expectations, leading to the volatility of crude oil supply and its futures price. The second period corresponds to the outbreak of COVID-19 during which the demand for crude oil declined. We can see in Figure 1 that an obvious deviation occurred around the end of February when the pandemic spread worldwide.
We further explore what structural changes took place. Table 2 demonstrates the estimated results of the cointegration equation under the four model settings. In all cases, investor sentiment statistically significantly influences crude oil futures price; however, the impact of sentiment in the second period is significantly strengthened. For example, under the C/S model, on 31 Dec. 2019 the elasticity of crude oil futures price to investor sentiment was -0.295, meaning that when investor sentiment increased by 1% the crude oil futures price decreased by 0.295%. However, after the breakpoint, the coefficient turns out to be -0.678 (= -0.295-0.383). This means that when investor sentiment increases by 1%, the crude oil futures price falls by 0.678%. This implies that the influence of the sentiment to crude oil futures market grew significantly.
5. Conclusion
In this paper, we examine the long-run relationship between investor sentiment as proxied by the crude oil volatility index and the WTI oil futures price index. Using the Gregory-Hansen regime shift cointegration test, we document that there was a structural change in this relationship due to COVID-19. This finding will be of help for future research in this area. One future research area in this regard is crude oil price forecasting. Our results show that in this quest, COVID-19 will need to be specifically modelled.
Acknowledgement
This study is supported by National Natural Science Foundation of China (No. 71971192), Humanities and Social Science Youth Foundation of Ministry of Education of China (No. 19C11482075), and Natural Science Foundation of Zhejiang Province (No. LY19G010005). The authors thank the editor and anonymous reviewers of this journal for valuable comments and suggestions that improved the quality of this paper. Any errors and or omission are the sole responsibility of the authors.