
1. Introduction
Hamilton (2003), suggested that all major fluctuations in the price of oil could be attributed to disruptions to the flow of oil production caused by political events in the Middle East. However, several recent studies show the impact of COVID-19 on commodity markets (see, e.g., Albulescu, 2020; Bakas & Triantafyllou, 2020, among others). Bakas & Triantafyllou (2020) argue that in times of higher uncertainty (a future pandemic), supply and demand fall rapidly and steadily over time due to the increase in the price elasticity.
In the case of oil prices, assuming the same demand or supply, a higher macroeconomic uncertainty can alter the elasticity of crude oil prices. Thus, lower price elasticity of demand results in higher oil price volatility (Van Robays, 2016). In this context, Baumeister & Peersman (2013) demonstrate that the drop in the price elasticity of oil demand and supply is the key economic mechanism to explain the negative relationship between oil production volatility and oil price volatility.
In the current COVID-19 phase, we have seen that the equilibrium crude oil prices comes from the adjustment of oil supply and demand. The estimation, for example, by the International Energy Agency shows a daily drop of 435 thousand barrels, and the OPEC has reacted by cutting oil production.
While the empirical literature has extensively shown the role of various types of uncertainties on crude oil prices (see Aloui et al., 2016; Elder & Serletis, 2010; Monge, Gil-Alana, & de Gracia, 2017; Monge, Gil-Alana, & Pérez de Gracia, 2017; Zavadska et al., 2018, among others) there is no work exploring the effect of pandemic shocks related to crude oil prices, except those appearing in this issue of Energy Research Letters. In this paper, we attempt to fill this gap by paying particular attention to transitory shocks (associated with the trend stationary processes) and permanent shocks (related to difference stationary processes). We focus on the degree of persistence inherent in the crude oil price series.
There is already a literature that has studied the integration order of energy prices (see Berck & Roberts, 1996; Ferreira et al., 2005; Jawadi & Bellalah, 2011; Monge, Gil-Alana, & de Gracia, 2017; Monge, Gil-Alana, & Pérez de Gracia, 2017; Perron, 1989; Pindyck, 1999; Postali & Picchetti, 2006; Zivot & Andrews, 1992, among others). In light of this literature, the contribution of our paper is twofold. First, to our knowledge, this is the first paper that proposes to study the time series properties of crude oil prices during the COVID-19 pandemic using daily data. Second, in this paper we use methods based on long run dependence and long memory using fractional integration techniques which (a) are more general than other standard methods based on ARMA and/or ARIMA models and (b) uniquely consider integer orders of integration.
The rest of the paper is structured as follows. Section 2 presents the paper’s methodology. Section 3 describes the data and presents the results, while Section 4 concludes the paper.
2. Methodology
The methodology used is based on fractional integration, which is appropriate to determine if a shock in a given series has a permanent or a transitory effect. The method is also more flexible than other classical methods based on integer degrees of differentiation. Thus, if the order of integration (d) is smaller than 1, the series is mean reverting, with the effect of the shock disappearing in the long run. On the contrary, if d is equal to or higher than 1, its effect will be permanent, persisting forever.
We estimate the differencing parameter by using a version of the test proposed by Robinson (1994) and widely used in empirical applications. The test is based on the Whittle function in the frequency domain. The estimated model is the following one,
yt=β+γt+xt;(1−L)dxt=εt, t=1,2,…,T(1)
where is the time series we observe, and are unknown coefficients referring to a constant and a potential linear time trend, and d is the differencing parameter that may be a fractional number, is the error term that is supposed to be i.i.d. with zero mean and a constant variance.
3. Data and results
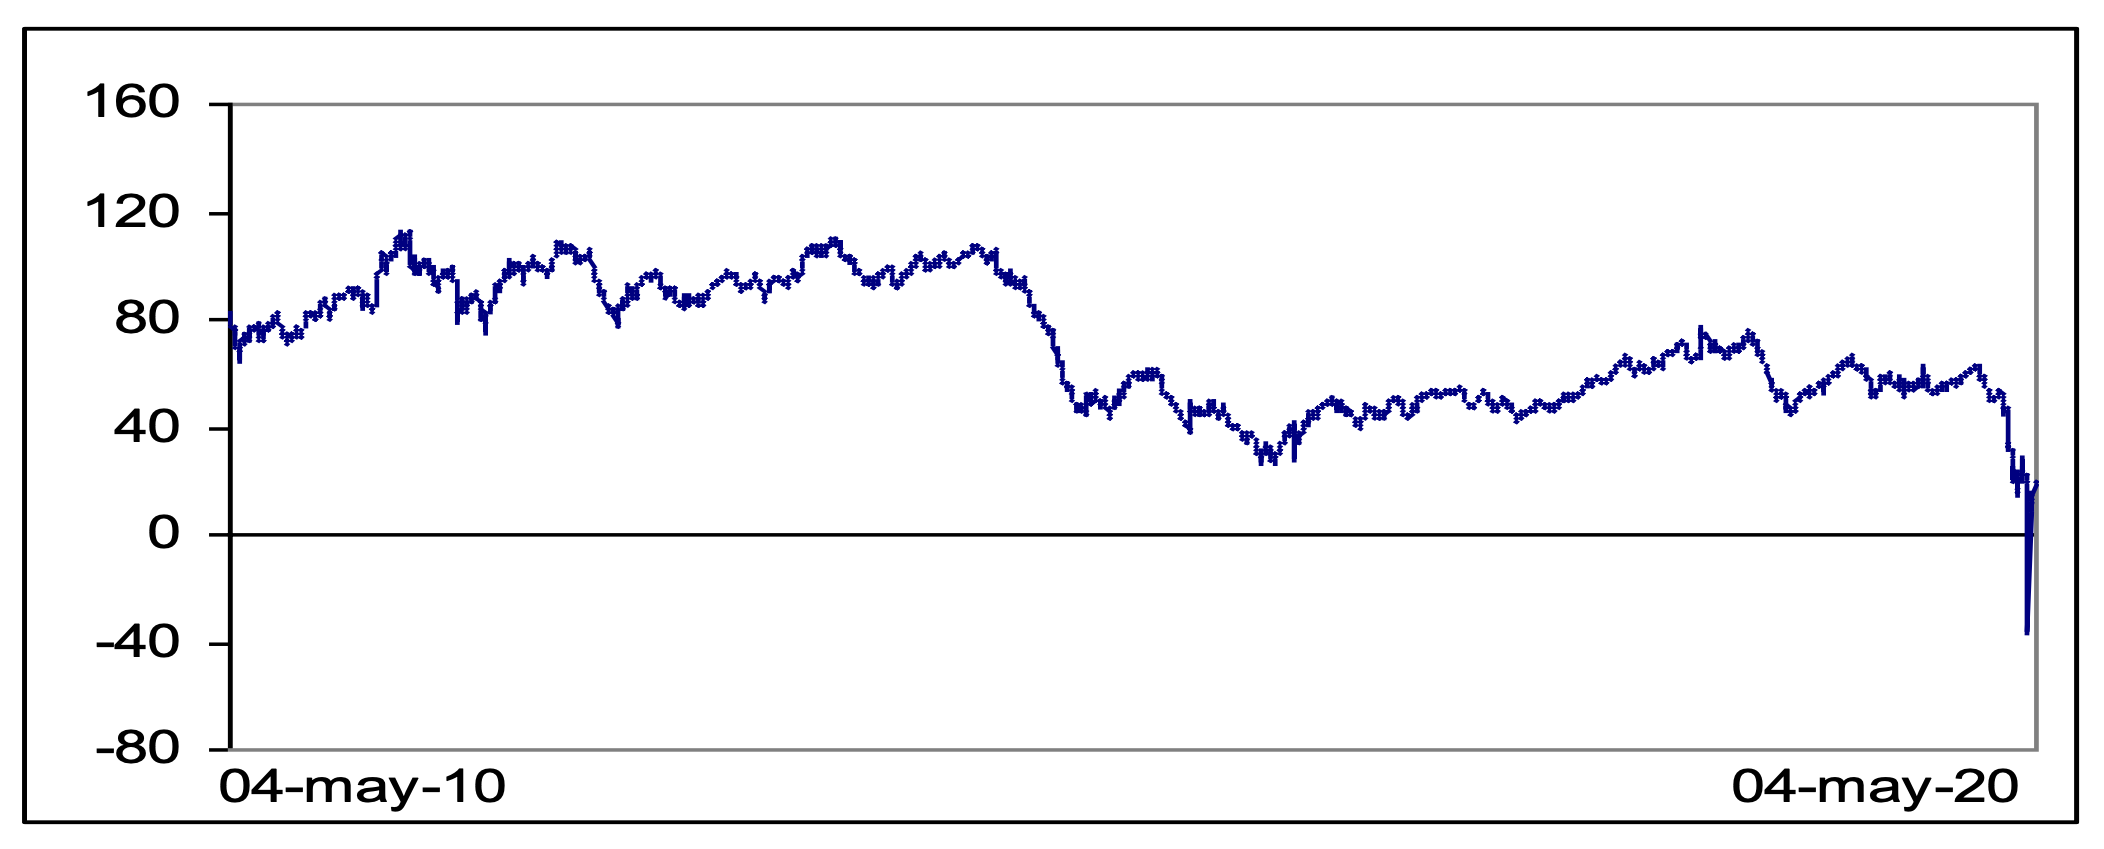
The data examined in this research paper, WTI crude oil prices, was obtained from the Federal Reserve Bank of St. Louis and is plotted in Figure 1. We use daily observations for a time period that covers the time May 04, 2010 until May 04, 2020, leading to 2,611 observations.

We start by estimating d for the whole sample. Results are displayed in the first row of Table 1. We observe that the time trend is statistically insignificant, and the estimated value of d is equal to 0.84, being significantly smaller than 1 and thus, showing some degree of mean reverting behaviour. However, if we compute the model with the data ending at January 20, 2020, that is, at the time of the first case of COVID-19 detected in the US, the results, presented in the lower part of the table, indicate an order of integration equal to 0.97 and the unit root null hypothesis cannot then be rejected. This seems to indicate that the onset of COVID-19 has influenced the degree of integration of the series, creating more inefficiencies in the market. Moreover, the fact that the estimate of d is lower than 1 indicates some evidence of mean reversion, though with the effect of the shock takes a long time to disappear by itself.
We next estimate d recursively, starting with a sample ending on January 20, 2020, and then adding one observation each time. Figure 2 displays the estimates of d along with its 95% confidence band. It can be seen that the estimate of d remains relatively stable around 0.98 across the different subsamples, until April 21, 2020, when there is a substantial decrease in d to 0.84. Since then, the estimates of d are around that value, this represent evidence of mean reverting behaviour. This implies that in the event of an exogenous shock affecting the series, it will return by itself to its original long term projection though based on the large estimate for d, it can take a long period of time.

4. Conclusions
We have examined in this paper the daily structure of the WTI crude oil prices from May 04, 2010 to May 04, 2020. Using fractional integration techniques, our results indicate that the unit root or I(1) null hypothesis cannot be rejected in the data if the sample ends at 20-01-2020 (pre-COVID-19 period). This indicate that a random walk model is plausible, and thus supports the market efficiency hypothesis in its weak form. However, including the data during the pandemic phase shows that the order of integration of the series is reduced to 0.84. This implies that oil price series is mean reverting, thus shocks to oil price are transitory albeit with long lasting effects.
Acknowledgments
Prof. Luis A. Gil-Alana gratefully acknowledges financial support from the MINEIC-AEI-FEDER ECO2017-85503-R project from ‘Ministerio de Economía, Industria y Competitividad’ (MINEIC), ‘Agencia Estatal de Investigación’ (AEI) Spain and ‘Fondo Europeo de Desarrollo Regional’ (FEDER). Prof. Luis A. Gil-Alana and Assoc. Prof. Manuel Monge also acknowledge support from an internal Project of the Universidad Francisco de Vitoria. Comments from the Editor and an anonymous reviewer are gratefully acknowledged.