I. Introduction
While for over a decade the focus was on how effective oil prices were in predicting stock market returns (D. Zhang & Cao, 2013), recently focus has shifted to forecasting/predicting oil prices itself (see Gong & Lin, 2017; Yi et al., 2018; Y.-J. Zhang & Wang, 2019). Our hypothesis fits in this literature: we propose to test whether oil price news and COVID-19 (which occurred at the time oil price was in an historic collapse) successfully predict oil prices.
Our hypothesis test is unique for two reasons. The first reason is that we have a unique dataset on oil price news (both positive and negative news) that has not been utilized to study its ability to predict oil prices. We do and show that while both positive and negative news predict oil prices, it is the negative news that has a stronger role in predicting prices. The second reason is that we employ COVID-19 as an information variable to see whether global daily new cases of COVID-19 predict oil prices. We do this because the collapse of oil prices and the onset of the pandemic were two phenomena simultaneously unfolding. We show that COVID-19 did predict oil prices.
Several studies document different factors that responsibly and meaningfully predict oil prices. Y.-J. Zhang & Wang (2019), for instance, document the role of high frequency stock market data; Yi et al. (2018) successfully employ a range of predictors to forecast oil prices; and Salisu et al. (2020) show that Google trends data helps predict precious metals. None of these studies consider news data specific to a particular commodity. In our case, the commodity is oil, and we focus on oil price. We specifically consider oil price news—both negative and positive news. The motivation for our work is Narayan (2019), who showed that oil price news predicts stock market returns. In his work, the data sample on news was up to 2013. We extend this dataset, using the same manual data collection method described in Narayan (2019), to May 2020. Our contributions to the literature, therefore, are twofold. First, we create a oil price positive and negative worded news dataset, which we will make available on request. The implication is that researchers can use the dataset to test other hypotheses. Second, our paper is the first to use oil price news data to predict oil prices and shows the success of particularly negatively worded news. During the more recent time period, marked by the onset of COVID-19, we show that COVID-19 (the number of new global cases of daily virus) helps predict oil prices as much as oil price news does particularly when oil price volatility is used as a threshold. By showing this evidence, we make the point that COVID-19 pandemic has coincided with one of the most dramatic collapse of oil prices—therefore, the period marked by COVID-19 also reflects higher negative news. Whether or not the negative news on oil emanated from COVID-19 is an interesting question in itself and warrants further investigation –one that is outside the scope of this paper though. We leave this for future work.
II. Data and results
A. A note on data
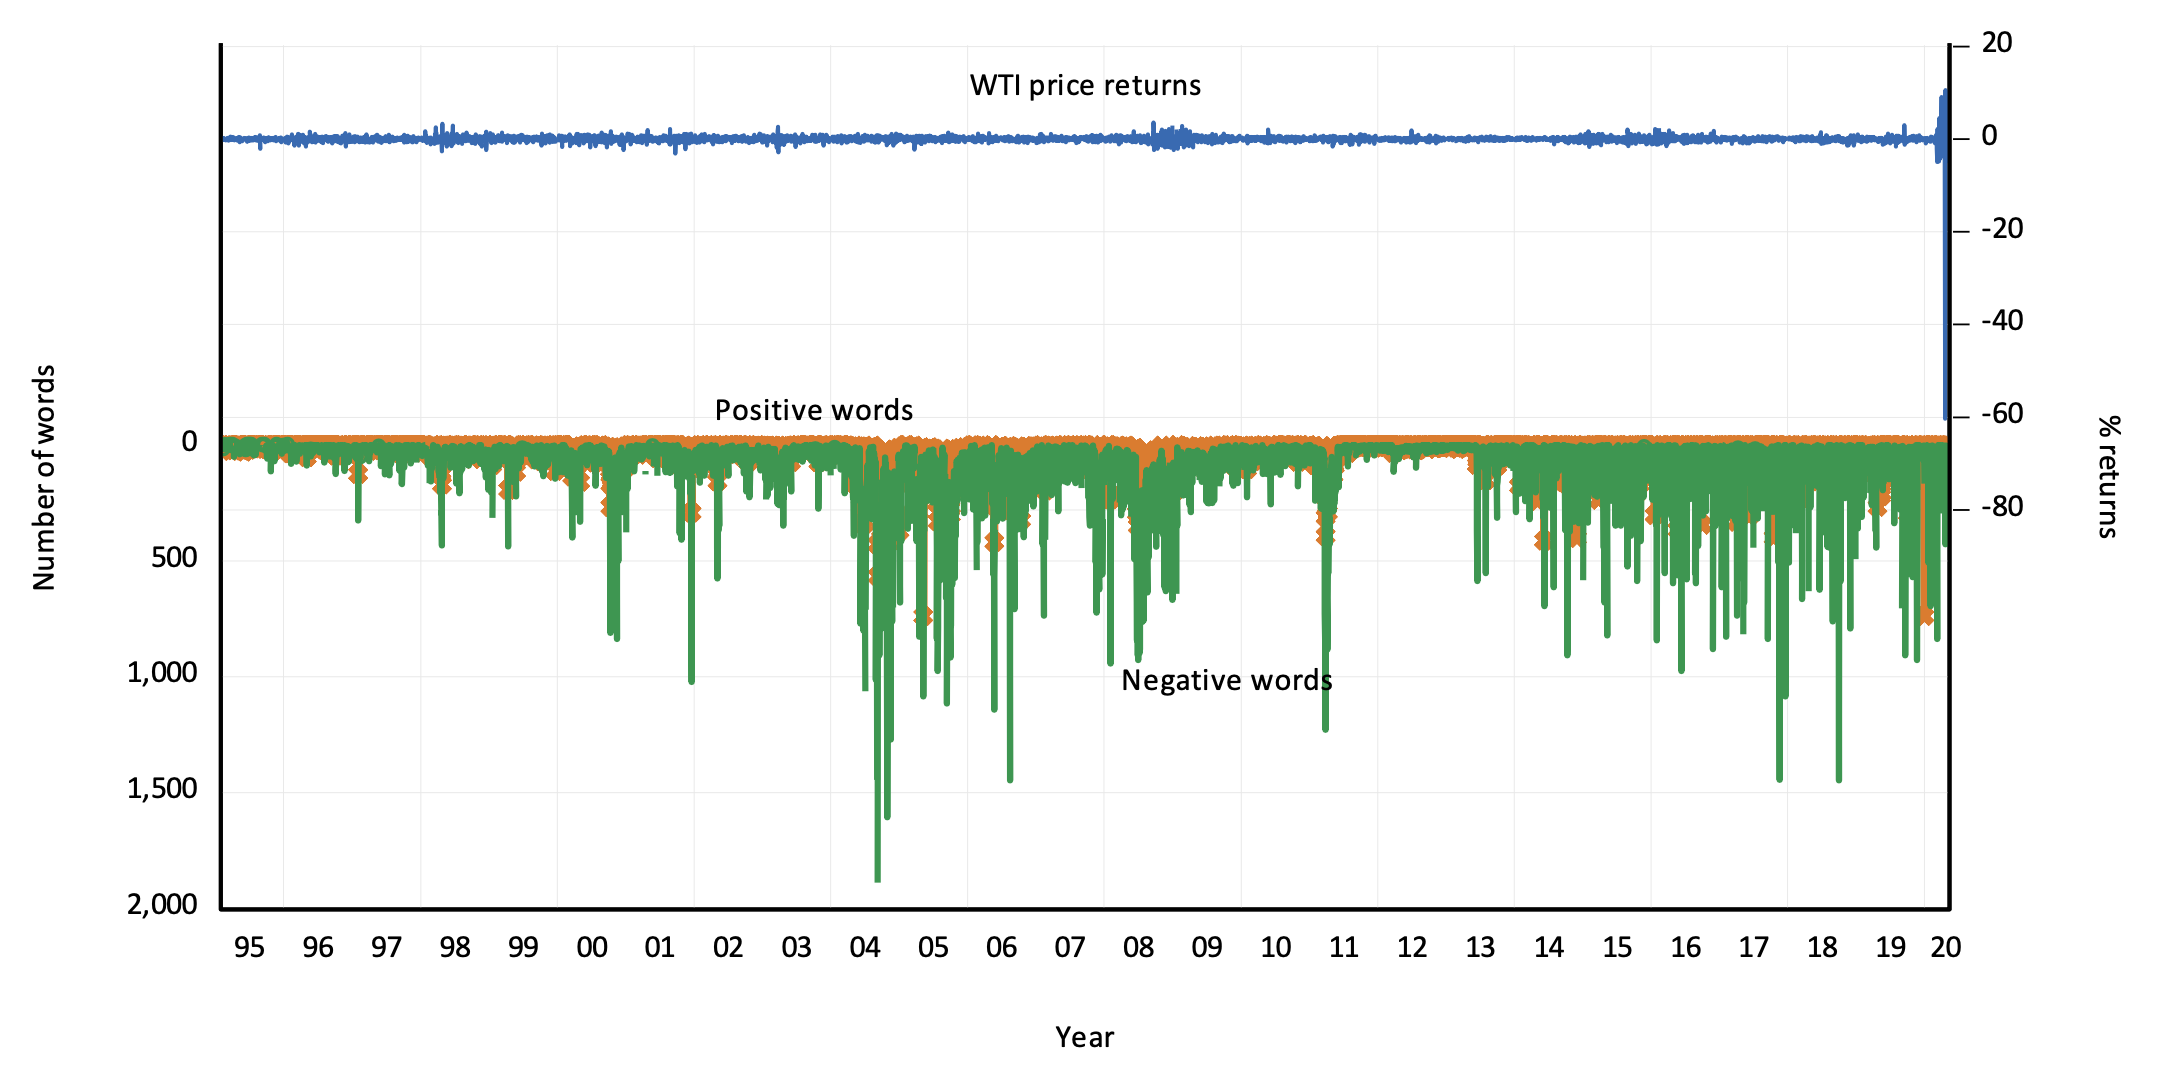
Our dataset is daily and covers the sample 2/01/1995 to 5/05/2020 for a total of 6,590 observations. Specially, four data series make up the story in this paper. The first is the WTI oil price (OP). This data are obtained from the EIA website; see https://www.eia.gov/dnav/pet/hist/RWTCD.htm. Using this price data, we compute returns as The second data is the global new cases of COVID-19. We do not consider COVID-19 deaths because deaths are a direct function of cases and share a high correlation. We focus on cases because they provide a broader picture of the COVID-19 situation. Daily data for this, covering the sample 12/31/2019 to 5/05/2020, are obtained from our world in data website; see https://ourworldindata.org/grapher/daily-cases-covid-19. The last two data series relate to the oil price news. These are hand collected. Data from 1995 to 2013 was collected by Narayan (2019). We extend the dataset, using the same approaches as discussed in Narayan (2019) to May 2020. Figure 1 plots the data on WTI price returns and the number of negative and positive worded oil price news.

Selected descriptive statistics of the data are reported in Table 1.[1] In addition to COVID-19 cases, three variables are of interest: WTI price returns, positive news and negative news. The mean, standard deviation, minimum and maximum statistics of each variable are reported together with the Narayan & Popp (2010) two endogenous structural break test. Our reason to choose this test is motivated by Monte Carlo simulation results in Narayan & Popp (2013). Apart from statistics reported for the full-sample (2/01/1995 – 5/05/2020), we consider a pre-COVID-19 sample (2/01/1995 – 30/12/2019) and a post-COVID-19 sample (31/12/2019 – 5/05/2020).
The sample split into a pre-COVID-19 and post-COVID-19 periods offers some interesting insights. The first thing of note is oil price returns. In the pre-COVID-19 period, daily mean returns were 0.0358% (or 13.03% per annum); however, the onset of COVID-19 saw a dramatic drop in oil returns to a daily mean of -5.14%. Similarly, the volatility of oil price returns before the pandemic was 2.40% while during the pandemic volatility was at least 16 times more. The number of positive and negative words also sees a drastic difference in the two periods. While there was hardly much change in the number of positive words in the two periods, there were more negative worded news about oil price in the COVID-19 period than in the pre-COVID-19 period. Overall, in the COVID-19 phase, both the oil price and the oil price negative news were very different compared to pre-COVID-19 period. One possible implication is that negative news may have a greater effect on the evolution of oil prices. Formal tests in the next sub-section will evaluate this prospect. To conclude reading the data, we perform the structural break unit root test (see Narayan & Popp, 2010, 2013) on all three variables and conclude that the unit root null is safely rejected at the 1% level. The implication is that they can be used in the regression model in the form in which they appear in Table 1.
B. Results
The results appear in Table 2. We consider two types of threshold effects to test how COVID-19 and oil price news affect oil prices. We then employ two forms of the threshold regression models; the first model has no control variables while the second model takes the volatility of oil price returns (proxied by squared returns) as a control. The time-series threshold regression model has the following representations:
WTIRt=c+β1Yt−1I(TVt−1≤α)+β2Yt−1I(TVt−1>α)+β3VOLt+εt
In this regression, is the WTI oil price returns (in percentage form), Y is one of the predictors (COVID-19, negative oil price news, or positive oil price news), is the threshold variable (either COVID-19 cases or WTI price return volatility, Finally,
Results reported in Panel A consider COVID-19 as a threshold variable. We examine whether the effect of oil news and COVID-19 cases is conditional on a threshold value of cases of COVID-19. We see that the manner in which COVID-19 influences oil prices is conditional on the number of COVID-19 cases. Results from control-based model suggest a threshold value of COVID-19 cases to be 84,479 and while COVID-19 predicts oil prices both when cases are below and above this threshold, the effect is stronger when the number of cases is above the threshold. The result is also statistically different from zero with a minimum t-statistic of 2.170. On the role of oil price news, when using COVID-19 as a threshold, there is limited evidence that oil price news predicts oil prices. We observe that only when the threshold value of COVID-19 cases is in excess of 77,434 does negative oil price news predict oil prices (t-statistic = 1.753). This evidence is however statistically weak.
In the second case, we use as threshold variable the oil price return volatility, where volatility is proxied by squared oil price returns. The results in Panel B suggest that positive news has no effect on oil price. However, when volatility is higher (> 9.916%) negative oil price news predicts oil prices (0.0036, t-statistic = 2.928). COVID-19 cases influence oil prices too but only when oil price volatility is significantly high (>499.95%). In this case, the slope predictive coefficient is 0.0005 (t-statistic = 3.502). The message is that when oil price volatility is high, it is negative oil price news that dominates the evolution of oil prices.
III. Concluding remarks
In this note, we focus on estimating predictors of oil prices. Two events in recent times –namely, the COVID-19 pandemic and oil price news—matter to the evolution of oil prices. This is what we hypothesize. The collapse of oil prices, including its record and unprecedented negative price, occurred during the time when COVID-19 had halted much of global economic activity. Deprived of lack of knowledge on the respective roles of COVID-19 and oil price news on oil prices, we set out to investigate how they have influenced oil prices. We employ a threshold regression model that helps us answer how these variables influenced oil prices when COVID-19 infection cases and oil price volatility reached a certain threshold. We show that there is a threshold value of 84,479 COVID-19 infections after which COVID-19 has had a bigger effect on oil prices. There is limited role discovered in our analysis for oil price news when conditioned on COVID-19 cases. However, when we use as threshold the oil price return volatility variable, we unravel that while both COVID-19 cases and negative oil price news influence oil prices, it is the negative oil price news that dominates the effect on oil prices beyond a certain threshold of volatility. As a by-product, our paper produces daily time-series data on oil price news which can be useful for future researchers. This data are available upon request.
Before we read Table 1, a note on global cases of COVID-19 is in order. This data only has 91 observations from 31/12/2019 to 5/05/2020. This is insufficient for unit root testing, so we do not perform one. A lot is known about this data, so we do not spend time on it. However, it is worth pointing out that over the sample period, daily mean new cases of COVID-19 was 44,691.